.png)

November 7, 2025
Recalls at major automakers cost hundreds of millions of dollars a year. It’s a huge issue. To mitigate it, our company created an analytics department solely focused on categorizing warranty claims into actionable problems.
For decades, this team has relied on SQL queries to classify warranty data. But vehicles—and the language used to describe them—have evolved. SQL struggles with semantics, negations, and contextual nuance. Here’s a fictional example of a claim we might see in the wild:
“Customer reports oil on driveway, thought engine leak. Detailed inspection found no engine leaks. Traced oil to spill during last oil change. Oil on subframe dripping to ground. Cleaned subframe, verified no leaks from engine or drain plug. Customer advised.”
An oversimplified SQL query that might try and capture this scenario:
What we can gather from this example is that the leak came from a service oil spill—not the vehicle. Yet this query would still flag it as a leak. In production, these types of queries balloon into hundreds—if not thousands—of similar clauses. Over the years, the team created thousands of classification buckets. Many of these legacy buckets still siphon off claims today—creating unnecessary work for analysts and slowing down the detection of new issues.
The classification project
In 2023, the company launched a major initiative to automate warranty classification using supervised models. Here’s how that went:
-
Data Collection: The first challenge was establishing a ground truth. Each team member had different mental models of how claims should be categorized. After months of discussion, the team finally aligned on a set of core “symptoms” to categorize warranty claims by. Then came the hard part: manually labeling thousands of complex claims per symptom—work that only domain experts could handle. After many months we had labeled just half the symptoms.
-
Preprocessing: Raw warranty text is messy—full of acronyms, error codes, and multilingual input.
“cust reports mil on with p0420. tech found a/c compressor clutch noise at idle. checked map sensor, reading normal. replaced cat converter per tsb. dtc cleared, road test ok.”
Translation: Customer reports a check engine light. Technician found an unrelated AC compressor issue. Catalyst converter was replaced per technical service bulletin. Problem resolved.
We built a 9 stage preprocessing pipeline: text sanitization, concatenation, tokenization, acronym expansion, stop word removal, spell checking, service bulletin extraction, diagnostic code parsing, and translation. That took another 6 months.
Fun fact: Translating French and Spanish claims into German first improved technical accuracy—an unexpected perk of Germany’s automotive dominance.
-
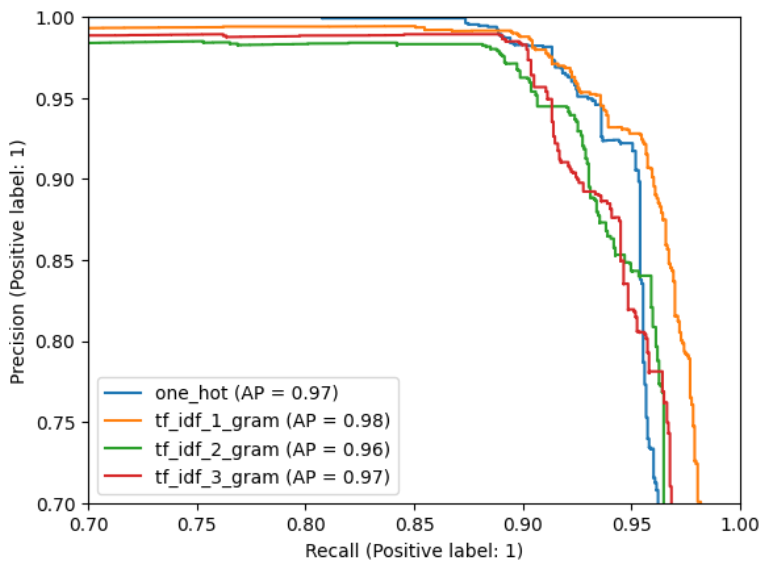
Modeling: We tried multiple vectorization and classification approaches. Our data was heavily imbalanced and skewed towards negative cases. We found that TF-IDF with 1-gram features paired with XGBoost consistently emerged as the winner. See the PR curve attached below [1]
Getting to production was another challenge. Migrating everything to the cloud, building a UI for our analytics team, onboarding vendors, and coordinating with IT—the project stretched across multiple years. Our plan was to deploy the first 10 models, gather real world feedback, and resume labeling for the remaining symptoms. But once the initial batch of classifiers went live, project priorities shifted: the scope expanded to deploying all classifiers, while the team previously helping with annotation had moved on to new initiatives.
We suddenly had a data scarcity problem. How do you deploy models without training data? Even with renewed labeling efforts, it would’ve taken months to label new datasets. We needed a faster, more flexible solution.
What about large language models?
We actually tried few-shot prompting with GPT-3.5 at the start of this project—but the results were disappointing: low accuracy, high latency, and prohibitive costs. Fast forward two years, and the landscape had radically changed. Modern models were faster, cheaper, and showed strong few-shot performance across various domains. That raised a question: could we get within 5% of our purpose-built classifiers?
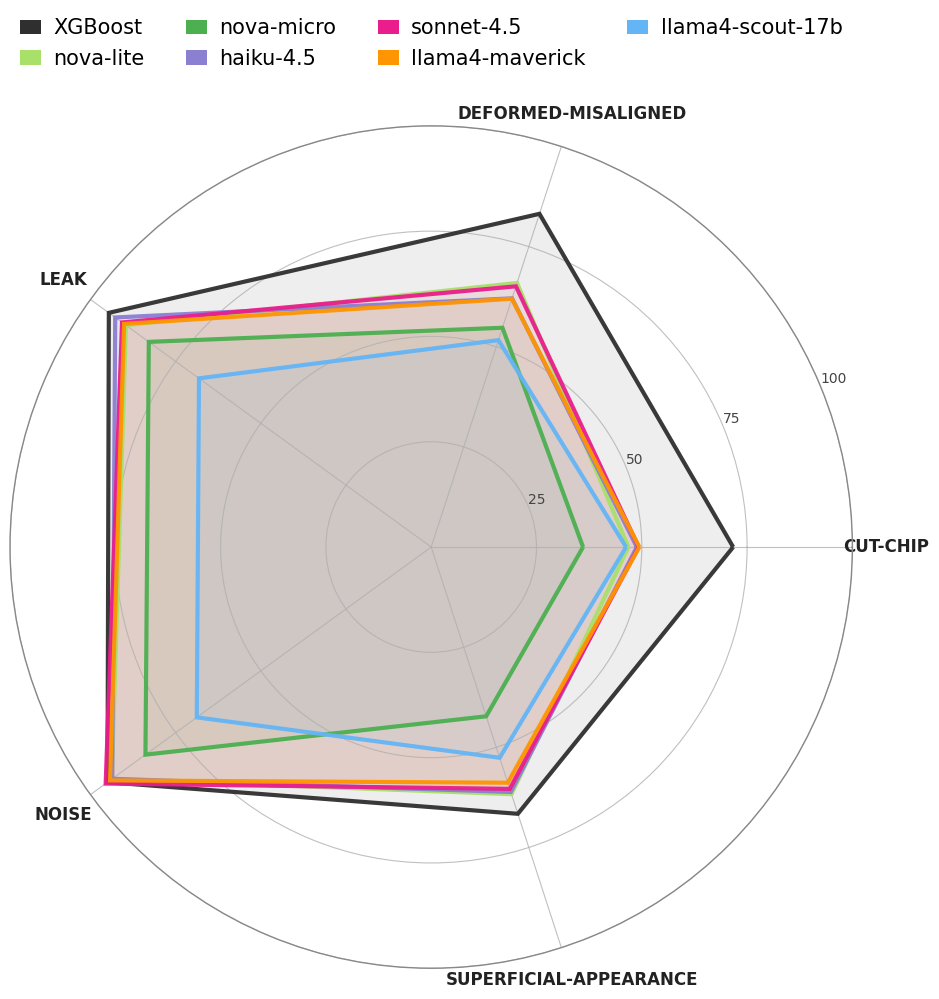
To find out, we benchmarked 6 frontier models against our baseline using 5 labeled datasets ranging from broad symptoms like leak and noise to narrow ones like cut-chip. With our data skewed toward negative cases, we chose PR AUC as the primary metric, backed by Matthews Correlation Coefficient (MCC) and F1. The early results? XGBoost still led by ~15% on average, especially on the hardest tasks, though LLMs showed promise in broader categories. (See chart below.)
Closing the gap
When we factored in cost, Nova Lite was the clear value pick—third best PR AUC score, yet the second cheapest model [2]. So we pushed forward with it and began iterating on our prompts.
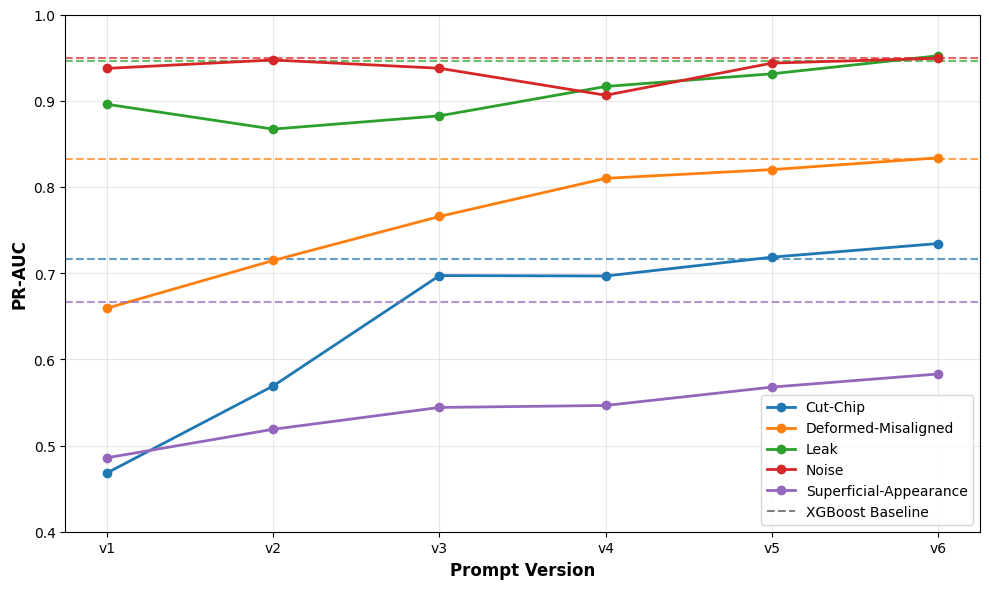
Our prompt tuning combined evaluation with reasoning. For each symptom, we ran Nova Lite on a stratified sample of labeled data, capturing two outputs: the prediction and its reasoning. We compared results to the ground truth, analyzed where prompts failed, and used those reasoning traces to identify gaps. Failure cases and the current prompt were then passed to a larger LLM to generate refinements. Each version was re-evaluated multiple times to confirm accuracy and rule out noise. See the step-by-step progression [3].
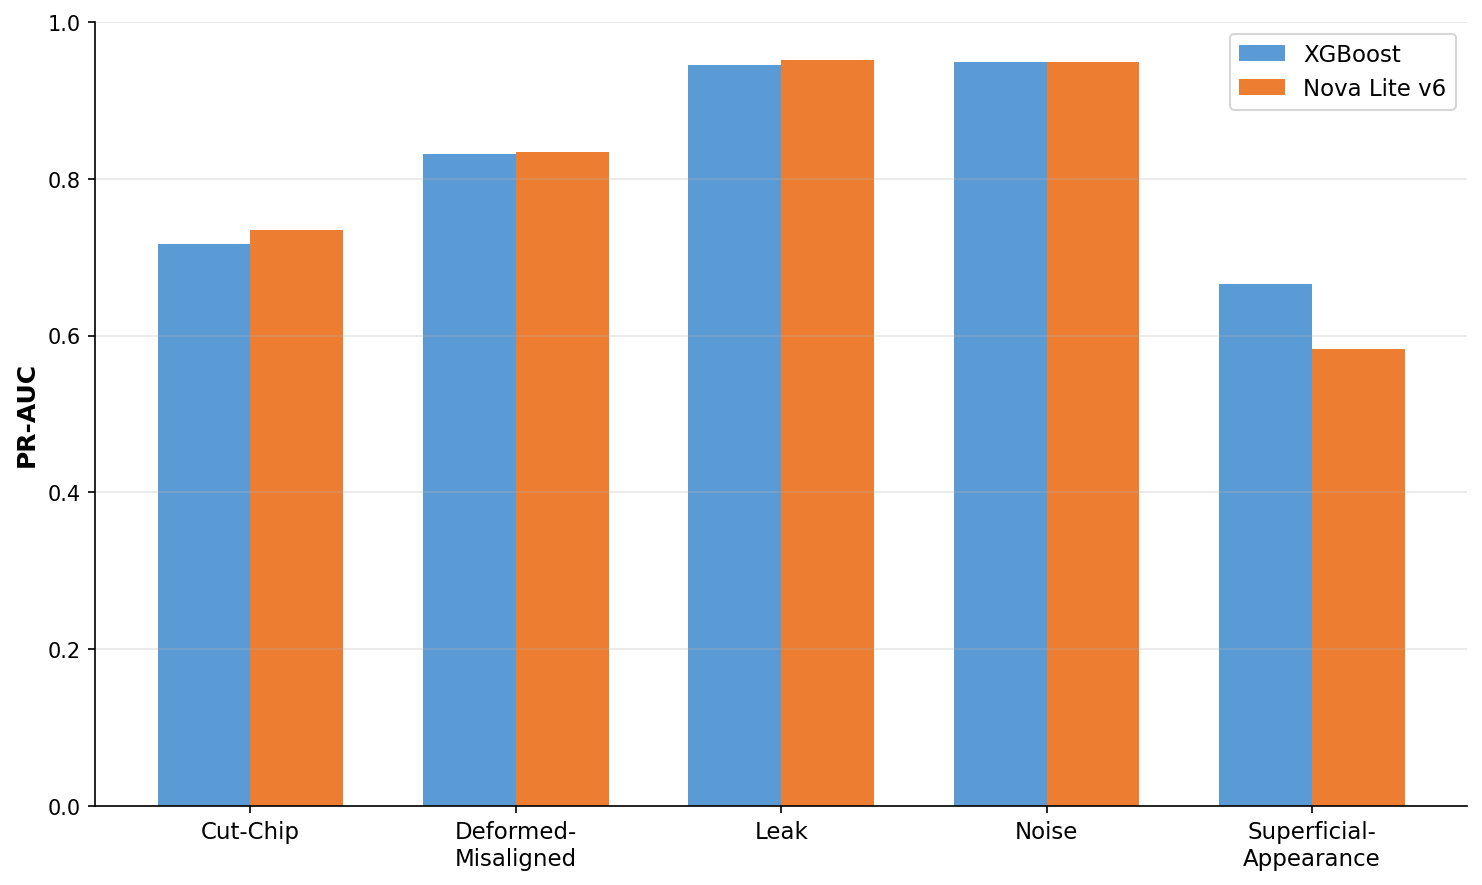
After 6 rounds of refinement, Nova Lite closed the performance gap and matched—or slightly beat—our supervised XGBoost model in 4 of 5 categories (cut-chip, deformed-misaligned, leak, and noise). The biggest leap was cut-chip, which improved 35 points and edged ahead of our baseline. Broader categories like noise and leak started strong and saw only marginal gains. Superficial-appearance remains the exception—still trailing by 12 points, which suggests it may need a different modeling approach entirely.
So What?
Over multiple years, we built a supervised pipeline that worked. In 6 rounds of prompting, we matched it. That’s the headline, but it’s not the point. The real shift is that classification is no longer gated by data availability, annotation cycles, or pipeline engineering. The constraint moved—from collecting examples to writing instructions. That’s not a marginal improvement; it’s a different way of building classifiers.
Supervised models still make sense when you have stable targets and millions of labeled samples. But in domains where the taxonomy drifts, the data is scarce, or the requirements shift faster than you can annotate, LLMs turn an impossible backlog into a prompt iteration loop.
We didn’t just replace a model. We replaced a process.
[1] PR curve exploring various vectorization methods.
[2] Price vs. performance table
| Claude Sonnet 4.5 | $3.00 | 0.722 |
| Claude Haiku 4.5 | $1.00 | 0.717 |
| ⭐ Nova Lite | $0.06 | 0.716 |
| Llama 3.3 70B | $0.72 | 0.712 |
| Llama 4 Maverick 17B | $0.24 | 0.709 |
| Nova Micro | $0.04 | 0.600 |
| Llama 4 Scout 17B | $0.17 | 0.575 |
** All LLM prices shown are on-demand. Batch pricing is ~50% lower.
[3] Prompt by prompt progression