.png)

Introduction Link to heading
Imagine you opened Activity Monitor to check how much memory your application consumes.
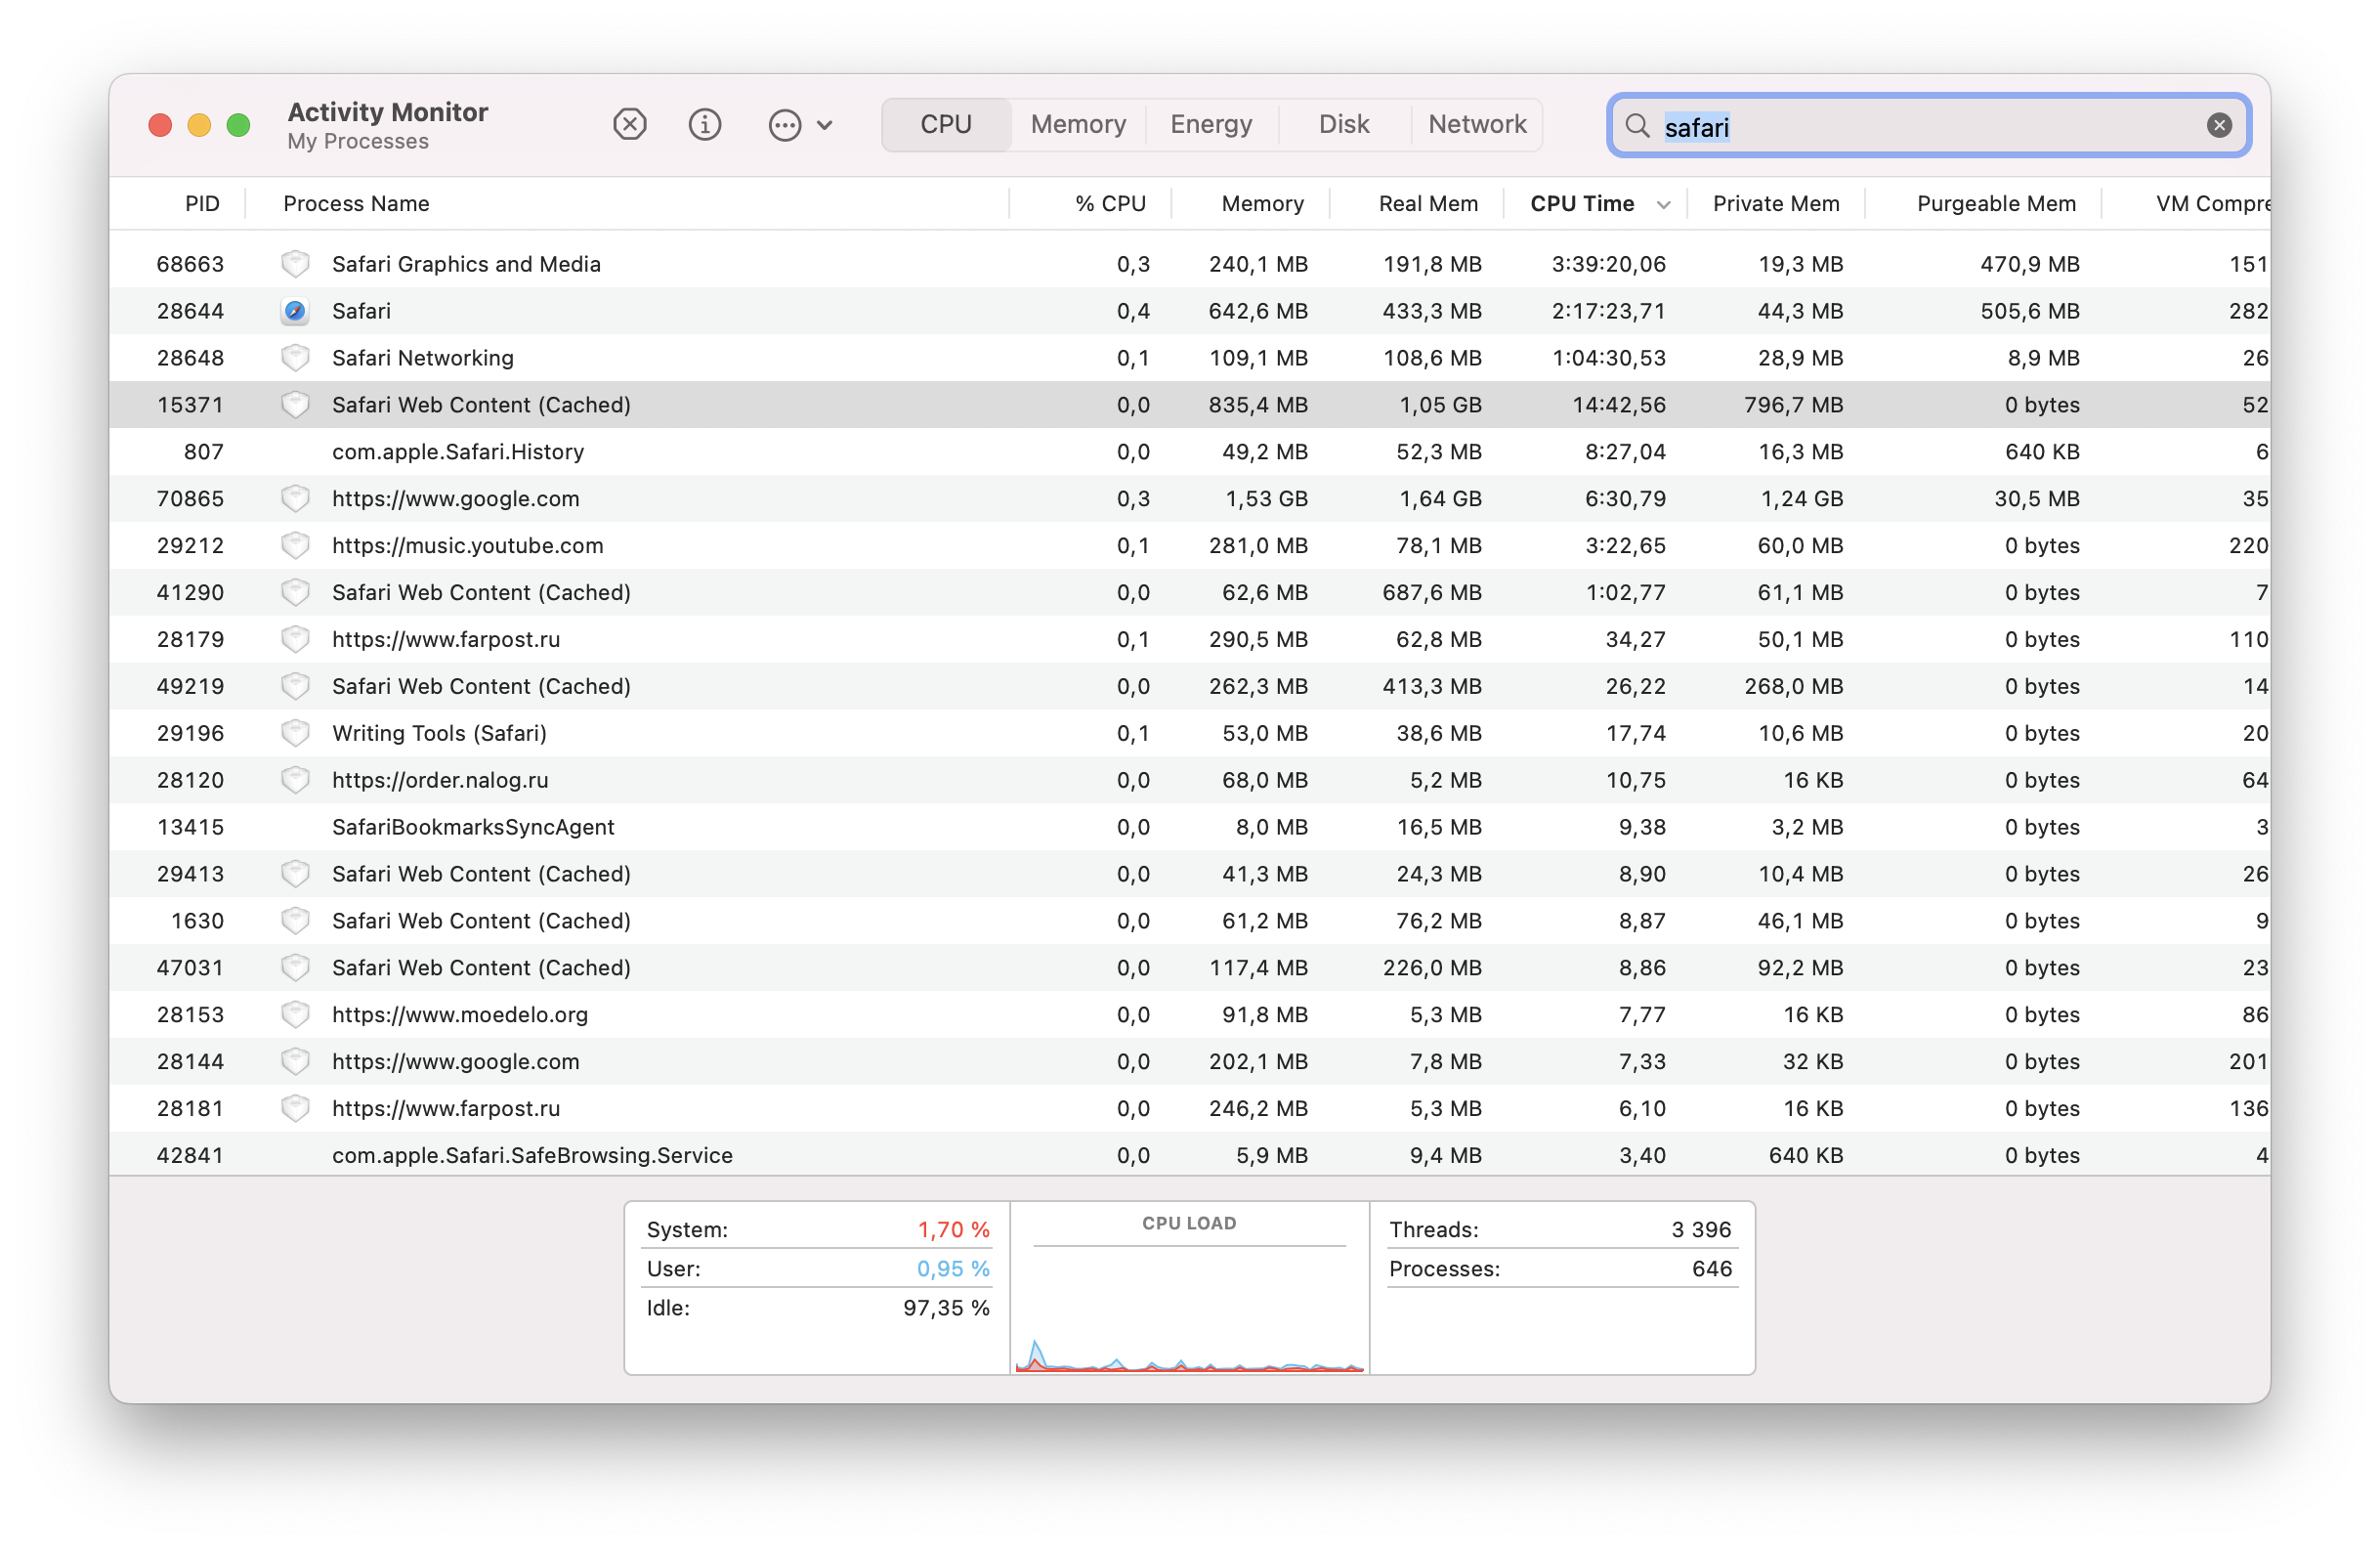
But wait, which number should you actually look at? Suppose there’s “Memory” showing 800 MB, and “Real Memory” showing 1 GB. What’s the difference?
Note
Activity Monitor doesn’t display those two readings by default. To show them, you need to right-click on a table header and select them.
This exact scenario happened to me more times than I’d like to admit. As someone who keeps Activity Monitor perpetually open, I found myself constantly puzzled by these two memory metrics. Coming from a Linux background where RSS (Resident Set Size) tells a straightforward story, macOS’s dual memory reporting felt like reading tea leaves.
When building desktop applications, users inevitably notice high memory usage and start asking tough questions. “Why does your app use so much memory?” becomes a lot harder to answer when you’re not entirely sure what the numbers mean yourself.
In this post, I’ll describe my findings – how you can programmatically read Memory and Real Memory metrics and what exactly they mean.
Peering Behind the Curtain Link to heading
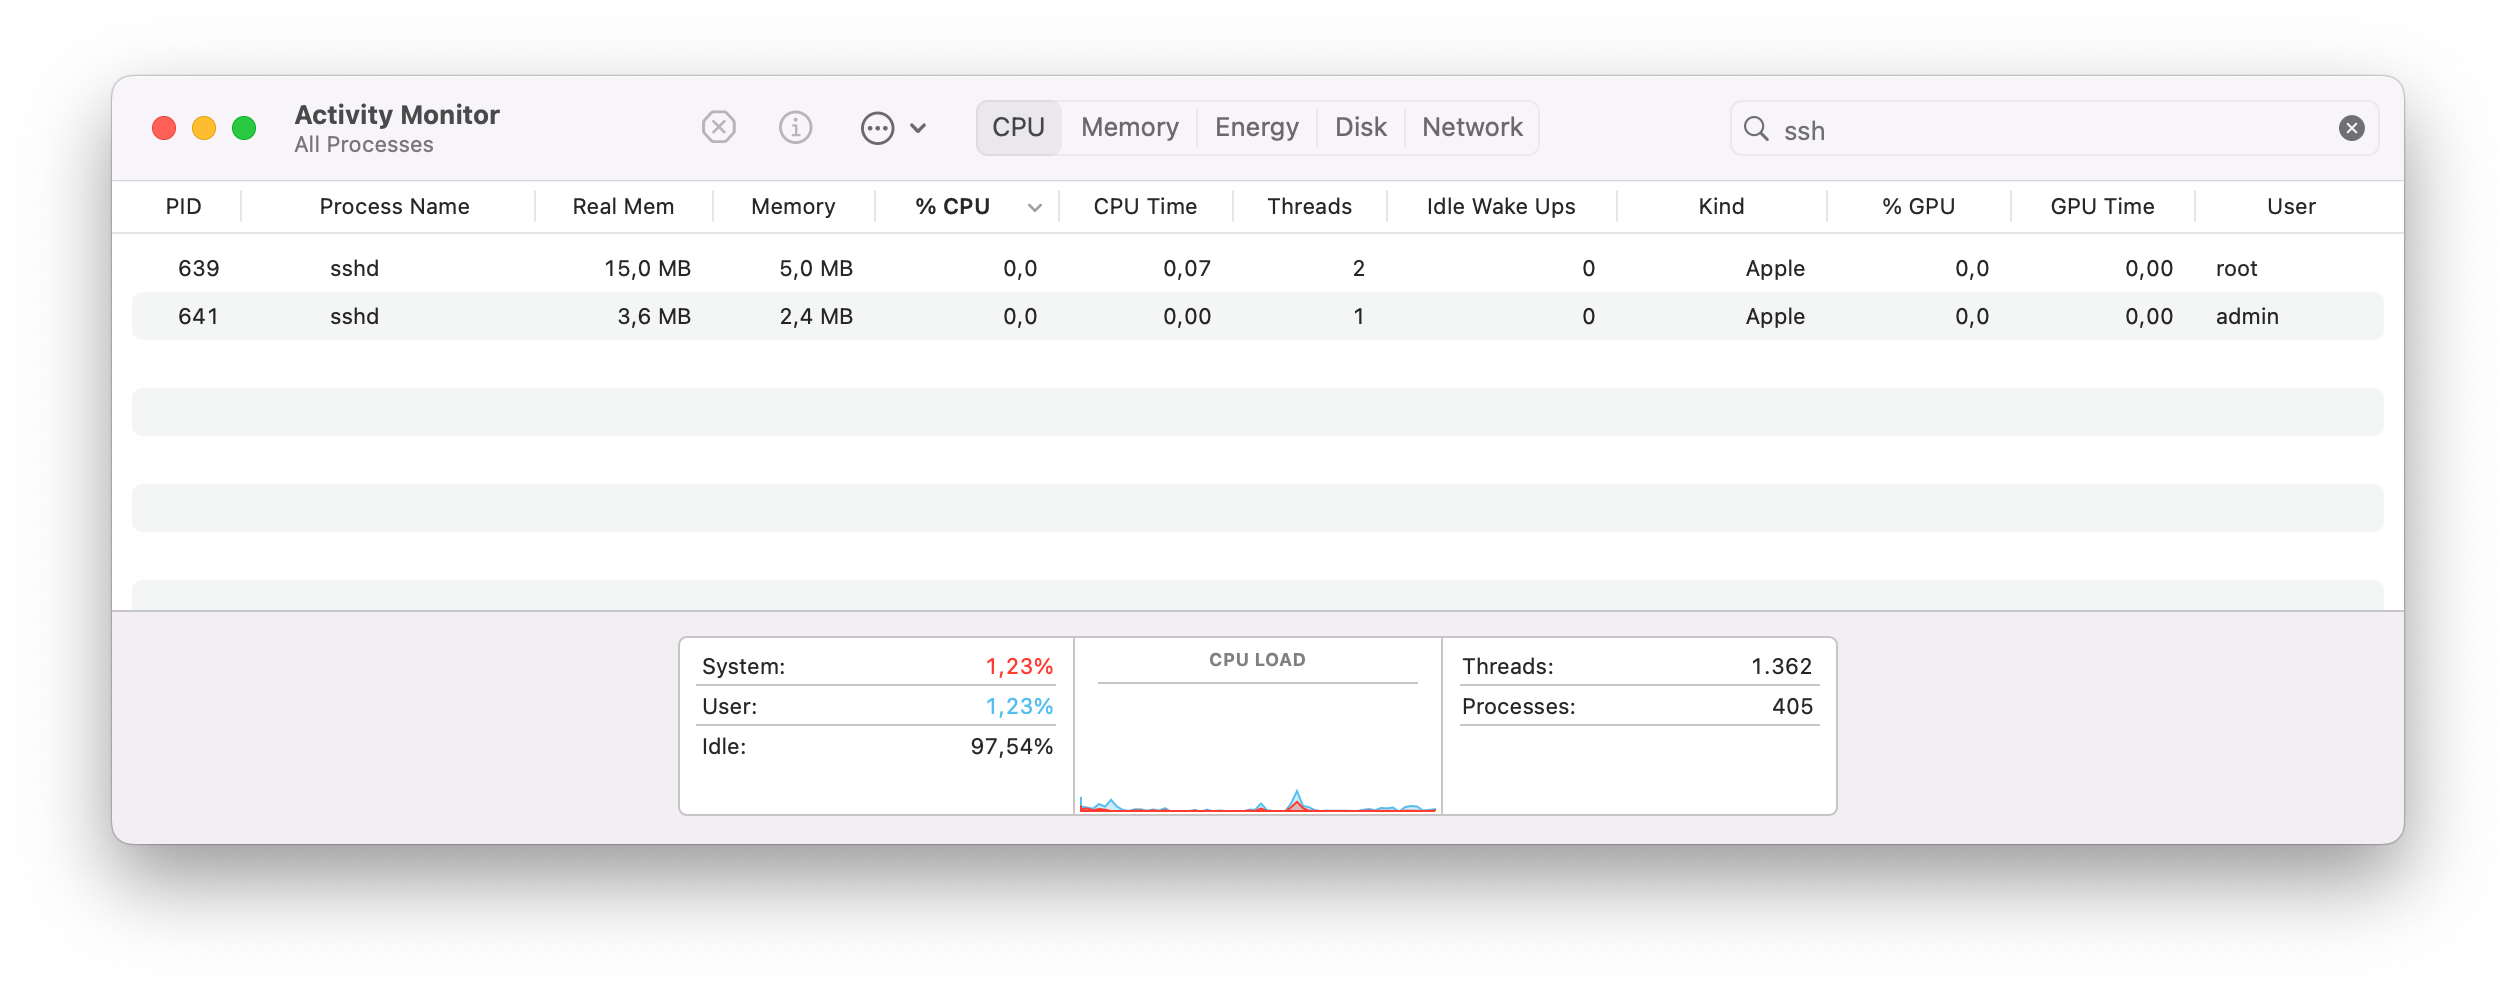
I assumed Activity Monitor was this monolithic application doing all the heavy lifting of process monitoring. But when I started digging into its internals, it turns out Activity Monitor is just the tip of the iceberg. The real work happens in a background process called sysmond – the system monitor daemon. Activity Monitor simply uses a system library called libsysmond.dylib to communicate with this daemon through XPC (Inter-Process Communication). sysmond handles all the complex process introspection, while multiple clients can tap into that data stream.

There’s a libsysmon.dylib system library that contains an API to communicate with sysmond. It has a fairly simple API surface:
The key functions are:
- sysmon_request_create() - Creates a new data request and accepts a callback that will be executed when the request completes
- sysmon_request_add_attribute() - Specifies what data you want (memory, CPU, etc.)
- sysmon_request_execute() - Fires off the request and gets results
- sysmon_table_get_count() - Tells you how many processes were found
- sysmon_row_get_value() - Extracts specific values from the results
You build a request by specifying which attributes you want for each process, execute it, and get back a table of results. By analyzing Activity Monitor, I discovered that our mysterious Memory and Real Memory metrics correspond to attribute codes 0x42 and 0x16, respectively. The full list of sysmond attributes and corresponding library calls is available on GitHub.
My first thought was that I could use those functions to read memory metrics directly from sysmond and bypass Activity Monitor entirely. And this is possible… sort of. I wrote a simple proof-of-concept to validate my theory.
The numbers matched Activity Monitor perfectly, but there is a catch. Only processes with the special com.apple.sysmond.client entitlement can connect to sysmond. Even if I tried to sign my executable with this entitlement, macOS would unceremoniously kill it during loading:
Restricted entitlements not validated, bailing out. Error: Error Domain=AppleMobileFileIntegrityError Code=-420 "The signature on the file is invalid" UserInfo={ NSURL=<private>, NSLocalizedDescription=The signature on the file is invalid }This was Apple’s security model doing its job – preventing arbitrary code from accessing system monitoring data. You need to disable SIP (System Integrity Protection) and AMFI (Apple Mobile File Integrity) to run this example.
Warning
Disabling SPI and AMFI is not something I’d recommend outside of a virtual machine.
The libsysmond route was effectively a dead-end, but there’s always another way in. First of all, if the only thing you need is a Memory value, you can use the footprint command. It reports exactly that, but may require sudo even if the process is running under the same user account. So I dug deeper into sysmond itself, and discovered something interesting: it wasn’t performing any magical kernel-level operations. Instead, it was using two standard library functions that any process can call: proc_pidinfo() and proc_pid_rusage().
| sysmond code | 0x42 | 0x16 |
| system library call | proc_pid_rusage() | proc_pidinfo() |
| data field | rusage_info_v2::ri_phys_footprint | proc_taskinfo::resident_size |
These functions are available to any process for reading information about other processes running under the same user account – no special entitlements required. I could access the same memory data that Activity Monitor displays. Even better, proc_pid_rusage() alone provides both memory metrics. The footprint command is a convenient tool that uses this same function internally to display detailed memory breakdowns for running processes. It provides an interactive way to explore memory usage without writing code.
When I found it and started searching for documentation on the proc_pid_rusage function, I realized I’d essentially “discovered” something that Apple has been publicly documenting and recommending for years. It was a classic case of reinventing the wheel, but the journey taught me far more than simply reading the documentation would have.
However, I still had the original question: what do these numbers actually represent?
Following the Trail to the Source Link to heading
To understand what these memory metrics actually represent, we need to go deeper – all the way to the kernel level. Fortunately, Apple open-sources significant portions of macOS, including the kernel’s memory management code.
Real Memory and Memory are simply values read from two kernel ledgers called physmem.phys_mem and physmem.phys_footprint.
| sysmond code | 0x42 | 0x16 |
| ledger | physmem.phys_footprint | physmem.phys_mem |
But what exactly are these “ledgers”?
The Kernel’s Accounting System Link to heading
Ledgers are the kernel’s accounting system – every time your process allocates memory, maps a file, or performs certain operations, the kernel updates various ledgers using ledger_debit() and ledger_credit() functions. You can find some information about ledgers in a manual page of footprint command (MEMORY ACCOUNTING section). The full list of ledgers is available in the sources.
This system allows the kernel to answer questions like “How much memory is this process using?” in constant time – no need to walk through complex data structures or perform expensive calculations.
I discovered that there’s actually a ledger() syscall that can read these values directly. Apple’s engineers even left a comment in the code saying it “isn’t meant for civilians to use” – which naturally made me want to use it right away 😁.
I created a simple program that reads all ledger values for a given process:
By examining the kernel’s memory management code in osfmk/arm64/sptm/pmap/pmap.c, I could finally understand what these ledgers actually track:
phys_mem gets updated every time a page is added or removed from physical RAM and the process’s page table. This is macOS’s version of Linux’s RSS (Resident Set Size) – memory that’s actually sitting in physical RAM right now. However, most of the shared system libraries (dyld cache) don’t count toward this ledger, except for dirty pages that the process has modified.
phys_footprint is far more complex. To understand it, I needed to step back and explain why phys_mem alone isn’t sufficient for understanding a process’s true memory impact.
One might think that Real Memory (macOS’s equivalent to Linux’s RSS) would be perfect for monitoring memory usage. It represents physical RAM that’s actually being used right now – what could be more straightforward? But there are two fundamental problems that make RSS-style metrics misleading:
Problem 1: Not all resident memory is truly “yours”
Some memory that appears in your process’s RSS is actually shared with other processes and therefore cannot be accounted solely to one process. Some memory is designed to be reclaimed by the system at any time; therefore, it does not contribute toward memory pressure on the system.
Problem 2: Not all your memory is resident
Some of your application’s memory might be swapped to disk, but it’s still your application’s memory – you just don’t see it in RSS.
Memory accounting becomes especially confusing when you consider several categories of “sort of yours” memory:
- Memory-mapped files: When you map a file with MAP_SHARED, that memory can be shared across multiple processes. The OS technically owns it, even though your process is the only one using it.
- Reusable memory: When you free memory, macOS might not immediately return it to the kernel. It leaves it in your process space for potential reuse, similar to Linux’s madvise(MADV_FREE).
- Purgable memory: macOS has a concept of purgable memory, which the OS can discard if it experiences memory pressure. It’s resident in Real Memory but doesn’t contribute to memory footprint because it’s easily discardable. Applications can protect this memory from discarding temporarily (nonvolatile purgable memory). In this case, the OS will include it in a memory footprint until the nonvolatile mark is removed.
- System libraries (dyld cache): This is the big one, and it deserves special attention.
The dyld Cache: macOS’s Memory Optimization Trick Link to heading
Here’s where macOS gets interesting. Unlike Linux, which provides a stable syscall interface, macOS provides stability through a collection of system libraries (libsystem_c.dylib, libsystem_malloc.dylib, etc.). Since every process needs these libraries, Apple devised an optimization called the dyld cache.
Instead of each process loading dozens of system libraries individually, the system pre-links all these libraries into a single, massive memory region (the dyld cache found in /System/Cryptexes/OS/System/Library/dyld/). This cache gets mapped into every new process in a single operation (this is rather a simplification; for more details, see Apple’s documentation).
Here’s the catch: this dyld cache is several hundred megabytes in size, and most of it is resident in physical RAM. This means that even a simple “Hello World” program appears to use over 100MB of RAM if you look at traditional RSS metrics – enough to sound alarm bells for any developer or user.
Apple’s solution was to exclude most of the dyld cache from the phys_mem ledger, counting only the dirty pages (like modified __DATA segments) that the process has actually changed. This makes perfect sense from a developer’s perspective – you don’t consider system libraries as “your” memory, so why should they count against your application’s memory usage?
Note
I found one interesting byproduct of how things are implemented in macOS: virtual addresses of all system libraries are the same across all macOS processes. This means that the dyld cache ASLR slide changes only after reboot. As far as I understand, this makes ASLR somewhat less effective, since it becomes easy to predict the address of any system function in any target process. To be fair, it can only be exploited if an attacker can already execute arbitrary code on a target machine, so this probably isn’t a huge sacrifice.
The Swapped Memory Problem Link to heading
The other fundamental issue with phys_mem is that it completely ignores swapped memory. When the system runs low on RAM, it can swap out your application’s memory to disk. By definition, this memory is no longer resident, so it disappears from RSS-style metrics.
But here’s the thing: it’s still your application’s memory. As a developer, you should be aware of your total memory footprint, not just the portion that happens to be in RAM at any given moment. Under memory pressure, your seemingly “lightweight” application might actually be consuming significant resources through swapped memory.
This is why Apple developed the phys_footprint ledger – to give developers a more complete picture of their application’s true memory impact.
There’s a formula for the phys_footprint ledger in the kernel sources:
phys_footprint = + (internal - alternate_accounting) + (internal_compressed - alternate_accounting_compressed) + iokit_mapped + purgeable_nonvolatile + purgeable_nonvolatile_compressed + page_tablephys_footprint includes all your application’s memory, regardless of whether it’s currently in RAM, compressed, or swapped. It represents your true memory footprint.
The “alternate accounting” components exist to prevent double-counting. Since IOKit memory is also considered internal memory, adding them together would overcount the total allocation. The alternate accounting ledgers track this overlap, allowing the system to provide an accurate final number.
Here is the table that describes different types of memory and in which ledger they are present.
| dyld cache read-only segments (__TEXT) | no | no |
| Heap allocated memory (malloc(), mmap(MAP_ANONYMOUS)) | yes1 | yes |
| Stack allocated memory (alloca()) | yes1 | yes |
| Files mmapped with MAP_SHARED | yes1 | no |
| Files mmapped with MAP_PRIVATE | yes1 | yes |
| dyld cache read-write segments (__DATA, __AUTH) | yes, if changed (COW) | yes, if changed (COW) |
| Reclaimed memory | yes1 | no |
| purgeable nonvolatile | yes1 | yes |
| purgeable volatile | yes1 | no |
The Final Picture Link to heading
Real Memory corresponds to the phys_mem ledger and represents physical RAM currently occupied by your process. Think of it as macOS’s version of Linux’s RSS, but with a crucial improvement: it excludes most of the shared system libraries (dyld cache), counting only the dirty pages your process has actually modified.
Memory corresponds to the phys_footprint ledger and tells the complete story of your application’s memory impact. It includes:
- All internal (anonymous) memory, whether resident, compressed, or swapped
- IOKit-allocated memory on behalf of your process
- Non-volatile purgeable memory
- Page tables (usually negligible)
The key insight: Memory represents your application’s total memory footprint regardless of where that memory currently lives, while Real Memory only shows what’s physically in RAM right now. Both metrics exclude shared system components.
For developers: Focus on the Memory metric when optimizing. It provides the complete picture of your application’s memory consumption and won’t fluctuate based on system memory pressure.
Both metrics are accessible programmatically using proc_pid_rusage() with the ri_phys_footprint and ri_resident_size fields – no special entitlements required.
I’d like to express my deepest gratitude to Luna Razzaghipour and matklad for taking the time to review this article. Their feedback was invaluable!