.png)

Main
A single subanaesthetic dose of ketamine induces rapid, robust and enduring antidepressant effects that often manifest within hours and persist for days1,2. This efficacy has galvanized efforts to uncover the molecular and cellular mechanisms that underlie its therapeutic action, with the goal of developing safer and more effective treatments4,5,6,7,8,9,10,11. Originally identified as an NMDA receptor (NMDAR) antagonist12, ketamine is now understood to influence a network of neuromodulators.Ketamine alters neuronal activity and promotes synaptic plasticity in brain regions implicated in major depressive disorder (MDD), such as the medial prefrontal cortex (mPFC) and the hippocampus9,13,14. Electroconvulsive therapy (ECT), another rapid-acting antidepressant intervention, has also been shown to engage multiple neuromodulators in the brain. The underlying mechanisms of ECT also remain incompletely understood3,15.
To identify the neuromodulator that underlies these therapies, the following key criteria should be met: both ketamine and ECT should change neuromodulator levels in the brain, and activation or inhibition of the associated signalling pathways should either replicate or abolish antidepressant effects. Moreover, insights into these mechanisms should guide the development of new therapeutic strategies. Although numerous candidates have been proposed as the key neuromodulator9,13,14, many do not fully satisfy these stringent criteria, which underscores the need for continued exploration to identify a central player.
Emerging evidence suggests that adenosine, a purine nucleoside with high-affinity A1 (encoded by Adora1) and A2A (encoded by Adora2a) receptors16,17, is a promising but underexplored candidate. Adenosine regulates neuronal excitability, synaptic plasticity and inflammatory responses16, all of which are implicated in MDD18. Dysregulated adenosine metabolism has been linked to depressive symptoms19, and interventions that enhance adenosine signalling, such as sleep deprivation20,21 and ketogenic diets22, have shown antidepressant-like effects in humans and animal models. Despite the therapeutic potential of ketamine and ECT, studying the role of adenosine in these treatments has been technically challenging owing to the transient and dynamic nature of its signalling and its brain-region-specific and receptor-specific actions16,23,24. Notably, although adenosine generally exhibits neuroprotective and antidepressant properties, chronic A2A receptor activation in certain brain regions may counteract these benefits19,25, which highlights the complexity of its spatiotemporal regulation.
Here we use genetically encoded adenosine sensors to reveal rapid adenosine surges in mood-regulatory circuits after ketamine administration or ECT. Notably, systemic or specific depletion or blockade of A1 and A2A receptors in the mPFC abolishes the antidepressant efficacy of these therapies. Moreover, the activation of these two receptors recapitulates therapeutic effects, thereby demonstrating the pivotal role of adenosine. Building on these insights, we identify ketamine derivatives that potentiate adenosine signalling to produce enhanced antidepressant efficacy and reduced side effects. We further demonstrate that acute intermittent hypoxia (aIH), a noninvasive method that involves controlled oxygen reduction, is a potent adenosine-dependent antidepressant strategy. These findings establish adenosine signalling as the central mechanism that unifies the actions of ketamine and ECT and open new therapeutic avenues for MDD.
Ketamine triggers brain adenosine surges
We first investigated the effects of ketamine on extracellular adenosine dynamics. To that end, we used the GPCR-based adenosine probe GRABAdo1.0 with multichannel fibre photometry to enable real-time monitoring of adenosine levels in the mouse brain (Extended Data Fig. 1a). We first validated the fidelity of this sensor in vivo. Acute hypoxia, a potent physiological stimulus for adenosine release26, induced a rapid increase in the GRABAdo1.0 signal. By contrast, a functionally inactive mutant sensor (GRABAdo1.0-mut) did not produce any effects. This result confirms the specificity of GRABAdo1.0 for detecting changes in extracellular adenosine levels (Extended Data Fig. 1b).
Systemic administration of a subanaesthetic, antidepressant dose of ketamine (10 mg kg–1, intraperitoneal (i.p.) injection) caused a rapid and sustained increase in extracellular adenosine in the mPFC—an area comprising the prelimbic (PrL), infralimbic (IL) and anterior cingulate (ACC) cortices—and in the hippocampus (HPC), but not in the nucleus accumbens (NAc) (Fig. 1a,b and Extended Data Fig. 1c). The adenosine surge featured peak amplitudes of about 15% change in fluorescence (ΔF/F), onset times of 100–150 s after injection, peak times of about 500 s and decay time constants of 500–600 s after the peak (Extended Data Fig. 1d–h). Two-photon imaging confirmed that this release was spatially diffuse (Extended Data Fig. 1i–k). Notably, ketamine induced a similar increase in adenosine levels in mice subjected to chronic restraint stress (CRS) (a mouse model of depression). These results demonstrate that this neurochemical response is reliable across physiological and pathological states (Fig. 1c,d and Extended Data Fig. 1l).
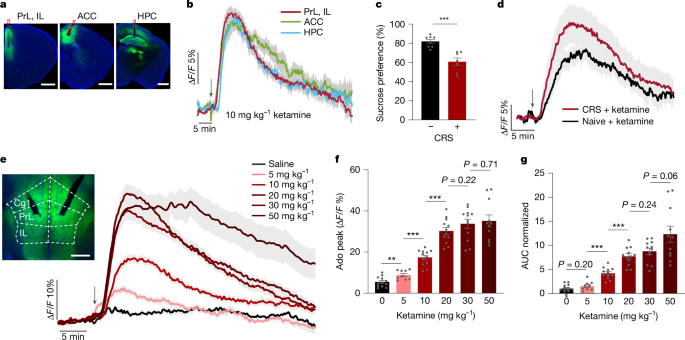
a, Representative images of GRABAdo1.0 expression (green) in the ACC, the HPC and the PrL and IL of the mPFC. Red dashed lines indicate tracks of the optical fibre. Scale bars, 1 mm. b, Time course of extracellular adenosine levels in the mPFC (red; n = 12 mice), ACC (green; n = 8 mice) and HPC (blue; n = 8 mice) after ketamine administration (10 mg kg–1, i.p. injection; arrow). c,d, Sucrose preference in mice subjected to CRS versus naive mice (c) and the corresponding time course of extracellular adenosine levels in the mPFC after ketamine administration (10 mg kg−1, i.p. injection) (d). e–g, Dose–response effects of ketamine on extracellular adenosine levels in the mPFC. e, Time course after ketamine injections (5, 10, 20, 30 or 50 mg kg−1, i.p. injection) and saline control. Image shows the recording site. Cg1, cingulate cortex 1, which is part of the ACC. Scale bar, 500 µm. f,g, Adenosine (Ado) peak levels (f) and area under the curve (AUC; normalized to saline) (g) after drug administration. Data are the mean ± s.e.m. (shading in b, d and e; error bars in c, f and g). Statistics: two-tailed unpaired t-tests (c,f,g). **P < 0.01, ***P < 0.001. See Supplementary Table 1 for detailed statistics.
The ketamine-induced adenosine increase in the mPFC was dose-dependent. A low dose (5 mg kg–1) produced a modest signal, whereas the response amplitude and duration increased substantially at 10 and 20 mg kg–1. Higher doses (30 and 50 mg kg–1) did not further augment the peak amplitude but prolonged the signal decay time (Fig. 1e–g and Extended Data Fig. 1m,n). This effect reflected endogenous adenosine release, as ketamine did not directly activate the GRABAdo1.0 sensor (Extended Data Fig. 1o,p). The kinetics of the ketamine response were distinct from those of acute hypoxia, inducing a signal with a smaller peak amplitude (around 35% for high ketamine doses compared with about 60% ΔF/F for hypoxia) but a markedly slower decay (>500 s compared with about 50 s) (Fig. 1e and Extended Data Fig. 1b). These results demonstrate that the modulation of adenosine by ketamine operates within the dynamic range of the sensor and aligns with its therapeutically relevant subanaesthetic doses.
We next investigated whether the adenosine surge is triggered by ketamine itself or by its metabolites (Extended Data Fig. 2a). Systemic administration of two primary metabolites, norketamine (NK) and (2R,6R)-HNK10, at an equivalent dose (10 mg kg–1, i.p. injection) did not trigger a detectable adenosine response in the mPFC (Extended Data Fig. 2b,c). To corroborate this finding, we pharmacologically inhibited key enzymes responsible for ketamine metabolism in vivo27. Pretreatment with the CYP3A4 inhibitors ketoconazole or ritonavir significantly potentiated the amplitude and duration of the ketamine-induced adenosine signal (Extended Data Fig. 2d–g). By contrast, inhibition of CYP2B6 with ticlopidine had no effect (Extended Data Fig. 2h,i). Because the inhibitors alone did not alter baseline adenosine levels (Extended Data Fig. 2j–l), these results suggest that the parent ketamine molecule is directly responsible for triggering adenosine release, the magnitude of which is regulated by CYP3A4-mediated metabolism.
Adenosine drives the action of ketamine
To determine whether adenosine signalling is required for the antidepressant action of ketamine, we first confirmed its efficacy in wild-type (WT) mice subjected to CRS and then to forced swim tests (FSTs) or sucrose preference test (SPTs), which are behavioural assays for despair and anhedonia, respectively (Fig. 2a). Given the established roles of adenosine A1 and A2A receptors in central adenosine signalling24,28,29, we evaluated ketamine in Adora1–/– and Adora2a–/– mice (Supplementary Fig. 1). The antidepressant effects of ketamine, assessed at both 1 h (acute) and 24 h (sustained) after administration, were abolished in both knockout mouse lines (Fig. 2b–e).
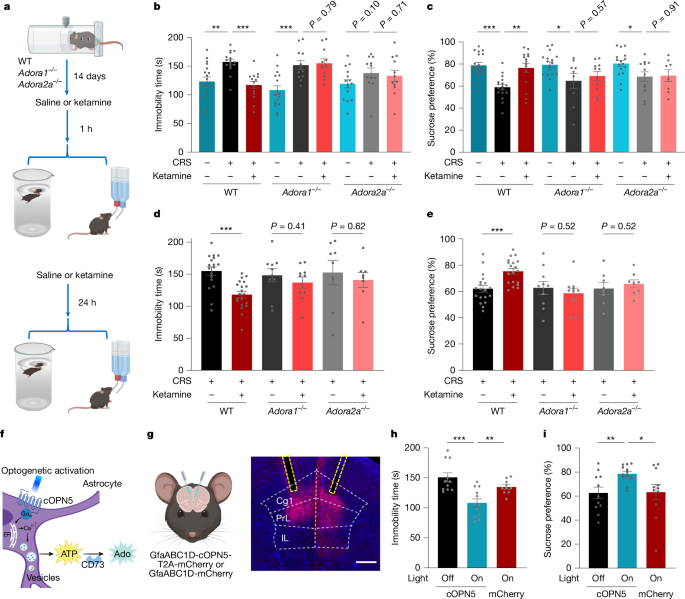
a, Experimental timeline for assessing the antidepressant action of ketamine at 1 and 24 h in WT, Adora1–/– and Adora2a–/– mice subjected to CRS. b–e, FSTs (b,d) and SPTs (c,e) were performed after CRS in WT, Adora1–/– and Adora2a–/– mice 1 h (b,c) or 24 h (d,e) after ketamine administration (10 mg kg−1, i.p. injection). f–i, Optogenetic release of adenosine in the mPFC produces rapid antidepressant-like effects. f, Schematic of optogenetic astrocyte activation that leads to adenosine production via ectonucleotidase activity (for example, CD73). ER, endoplasmic reticulum. g, Schematic and representative image of optogenetic activation. Scale bar, 500 µm. h,i, Immobility times in FSTs (h) and sucrose preference in SPTs (i) were measured 1 h after optogenetic activation in mice expressing the light-sensitive opsin cOpn5 or a mCherry control in the mPFC and subjected to CRS. Data are the mean ± s.e.m. (error bars in b–e,h,i). Statistics: two-tailed unpaired t-tests (b–e,h,i). *P < 0.05, **P < 0.01, ***P < 0.001. See Supplementary Table 1 for detailed statistics. The schematics in a, f and g were created using BioRender (https://www.biorender.com).
The loss of therapeutic action in the knockout mice was not attributable to motor confounds and occurred despite the preservation of ketamine-induced hyperlocomotion, which was comparable between WT and mutant mice (Extended Data Fig. 3a–c). These results therefore dissociate the antidepressant properties of the drug from its psychostimulant side effects. We also confirmed that the behavioural deficits in knockout mice resulted from receptor absence rather than a developmental impairment in adenosine release. That is, the ketamine-induced adenosine surge remained intact in both Adora1–/– and Adora2a–/– mice (Extended Data Fig. 3d).
Complementing these genetic data, acute pharmacological blockade in WT mice subjected to CRS revealed a pivotal role for both receptors (Extended Data Fig. 3e–i). Pretreatment with a selective A1 receptor antagonist completely abolished the antidepressant-like effects of ketamine in FSTs, whereas A2A receptor blockade produced a reduced attenuation 1 h after ketamine administration (Extended Data Fig. 3f,h). This result confirms the necessity of adenosine receptor activity for reducing behavioural despair30,31. A similar dependency was observed for anhedonia, whereby A1 and, to a lesser extent, A2A receptor antagonism prevented ketamine from reversing deficits in sucrose preference (Extended Data Fig. 3g,i). This requirement for adenosine receptor signalling was not specific to the CRS model, as inhibition of both receptors also blunted the efficacy of ketamine in a mouse model of depression induced by lipopolysaccharide (LPS)32 (Extended Data Fig. 3j).
Collectively, these converging data—derived from complementary genetic and pharmacological approaches in both stress-induced and inflammation-induced depression models—establish that the efficacy of ketamine in reversing core depressive-like behaviours, including anhedonia and behavioural despair, depends on adenosine signalling.
mPFC adenosine signalling is crucial
We asked whether adenosine signalling is sufficient to induce antidepressant effects. Intracerebroventricular injection of adenosine or systemic delivery of selective agonists of the A1 receptor (N6-cyclohexyladenosine (CHA)) and the A2A receptor (CGS21680) replicated the immediate therapeutic effects of ketamine in mice subjected to CRS (Extended Data Fig. 4a–c). Notably, 24 h after administration, only CHA—but not CGS21680—retained efficacy in behavioural assays (Extended Data Fig. 4d,e). This lasting therapeutic action occurred despite the agonist being cleared from the brain by 24 h (Extended Data Fig. 4f), which indicated that transient A1 receptor activation triggers a durable antidepressant state, whereas A2A receptor signalling contributes primarily to acute effects.
To test whether localized adenosine signalling is sufficient to produce an antidepressant effect, we focused on the mPFC, a key region implicated in both mood regulation and the therapeutic action of ketamine. Direct stereotaxic infusion of adenosine into the mPFC produced a robust antidepressant response (Extended Data Fig. 5a–c). To corroborate this finding with a more physiologically relevant approach, we used optogenetics to stimulate astrocytes expressing cOpn5, which triggers localized, adenosine release that is mediated by CD73 (encoded by Nt5e)33 (Fig. 2f). This light-induced adenosine production, specifically in the mPFC, was also sufficient to alleviate depressive-like behaviours in WT mice, an effect that was absent in Nt5e–/– knockout mice (Fig. 2g–i and Extended Data Fig. 5d). The behavioural rescue was associated with changes in a key molecular pathway, as ketamine-induced upregulation of brain-derived neurotrophic factor (BDNF)—a canonical downstream effector34,35—was prevented in Adora1–/– and Adora2a–/– mice, in which these receptors are globally knocked out (Extended Data Fig. 5e and Supplementary Fig. 2a). In support of the circuit-specificity of this mechanism, neither local adenosine infusion nor optogenetic stimulation in the dorsal hippocampus produced any antidepressant actions (Extended Data Fig. 5f–j).
Having established that adenosine signalling in the mPFC is sufficient, we next investigated whether this circuit is also necessary for the therapeutic effects of systemic ketamine. To that end, we used the adeno-associated virus (AAV)-mediated CRISPR–Cas9 approach and delivered single-guide RNAs (sgRNAs) into the mPFC of adult mice to genetically deplete A1 and A2A receptor expression (Extended Data Fig. 5k and Supplementary Fig. 1). This circuit-restricted knockout also abolished the antidepressant behavioural effects of systemic ketamine in both the FSTs and SPTs (Extended Data Fig. 5l,m). Together, these results establish that adenosine signalling in the mPFC is a critical node that mediates rapid antidepressant efficacy.
Metabolic basis for adenosine efflux
To investigate how ketamine increases extracellular adenosine concentrations in the brain, we first considered whether adenosine is generated through the hydrolysis of extracellular adenine nucleotides by CD73 (ref. 36) (Extended Data Fig. 6a). Using GRABATP1.0, a sensor capable of detecting both ATP and ADP, we monitored purine dynamics in the mPFC. Ketamine administration did not increase extracellular ATP or ADP levels; instead, it caused a modest reduction (Extended Data Fig. 6b–d). Furthermore, genetic depletion of CD73 did not have an effect on ketamine-induced adenosine signals (Extended Data Fig. 6e–g and Supplementary Fig. 2b). These findings exclude extracellular nucleotide hydrolysis as the primary source of ketamine-induced increases in extracellular adenosine levels.
An alternative source of extracellular adenosine originates from the activity of the equilibrative nucleoside transporters ENT1 and ENT2 (ENT1/2), which regulate the balance between intracellular and extracellular adenosine levels23,36 (Fig. 3a). We proposed that blocking the activity of ENT1/2 would increase ketamine-induced adenosine signals if adenosine was produced outside cells, whereas the opposite would occur if adenosine was produced inside cells and then released through ENT1/2 activity. To test this hypothesis, we first inhibited ENT1/2 using intracranial administration of dipyridamole, an ENT1/2 inhibitor. This treatment significantly attenuated ketamine-induced adenosine signals (Fig. 3b,c), whereas dipyridamole alone did not cause rapid increases in extracellular adenosine levels (Extended Data Fig. 6h,i). These results suggest that ketamine disrupts the intracellular–extracellular adenosine equilibrium, probably by increasing intracellular adenosine and subsequently transporter-mediated efflux.
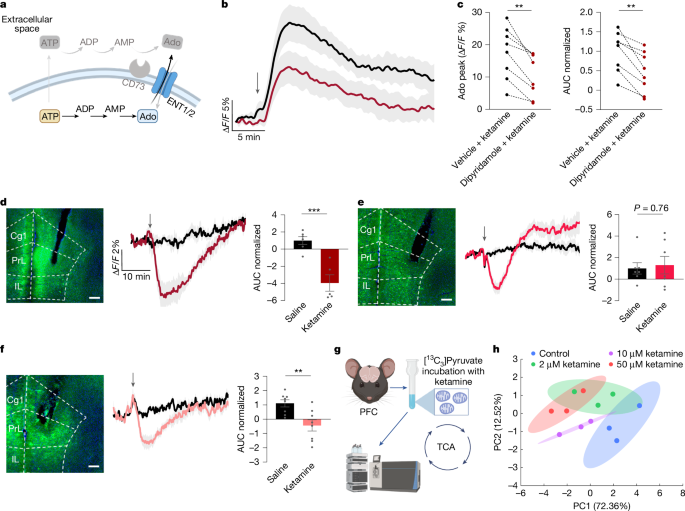
a, Schematic of intracellular adenosine generation and its efflux through ENT1/2. b,c, Inhibition of ENT1/2 blocks ketamine-induced adenosine release. b, Time course of extracellular adenosine in the mPFC after ketamine administration with or without pretreatment with the ENT1/2 inhibitor dipyridamole (1 µg, intracerebroventricular injection). c, Quantification of peak adenosine and AUC (normalized to vehicle). d, Ketamine decreases the intracellular ATP/ADP ratio in mPFC excitatory neurons. Left, representative image of PercevalHR expression in CaMKII+ neurons. Scale bar, 200 µm. Middle, time course of the ATP/ADP ratio after ketamine (10 mg kg−1, i.p. injection) or saline treatment. Right, corresponding AUC (normalized to saline). e,f, Intracellular ATP/ADP ratios in mPFC GABAergic neurons (e) and astrocytes (f). Panels show representative images, time courses and saline-normalized AUCs as in d. g, Experimental workflow for mitochondrial isolation and subsequent metabolic flux analyses in the mouse prefrontal cortex. h, PCA of the metabolomic profiles, illustrating separation of the treatment groups along the first two principal components. Ellipses represent 95% confidence intervals calculated using the multivariate t-distribution. Data are the mean ± s.e.m. (shading in b, d–f; error bars in c–f). Statistics: two-tailed paired t-test (c) or two-tailed unpaired t-tests (d–f). **P < 0.01, ***P < 0.001. See Supplementary Table 1 for detailed statistics. The schematics in a and g were created using BioRender (https://www.biorender.com).
Intracellular adenosine accumulation is closely associated with shifts in cellular metabolic activity, particularly reductions in the ATP/ADP ratio23,37,38. To assess whether ketamine modulates ATP/ADP dynamics in neurons and glia, we used PercevalHR—a genetically encoded sensor of the intracellular ATP/ADP ratio—in the mPFC37. This method enabled us to track metabolic changes in excitatory neurons, inhibitory neurons and astrocytes (Fig. 3d–f). Ketamine administration rapidly decreased the ATP/ADP ratio across all cell types, with the largest reduction in excitatory CaMKII-expressing pyramidal neurons (Fig. 3d). GABAergic neurons showed an initial reduction followed by a rebound, whereas astrocytes exhibited a sustained decrease (Fig. 3e,f). Analysis of GRABAdo1.0 and PercevalHR temporal response profiles revealed that reduction in the intracellular ATP/ADP ratio preceded the extracellular adenosine surge (Extended Data Fig. 6p,q). This temporal sequence strongly supports the hypothesis that ketamine-induced metabolic alterations drive adenosine efflux, which then lead to the observed increase in extracellular adenosine levels.
Adenosine build-up in cells typically arises from increased cellular metabolic activity23,37,38, which is often triggered by excessive excitability in neurons, as seen during epileptic states. To determine whether ketamine induces neuronal hyperactivity, we monitored intracellular Ca2+ dynamics using the Ca2+ indicator GCaMP8s expressed in mPFC neurons. In pyramidal neurons, ketamine significantly reduced Ca2+ signalling at a high dose (20 mg kg–1) but not at the standard antidepressant dose (10 mg kg–1) (Extended Data Fig. 6j–l). Moreover, GABAergic neurons exhibited a decrease in Ca2+ activity at the dose of 10 mg kg−1 (Extended Data Fig. 6m–o). Thus, ketamine induces adenosine signals by altering cellular metabolism and promoting transporter-mediated efflux while avoiding neuronal hyperactivity.
To determine whether ketamine directly targets mitochondria to modulate cellular metabolism, we performed metabolic flux analyses on purified brain mitochondria. By incubating isolated mitochondria from the mPFC with [13C3]pyruvate, we traced the entry and metabolism of this key substrate through the TCA cycle in the presence of ketamine (Fig. 3g and Extended Data Fig. 7a). At therapeutically relevant concentrations (≥2 µM)39,40, ketamine exposure caused an accumulation of [13C]pyruvate while dose-dependently suppressing the 13C enrichment of downstream TCA cycle intermediates, including fumarate, malate and aspartate (Extended Data Fig. 7b,c). The metabolic changes were reflected in a global dose-dependent shift in the mitochondrial metabolome, as shown by principal component analysis (PCA) (Fig. 3h). This inhibitory effect on pyruvate utilization was consistent with a decrease in the ATP/ADP ratio. This result provides a mechanistic link between the action of ketamine at the mitochondrion and the observed surge in extracellular adenosine. Crucially, as these metabolic alterations occur in an isolated organelle system that lacks NMDARs, our findings indicate that subanaesthetic ketamine may directly engage and reprogram mitochondrial function.
Ketamine-derived antidepressants
To identify new compounds with enhanced therapeutic profiles, we used a phenotypic drug discovery approach using adenosine dynamics in the mPFC as a functional biomarker. We synthesized and screened 31 ketamine-derived compounds by systematically modifying the chloro substituent (-Cl) on the aromatic ring, the methylamino group attached to the cyclohexanone ring and the sixth position of the cyclohexanone ring—a key site for hydroxylation during metabolism (Fig. 4a, Extended Data Fig. 8a and Supplementary Methods). By leveraging fibre photometry, we assessed the capacity of these compounds to enhance extracellular adenosine levels in the mPFC. Although most compounds produced weak or no adenosine responses, dechlorinated derivatives, particularly deschloroketamine (DCK) and deschloro-N-ethyl-ketamine (2C-DCK), induced significantly stronger and longer-lasting adenosine surges than ketamine at the same doses of 5 and 10 mg kg−1 (Fig. 4b–d and Extended Data Fig. 8b), indicating their potential as improved therapeutic agents. Further dose mapping revealed that even at a low dose of 2 mg kg−1, DCK significantly increased extracellular adenosine levels (Fig. 4e–g). This result highlights the strong adenosine-modulating properties of DCK and its potential efficacy at lower doses.

a, Left, schematic of the ketamine analogue synthesis strategy. Right, scatter plot of peak adenosine amplitude compared with the AUC from an in vivo screen of synthesized compounds (10 mg kg−1, i.p. injection), normalized to ketamine responses. b, Time course of extracellular adenosine levels in the mPFC after administration of DCK (n = 7 mice), 2C-DCK (n = 8 mice), 3′-Cl-ketamine (n = 6 mice) or ketamine (n = 13 mice; 10 mg kg–1, i.p. injection; arrow). c,d, Comparison of peak adenosine levels (c) and AUC (d; normalized to saline) for DCK versus ketamine at an equivalent dose. e–g, Dose–response of DCK on adenosine release in the mPFC. e, Time course following injections of DCK (2, 5 and 10 mg kg−1, i.p. injection) or saline. f, Peak adenosine levels. g, AUC, normalized to saline. h,i, Rapid antidepressant-like effects of lead analogues. Immobility time in FSTs (h) and sucrose preference in SPTs (i) were measured in mice subjected to CRS 1 h after i.p. administration of ketamine, DCK, 2C-DCK or 3′-Cl-ketamine (3′-Cl-K). Data are the mean ± s.e.m. (shading in b and e; error bars in c, d and f–i). Box plots (c,d) show the median (centre line), first and third quartiles (box bounds), and 1.5× the interquartile range (whiskers). Statistics: two-tailed unpaired t-tests (c,d,f–i). *P < 0.05, **P < 0.01, ***P < 0.001. In h, significance is relative to the saline control. See Supplementary Table 1 for detailed statistics.
We investigated whether the strong adenosine signals induced by DCK and 2C-DCK translate to antidepressant efficacy. In FSTs of mice subjected to CRS, ketamine at 10 mg kg−1 significantly decreased immobility time, whereas 5 mg kg−1 showed marginal effects, and lower doses were ineffective. By contrast, DCK displayed substantial efficacy at substantially lower doses: 2 mg kg−1 significantly alleviated depressive behaviours, and 5 mg kg−1 produced even greater improvements (Fig. 4h). Similarly, in SPTs, 2 mg kg−1 DCK demonstrated antidepressant effects equivalent to 10 mg kg−1 ketamine (Fig. 4i). These results highlight the enhanced potency of DCK compared with ketamine. In parallel, 2C-DCK, which induced similarly strong adenosine responses in the mPFC, exhibited significant antidepressant effects at 5 mg kg−1, whereas 3′-Cl-ketamine, which produced negligible adenosine responses, did not lead to improvements in depressive phenotypes at 10 mg kg−1 (Fig. 4h). These findings confirm that adenosine dynamics serve as a predictive biomarker for identifying ketamine-derived compounds with antidepressant efficacy.
We also used hyperlocomotion to evaluate the dissociative side effects of DCK. At a dose of 2 mg kg−1, which effectively alleviated depressive-like behaviours, DCK induced only mild locomotor effects, which was in contrast to the significant hyperlocomotion observed with 10 mg kg−1 ketamine (Extended Data Fig. 8c,d). Higher doses of DCK caused more conspicuous motor activity, but the ability to achieve antidepressant effects at lower doses with minimal side effects underscores its favourable therapeutic window.
To determine whether NMDAR antagonism is the primary driver of adenosine release, we systematically compared the in vivo adenosine-releasing capacity of ketamine and six derivatives with their respective NMDAR inhibitory potencies (IC50) and pharmacokinetics in the brain (Extended Data Fig. 9a–h). Our findings revealed a dissociation between these two properties. Notably, after integrating ex vivo potency with in vivo pharmacokinetics to estimate the effective NMDAR target engagement for each compound, we did not find a correlation between the degree of NMDAR blockade and the amplitude of the adenosine surge (Extended Data Fig. 9i). This was exemplified by compounds such as 3′-Cl-ketamine, which blocked NMDARs but did not trigger adenosine release, and 3C-DCK, which produced a much stronger release despite having comparable NMDAR affinity (Extended Data Fig. 9a,d,f). This dissociation between NMDAR antagonism and adenosine release, combined with our evidence that ketamine directly modulates mitochondrial metabolism (Extended Data Fig. 7), suggests that a non-NMDAR mechanism mediates the adenosine surge.
Adenosine mediates ECT and aIH action
Although ketamine represents a pharmacological intervention for rapid antidepressant effects, ECT offers a non-pharmacological approach with similarly rapid efficacy3,41. ECT induces epileptic and convulsive behaviours, characterized by neuronal hyperactivity, often linked to extracellular adenosine release as a protective mechanism against overexcitation. However, real-time adenosine dynamics during ECT remain unexplored. We monitored extracellular adenosine in the mPFC of anaesthetized mice undergoing ECT-induced seizures. ECT induced an increase in extracellular adenosine levels in the mPFC, comparable in magnitude to those produced with a 10 mg kg−1 intraperitoneal injection of ketamine, but with a faster onset and decay (Fig. 5a,b). An ECT regimen significantly alleviated depressive-like behaviours in mice subjected to CRS, as assessed by FSTs and SPTs, effects that were abolished in Adora1–/– and Adora2a–/– mice (Fig. 5c–e). These results highlight the essential role of adenosine signalling in ECT.
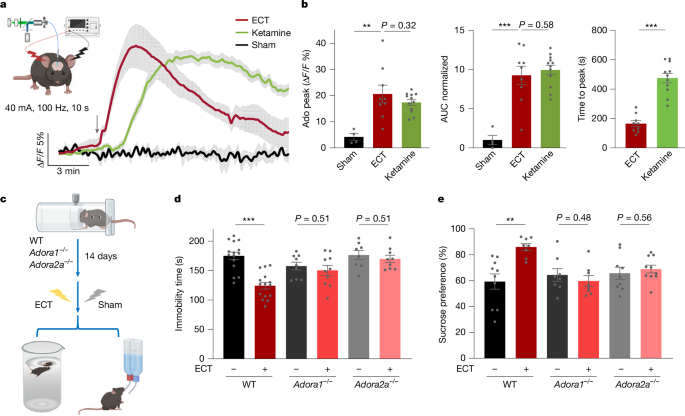
a, Adenosine dynamics following ECT. Left, experimental setup for ECT in mice, showing ear-clamp electrodes for stimulation with concurrent GRABAdo1.0 monitoring. Right, extracellular adenosine time course in the mPFC after a single ECT cycle, ketamine injection (10 mg kg−1, i.p. injection; replotted from Fig. 1e for comparison purpose) or sham ECT. Arrow indicates ECT or drug administration. b, Quantification of adenosine peak levels, AUC (normalized to sham ECT) and time to peak. c–e, Experimental paradigm for assessing ECT antidepressant efficacy (c), FST immobility time (d) and sucrose preference (e) of WT, Adora1–/– and Adora2a–/– mice subjected to CRS. Data are the mean ± s.e.m. (shading in a; error bars in b, d and e). Statistics: two-tailed unpaired t-tests (b,d,e). **P < 0.01, ***P < 0.001. See Supplementary Table 1 for detailed statistics. The schematics in a and c were created using BioRender (https://www.biorender.com).
The connection between adenosine signalling and the antidepressant effects of ketamine and ECT points to the potential of non-pharmacological strategies such as aIH, which has demonstrated neuroprotective and anxiolytic benefits in both preclinical and clinical settings42,43. To replicate the adenosine surges observed with ketamine and ECT, we developed a controlled aIH protocol consisting of five 5-min exposures to 9% hypoxia, interspersed with 5-min normoxic intervals (21% O2), administered once daily for three consecutive days. Fibre photometry revealed that aIH generated a rapid and significant increase in extracellular adenosine levels in the mPFC (Extended Data Fig. 10a,b). Behavioural assays demonstrated that this 3-day aIH regimen alleviated depression-like behaviours in mice subjected to CRS. These mice exhibited reduced immobility in FSTs and increased sucrose preference in SPTs, effects that were not seen in mice in which A1 or A2A receptors were genetically disrupted (Extended Data Fig. 10c–e). Notably, aIH treatment did not impair motor function or exercise capacity, which provides support for the safety of this strategy (Extended Data Fig. 10f). These findings indicate that aIH is a promising non-pharmacological therapy for depression, leveraging adenosine signalling to deliver rapid antidepressant effects with minimal side effects.
Discussion
Our study establishes adenosine signalling as a convergent mechanism for rapid-acting antidepressants that meets three key criteria: elevation in mood-regulatory circuits by ketamine and ECT; the necessity of A1 and A2A receptor activity for efficacy; and direct translatability to therapeutic design. Real-time monitoring revealed that these interventions induced adenosine surges in the brain (Figs. 1 and 5). Notably, this pathway is not merely correlational; receptor blockade abolished antidepressant effects, whereas receptor activation led to comparable responses (Figs. 2 and 5). Capitalizing on this mechanism, we engineered adenosine-enhancing ketamine derivatives that retained efficacy while attenuating psychotomimetic side effects (Fig. 4). We also demonstrated that aIH—a noninvasive strategy42—recapitulates antidepressant actions through adenosine signalling (Extended Data Fig. 10). This unified adenosine-centric framework positions adenosine signalling as a tractable target for mechanism-driven antidepressant development.
Ketamine, ECT and aIH produce their antidepressant effects through adenosine signalling, which selectively engages high-affinity, nanomolar-range A1 and A2A receptors over the low-affinity, micromolar-range A2B and A3 subtypes24,28,29. Optical recordings using the GRABado1.0 sensor (EC50 of around 60 nM) revealed that the adenosine signals induced by ketamine and ECT were less than half the amplitude of those induced by transient hypoxia, which suggests that the unsaturated sensor responses correspond to local adenosine concentrations in the range of 100 nM. This level is sufficient to engage A1 and A2A receptors but remains substantially below the activation threshold for A2B and A3 receptors24,28,29. The causal necessity of this pathway was demonstrated by our findings that genetic or pharmacological disruption of either A1 or A2A receptor signalling abolished their therapeutic efficacy (Figs. 2 and 5 and Extended Data Figs. 3 and 10). A1 receptor activation, which was sufficient to produce sustained antidepressant-like effects on its own, is thought to suppress neuronal hyperactivity via Gi-coupled signalling24,28,29. In parallel, Gs-coupled A2A signalling promotes synaptic plasticity, in part by upregulating BDNF44,45. This dual-receptor signalling may provide a complementary upstream mechanism for previously implicated pathways, linking the action of ketamine to both mTOR activation and the induction of HOMER1A5,20.
Our model also helps to reconcile the seemingly paradoxical role of the A2A receptor, the chronic activity of which in the hippocampus and lateral septum is often linked to pro-depressive states19,25. Our findings indicate that the chronic, pathophysiological function of the A2A receptor differs from its acute, instrumental role as a necessary component of the specific signalling cascade initiated by ketamine and ECT. Furthermore, this adenosine pathway is engaged by ketamine but not its metabolites (Extended Data Fig. 2), pointing towards a distinct, adenosine-independent mechanism for the potential effects of the latter. Thus, although the baseline activity of A1 and A2A receptors is context-dependent, their acute, coordinated activation is essential to initiate and sustain the neuroplastic changes that underlie recovery.
Circuit-level analyses identified the mPFC as the critical hub for these effects. Ketamine induced adenosine release selectively in the mPFC and hippocampus, but not the NAc (Fig. 1a,b and Extended Data Fig. 1c). Notably, adenosine signalling in the mPFC was both necessary and sufficient for antidepressant efficacy (Fig. 2f–i and Extended Data Fig. 5). Local adenosine infusion or optogenetic astrocyte activation in this region alleviated depression-like behaviours through CD73-dependent ATP-to-adenosine conversion, whereas mPFC-specific knockout of A1 or A2A receptors abolished the effects of ketamine. Although many studies suggest that the hippocampus contributes to the antidepressant action of ketamine4,10,14,46,47, local adenosine signalling in the dorsal subregion was insufficient to drive this effect on its own (Extended Data Fig. 5f–j). This may reflect the known functional heterogeneity along the dorsoventral axis of the hippocampus, a complexity that warrants further investigation. Nevertheless, our findings establish the mPFC as a pivotal hub for this adenosine-mediated antidepressant efficacy.
Our findings further reveal that ketamine triggers this cascade by acting as a metabolic neuromodulator. Rather than causing neurotoxic ATP release from stressed cells, ketamine decreases the intracellular ATP/ADP ratio and directly attenuates mitochondrial TCA cycle activity (Fig. 3 and Extended Data Figs. 6 and 7). Owing to the large concentration gradient between millimolar intracellular ATP and nanomolar adenosine23,36,37, a controlled brake on cellular metabolism can be amplified into potent adenosine signals. This mechanism informed our phenotypic drug discovery strategy, in which we engineered derivatives with enhanced adenosine release, greater efficacy and reduced side effects (Fig. 4). The clear dissociation between adenosine release and NMDAR inhibition provides an actionable blueprint for decoupling therapeutic benefits from psychomimetic actions, as demonstrated by the separation of antidepressant effects from hyperlocomotion (Extended Data Figs. 3b,c and 9).
The discovery that aIH also mediates its antidepressant effects through adenosine signalling (Extended Data Fig. 10) provides a promising non-pharmacological avenue. Unlike ECT, which induces seizures and carries risks of cognitive impairment3,15, or repetitive transcranial magnetic stimulation, which has limited efficacy in treatment-resistant cases48,49, aIH is a noninvasive strategy with an established safety profile in humans42. Its ability to elevate brain adenosine presents an opportunity to repurpose this protocol for treatment-resistant depression.
In summary, adenosine signalling emerges as a conserved mediator of rapid antidepressant efficacy across pharmacological, electrical and physiological interventions. Our findings highlight key clinical considerations, such as the potential for dietary caffeine to interfere with these treatments49,50, and provide a unified framework to accelerate the development of safer, mechanism-targeted antidepressants with broad clinical applicability.
Methods
Mice
All animal procedures were performed in accordance with protocols approved by the Institutional Animal Care and Use Committee of the Chinese Institute for Brain Research, Beijing (CIBR), and complied with the national guidelines for the housing and care of laboratory animals set by the Ministry of Health, China. Mice were housed in a specific pathogen-free facility on a 12-h light–dark cycle with ad libitum access to food and water. All experiments were conducted on male and female mice aged 8–16 weeks.
The study used WT C57BL/6J mice, Adora1−/− mice (NM-KO-225140, Shanghai Model Organisms Center), Adora2a−/− mice (NM-KO-200018, Shanghai Model Organisms Center), Nt5e−/− mice (provided by J. Chen, Wenzhou Medical University) and Rosa26-Cas9-GFP mice (Gt(ROSA)26Sortm1.1(CAG-cas9*, -EGFP) Fezh/J; The Jackson Laboratory, 024858). All mouse strains were subjected to CRS to induce depression, and WT, Nt5e–/–, Adora1−/− and Adora2a−/− mice were used for fibre photometry experiments.
Chemical reagents
Ketamine analogues were synthesized and provided by the Changchun Institute of Applied Chemistry, CAS, China (see below). Additional key chemicals were purchased from commercial sources, including norketamine hydrochloride (Tocris, 1970), (2R,6R)-HNK (Tocris, 6094), ticlopidine (Selleck, S0721), ketoconazole (Selleck, S1353), ritonavir (Selleck, S1185), dipyridamole (Selleck, S1895), LPS from Escherichia coli O127:B8 (LPS; Sigma, L3129), PSB36 (MCE, HY-103175), ZM241385 (Selleck, S8105), CHA (MCE, HY-18939), CGS21680 hydrochloride (MCE, HY-13201A), adenosine (MCE, HY-B0228), sodium [13C3]pyruvate (MCE, HY-W015913S), ADP (MCE, HY-W010918) and wheat germ agglutinin (Alexa Fluor 555; Thermo Scientific, W32464).
Compound synthesis and characterization
Full experimental procedures, compound characterization data (1H NMR and 13C NMR) and analytical spectra are provided in the Supplementary Information. A summary of the synthesis for the two key compounds (DCK and 2C-DCK) is presented below.
For the general procedure for the synthesis of 2-aryl-2-bromo-cycloketones, N-bromosuccinimide (1.5 equiv.) and dimethyl sulfoxide (2.0 equiv.) were added to a solution of 2-arylcyclohexan-1-one (1.0 equiv.) in CHCl3. The reaction mixture was stirred at room temperature and monitored by thin-layer chromatography. After completion, the reaction was quenched with saturated aqueous Na2S2O3 and water. The aqueous phase was extracted with CH2Cl2 (3 times). The combined organic layers were dried over anhydrous Na2SO4, filtered and concentrated under reduced pressure. The crude product was purified by flash column chromatography (petroleum ether/ethyl acetate) to afford the desired 2-aryl-2-bromo-cycloketone.
For the general procedure for the synthesis of ketamine derivatives (DCK and 2C-DCK), a solution of the appropriate 2-aryl-2-bromo-cycloketone (1.0 mmol) in anhydrous THF was cooled to the specified temperature (−25 °C) under a nitrogen atmosphere. The corresponding amine (methylamine for DCK; ethylamine for 2C-DCK; 4.0 equiv.) was added, and the reaction was stirred until thin-layer chromatography indicated complete consumption of the starting material. The reaction was quenched by the addition of saturated aqueous Na2CO3 and water. The mixture was extracted with CH2Cl2 (3 times), and the combined organic layers were dried over anhydrous Na2SO4. The solvent was removed in vacuo, and the residue was treated with diethyl ether and aqueous HCl. The aqueous layer was washed with diethyl ether, neutralized with saturated aqueous Na2CO3 and extracted with CH2Cl2 (3 times). The final organic layers were combined, dried over anhydrous Na2SO4 and concentrated to dryness under vacuum to produce the final product.
Below are the characterizations of DCK and 2C-DCK using NMR spectroscopy.
Compound 2 (DCK): 2-(Methylamino)−2-phenylcyclohexan-1-one
1H NMR (300 MHz, CDCl3): δ 7.45–7.34 (m, 2H), 7.33–7.19 (m, 3H), 3.01–2.79 (m, 1H), 2.48–2.19 (m, 3H), 2.03 (s, 3H), 2.01–1.91 (m, 1H), 1.90–1.61 (m, 4H). 13C NMR (75 MHz, CDCl3): δ 211.7, 138.9, 128.9, 127.6, 127.2, 70.0, 39.9, 35.5, 29.0, 27.9, 22.4.
Compound 3 (2C-DCK): 2-(ethylamino)−2-phenylcyclohexan-1-one
1H NMR (300 MHz, CDCl3) δ 7.42–7.33 (m, 2H), 7.31–7.20 (m, 3H), 2.90 (d, J = 11.0 Hz, 1H), 2.50–2.22 (m, 3H), 2.16 (s, 1H), 2.11–2.01 (m, 1H), 2.01–1.60 (m, 5H), 0.99 (t, J = 7.1 Hz, 3H). 13C NMR (75 MHz, CDCl3): δ 211.5, 139.5, 128.9, 127.5, 127.1, 69.9, 39.8, 36.6, 36.1, 27.8, 22.4, 15.7.z.
AAV vectors
The following AAV vectors were produced in-house (M.L’s laboratory) by co-transfecting HEK293T cells with the following respective AAV plasmid and helper plasmids: AAV2/9-hSyn-GRABAdo1.0, AAV2/9-EF1a-DIO-GCaMP8s, AAV2/8-GfaABC1D-GRABATP1.0 and AAV2/8-GfaABC1D-cOpsin5-T2A-mCherry. Viral particles were purified by cesium chloride density gradient ultracentrifugation, dialysed into PBS and titred by quantitative PCR (qPCR) to 5–15 × 1012 viral genomes per ml51.
The following additional vectors were obtained: AAV-hSyn-GRABAdo1.0-mut was generated in Y.L’s Laboratory; AAV-EF1α-DIO-PercevalHR and AAV2/5-GfaABC1D-PercevalHR were produced in Z.W’s laboratory; and AAV2/8-GfaABC1D-mCherry was purchased from Taitool Bioscience.
For conditional knockout in the mPFC, sgRNAs targeting Adora1 (5′-GTGTAGCGGTAGCCAGCTGA-3′, 5′-CCGGAACTTGTGGATTCGGA-3′ and 5′-GATCAAGTGTGAGTTCGAGA-3′) and Adora2a (5′-TCGCCATCCGAATTCCACTC-3′, 5′-TCTGGCGGCGGCTGACATCG-3′ and 5′-AGCACACAAGCACGTTACCC-3′) were designed. Non-targeting control sgRNAs (5′-GCGAGGTATTCGGCTCCGCG-3′, 5′-GCTTTCACGGAGGTTCGACG-3′ and 5′-ATGTTGCAGTTCGGCTCGAT-3′) were also used. Each sgRNA, driven by a U6 promoter, was co-packaged with a CMV-driven saCas9-3×HA into either AAV2/9 (for neuronal targeting) or AAV2/8 (for astrocytic targeting) vectors.
Validation of global Adora1 and Adora2a knockout and mPFC-specific knockdown was performed using qPCR on cDNA from brain tissues with the following primer pairs: Adora1 knockout (F: 5′-TGTGCCCGGAAATGTACTGG-3′, R: 5′-TCTGTGGCCCAAATGTTGATAAG-3′); Adora2a knockout (F: 5′-GTGCTGTCATTCGCCATCGG-3′, R: 5′-GGGAGCAACACAAAAGCGAAG-3′); Adora1 sgRNA for conditional knockdown (F: 5′-GCCAGAAACCCAGCATCCTC-3′, R: 5′-CAGAAAGGTGACCCGGAACT-3′); and Adora2a sgRNA (F: 5′-GCCATCCCATTCGCCATCA-3′, R: 5′-GCAATAGCCAAGAGGCTGAAGA-3′). All primers were designed to span critical exon junctions or CRISPR–Cas9-targeted regions, with reaction specificity confirmed by melt curve analysis and agarose gel electrophoresis. qPCR was carried out in triplicate using SYBR Green chemistry under standard cycling conditions.
Surgical procedures
Mice were anaesthetized with avertin (250 mg kg−1, i.p. injection) and secured in a stereotaxic apparatus (RWD). Following skull exposure, a small craniotomy was made above the target region. AAV injections were performed using a microsyringe pump (Nanoliter 2010 Injector, WPI) at a rate of 46 nl min–1 via a glass pipette. Injection coordinates (anterior–posterior (AP), medial–lateral (ML), dorsal–ventral (DV) in mm from bregma) were as follows: PrL and IL in the mPFC (+1.78, ±0.88, −2.15, respectively) with a 15° lateral-to-medial angle; ACC (+1.15, ±0.70, −1.47, respectively) with a 15° lateral-to-medial angle; HPC (−2.54, ±2.00, −1.60, respectively) and NAc (+1.20, ±1.20, −4.65, respectively).
For fibre photometry and optogenetic stimulation experiments52,53, optical fibre implantation was performed after viral injection. Optical fibres (FT200UMT, Thorlabs) mounted in ceramic ferrules were positioned above the mPFC, ACC, HPC or NAc, with the tip located 0.1 mm above the injection site. For intracranial adenosine injection, a cannula (62004, RWD) was implanted into the lateral ventricle (AP: −0.45, ML: −1.84, DV: −2.45 DV) at a 15° lateral-to-medial angle.
For in vivo two-photon imaging, mice were imaged 14 days after viral injection to allow time for virus expression. Subsequently, under anaesthesia, a 3-mm diameter skull aperture was drilled at the injection site and covered with a glass window. A stainless-steel head-restraining bar integrated with an imaging chamber was affixed with dental cement. Mice recovered for 1 week before imaging, which was conducted in the awake state.
Fibre photometry
In vivo fluorescence signals from GRABAdo1.0, GRABAdo1.0-mut, GRABATP1.0 and GCamp8s signals were recorded using a multichannel fibre photometry system54,55 (ThinkerTech). A 470-nm blue LED provided sensor excitation, with the intensity adjusted to minimize photobleaching. The resulting emission was passed through a dichroic mirror (MD498, Thorlabs) and a bandpass filter (525 ± 19.5 nm; MF525–39, Thorlabs) before detection.
Fibre photometry of PercevalHR signals was conducted on a separate two-colour multichannel optical fibre photometry system (Optical Imaging Facility, CIBR). To measure the intracellular ATP/ADP ratio, the PercevalHR sensor was alternately excited at 405 nm and 470 nm, with emission collected at 525 nm, as previously described37,56. The ratio of fluorescence intensity from 470 nm excitation to that from 405 nm excitation (F470/F405) was calculated to represent changes in the ATP/ADP ratio.
For pharmacological studies, mice implanted with an optical fibre were habituated for 15–20 min in a behaviour chamber (20 × 20 × 35 cm) to establish a baseline signal. Following habituation, the mice given an i.p. injection of the drug of interest, and fluorescence signals were continuously recorded. Animal behaviour was monitored using a top-mounted camera.
For acute hypoxia experiments, mice were placed in a cylindrical chamber with ports for the optical fibre, gas flow and an oxygen sensor (ST8100A, Smart Sensor). After a 20-min acclimation period with a continuous flow of air (21% O2), hypoxia was induced by mixing the room air with 100% N2 via a three-way valve. GRABAdo1.0 and GRABAdo1.0-mut signals were continuously recorded during acclimation, hypoxia and subsequent reoxygenation with air. After the trial, the chamber was cleaned with 70% ethanol and dried.
Fibre photometry data were analysed using custom Matlab scripts. Fluorescence changes were calculated as ΔF/F = (F – F0)/F0, where F0 represents the mean fluorescence during a baseline period before drug administration. For recordings longer than 30 min, photobleaching was corrected by subtracting a ‘blank’ signal, which was recorded from the same animals on a separate day without any drug or saline administration. From the resulting ΔF/F traces, the following parameters were quantified: peak amplitude, the maximum signal intensity reached after stimulation or drug administration; time to peak, the latency from administration to the peak amplitude; onset time, the time for the signal to reach 20% of the peak amplitude; rise time, the interval during which the signal increased from 20% to 90% of its peak; and decay time, the time taken for the signal to decrease to 50% of its peak amplitude.
In vivo two-photon imaging
During imaging sessions, mice remained awake and were gently restrained using a custom-built head-fixation device. Images were acquired 100–150 µm below the dura mater using a Stellaris 8 Dive multiphoton microscope (Leica, ×25 water-immersion lens with NA 1.05). The microscope was calibrated for consistent illumination and exposure settings across all imaging sessions. A 20-min baseline was recorded before ketamine (10 mg kg−1, i.p. injection) or an equivalent volume of saline as a control was given. Following the injection, imaging continued for an additional 20 min to capture changes in neural activity.
To correct for lateral shifts in two-photon images, we used the Image Stabilizer plugin in ImageJ (Fiji, v.2.14.0). For time trace analyses of fluorescence signals based on the region of interest, the Time Series Analyzer V3 plugin in ImageJ was used. ΔF/F values were calculated using customized Matlab scripts (MathWorks), and heatmaps or time traces were generated accordingly. Statistical significance was assessed using Prism 9 (GraphPad Software). All data are reported as the mean ± s.e.m. in the figures.
Confocal imaging of GRABAdo1.0 in cultured cells
HEK293T cells were cultured on 35-mm poly-d-lysine-coated glass-bottom dishes (NEST, 801002). At 60–70% confluency, cells were transfected with the GRABAdo1.0 plasmid using Neofect DNA transfection reagent (Neofect Biotech). Imaging was performed 48 h after transfection on a Zeiss LSM 880 inverted confocal microscope (Carl Zeiss) using a ×20/0.8 NA Plan-Apochromat objective. The GRABAdo1.0 sensor was excited with a 488-nm argon laser.
Behavioural assays
All behavioural assays were performed on animals 12–16 weeks old. Most behavioural assays were performed during the light phase, except for the SPT, which was performed during the dark phase to maximize the consumption of solution. Behavioural analyses were performed blinded to experimental conditions.
CRS assay
Mice were subjected to an environmental acclimation period of 3 days preceding initiation of the experiment. Subsequently, the mice were immobilized utilizing custom-fabricated restraining tubes (50 ml centrifuge tubes) with ventilation apertures to ensure the maintenance of normal respiration. The restraint protocol was implemented for a duration ranging from 4 to 6 h per day over a consecutive 14-day period57. After completion of the modelling phase, a behavioural experiment was conducted for the purpose of assessment.
LPS-induced inflammatory depression model
The LPS-induced depression model is a well-established paradigm for rapidly inducing depressive-like behaviours in mice32. In brief, i.p. administration of a low dose of LPS (0.83 mg kg–1, E. coli O127:B8, Sigma-Aldrich) induces a mild inflammatory response and triggers transient sickness behaviour within 24 h. Subsequently, between 24 and 72 h after injection, mice develop persistent depression-like phenotypes, including anhedonia, behavioural despair and anxiety-like responses.
FST assay
Mice were individually placed into Plexiglass cylinders (26.5 cm high × 18 cm in diameter) containing 14 cm of water maintained at 25 ± 1 °C. The test lasted for 6 min under standard illumination, with a digital video camera recording from the side. Immobility time during the final 4 min of the test, defined as the period during which mice floated passively with only minimal movements necessary to maintain balance, was scored by a trained observer blinded to the experimental treatments58.
SPT assay
Mice were habituated to two bottles of drinking water in their home cages for 2 days, followed by exposure to two bottles containing 2% sucrose solution for an additional 2 days. After habituation, mice were deprived of water for 24 h and then presented with one bottle of 1% sucrose solution and one bottle of water for 2 h during the dark phase. The positions of the bottles were switched after 1 h to control for side preference. Sucrose preference was calculated as the percentage of sucrose intake relative to the total fluid intake (sucrose and water combined)59.
Open-field test
Locomotor activity was assessed using an infrared open-field system (Med Associates; 50 × 50 × 30 cm). Baseline activity was measured in WT, Adora1–/ and Adora2a–/– mice during a 10-min session. Mice were placed at the centre of the arena, and total travel distance was recorded using an automated tracking system. To evaluate the effects of ketamine and DCK, mice were acclimated for 15 min in the arena, followed by drug administration. Locomotor activity was monitored for 75 min after treatment, with total travel distance recorded over the 90-min session. In a separate experiment, WT, Adora1–/– and Adora2a–/– mice underwent the same acclimation period (15 min) followed by ketamine and saline administration, with activity recorded for 30 min after treatment.
ECT in mice
Following CRS, mice were anaesthetized with avertin, and their ears were cleaned with 70% ethanol. ECT was delivered via ear-clip electrodes using a YC-3 Bipolar Programmable Stimulator, applying an electrical current of 40 mA (100 Hz, 10-s duration, 0.5-ms pulse width)60. This stimulation induced a tonic–clonic seizure lasting approximately 10 s. Sham-treated animals underwent identical handling, including electrode attachment, but no current was delivered.
aIH treatment
Mice subjected to CRS were exposed to aIH using an interval conditioning regimen42. The regimen comprised five cycles of a 5-min hypoxia period at 9% O2, each followed by a 5-min normoxic interval (21% O2), repeated daily for three consecutive days. The oxygen concentration was monitored in real time using an integrated sensor (ST8100A, Smart Sensor). The antidepressant effects of aIH were assessed using established models of depressive-like behaviour, including the FST and SPT. For fibre photometry recordings of adenosine dynamics, a 15-min baseline recording was performed before aIH exposure to monitor signal changes in response to the interval training protocol.
Local drug infusion
Bilateral 26-gauge guide cannulae (RWD Life Science) were stereotaxically implanted to target the mPFC (AP: +1.78 mm, ML: ±0.5 mm, DV: −2.05 mm from bregma) and the HPC (AP: −2.54 mm, ML: ±2.00 mm, DV: −1.60 mm). Following a 7-day postoperative recovery period, during which dummy cannulae maintained patency, mice were subjected to a 2-week CRS paradigm. For microinfusions, adenosine (0.1 µg µl–1) were dissolved in sterile 0.9% saline. Solutions were delivered bilaterally (1 µl per side) at a rate of 0.2 µl min–1 via 33-gauge injectors connected to a microsyringe pump. The injectors remained in place for 7 min after infusion to allow for diffusion. Behavioural testing, using either the FST or SPT, was conducted 24 h after ketamine administration. At the conclusion of all experiments, cannula placement was histologically verified following the infusion of wheat germ agglutinin conjugated to Alexa Fluor 555 (WGA-555; 1 µl per side; Thermo Fisher Scientific).
Optogenetics
WT and Nt5e–/– mice previously subjected to CRS were used for optogenetic experiments. Animals were injected with AAVs expressing either AAV-GfaABC1D-cOpn5-T2A-mCherry (cOpn5 group) or AAV-GfaABC1D-mCherry (control group) in the target brain region. For stimulation, blue light (473 nm; MBL-III-473, Changchun New Industries Optoelectronics) was delivered through the implanted optical fibre at 20 Hz for 10 min (peak power at fibre tip: 0.75 mW)61. Stimulation timing was controlled by a Master-8 pulse generator (AMPI). FSTs and SPTs were performed 1 h after the cessation of stimulation to assess antidepressant-like effects.
LC–MS quantification of drug concentrations
WT mice were administered either adenosine receptor agonists or ketamine derivatives. At specified time points after injection (10 min for ketamine derivatives; 30 min or 24 h for agonists), mice were deeply anaesthetized with isoflurane. Whole blood was collected via retro-orbital bleeding, and mice were subsequently transcardially perfused with ice-cold PBS. Brain tissue was rapidly dissected, weighed and flash-frozen in liquid nitrogen. Blood samples were allowed to clot at room temperature and then centrifuged at 3,500g for 10 min at 4 °C to separate the serum. For analysis, serum proteins were precipitated by adding four volumes of acetonitrile to one volume of serum, followed by vortexing and centrifugation. Brain tissue was homogenized in 80% acetonitrile using a bead-based homogenizer, and the resulting lysate was clarified by centrifugation. Supernatants from both serum and brain preparations were diluted 100-fold with 80% acetonitrile. Drug concentrations were then quantified using a SCIEX 7500 triple quadrupole mass spectrometer.
Mitochondrial metabolic flux analysis
Mitochondrial isolation
Mitochondria were isolated from the prefrontal cortex of adult mice using a commercial kit (EpiZyme, PC205) with minor modifications. In brief, dissected tissue was homogenized, and crude mitochondria were pelleted by differential centrifugation. Highly purified mitochondria were then obtained by density gradient centrifugation according to the manufacturer’s protocol, washed and resuspended for downstream assays.
Metabolic modulation and metabolite extraction
Purified mitochondria were incubated for 30 min at 37 °C in an intracellular buffer containing sodium [13C3]pyruvate and ADP, with or without ketamine at various concentrations. Following incubation, mitochondria were pelleted, and metabolites were extracted using cold (–40 °C) 50% aqueous methanol solution followed by phase separation with chloroform. The resulting aqueous phase, containing polar metabolites, was collected for analysis.
LC–MS-based metabolomics
Metabolite profiling was performed using hydrophilic interaction chromatography (HILIC) on an XBridge BEH Amide column (Waters) coupled to a Q Exactive Plus Orbitrap mass spectrometer (Thermo Fisher Scientific). Samples were separated using a gradient of aqueous ammonium acetate/hydroxide (pH 9.4) and acetonitrile. Mass spectrometry was operated in negative ion mode at a resolution of 140,000 (m/z 200), with an AGC target of 1 × 10⁶ and a scan range of m/z 75–1,000. Metabolite identification, quantification and isotopic tracing were conducted using El-MAVEN software, with correction for natural isotope abundance. We performed PCA of the metabolomic data and defined ellipse 95% confidence intervals based on the multivariate t-distribution (Fig. 3h). The corresponding source data and analysis code are provided in the source files.
Ex vivo electrophysiology
Mice (C57BL/6J mice, 7–8 weeks old) were anaesthetized with an overdose of avertin and transcardially perfused with ice-cold, oxygenated choline-based slicing solution (in mM: 110 choline chloride, 2.5 KCl, 0.5 CaCl2, 7 MgCl2, 1.3 NaH2PO4, 25 NaHCO3, 10 glucose, 1.3 sodium ascorbate and 0.6 sodium pyruvate). Coronal brain slices (200 µm) containing the mPFC were prepared using a vibratome (Leica VT1200). Slices were first recovered at 34 °C for 40 min in oxygenated artificial cerebrospinal fluid (ACSF; in mM: 125 NaCl, 2.5 KCl, 2 CaCl2, 1.3 MgCl2, 1.3 NaH2PO4, 1.3 sodium ascorbate, 0.6 sodium pyruvate, 10 glucose and 25 NaHCO3) and then maintained at room temperature for at least 1 h before recording.
Whole-cell patch-clamp recordings were performed in Mg2+-free ACSF to relieve the voltage-dependent block of NMDARs. Recording pipettes (4–6 MΩ) were filled with a caesium-based internal solution (in mM: 115 CsMeSO3, 20 CsCl, 10 HEPES, 2.5 MgCl2, 4 sodium ATP, 0.4 sodium GTP, 10 sodium phosphocreatine, 0.6 EGTA and 5 QX-314; pH 7.25–7.30). To isolate NMDAR-mediated excitatory postsynaptic currents (eEPSCs), recordings were performed in the presence of NBQX (10 µM, MCE) and picrotoxin (100 µM, Tocris). eEPSCs were evoked by local stimulation (0.4-ms pulse, every 20 s) while holding the cell at −65 mV. Following a 4-min stable baseline, various concentrations of test compounds were bath-applied for 16 min. The degree of blockade was quantified as the eEPSC amplitude during the final minute (15–16 min) of drug application, normalized to the baseline.
Western blotting
The mPFC total protein for BDNF and CD73 detection were performed in WT, Adora1−/−, Adora2a−/− and Nt5e−/− mice. Animals were anaesthetized with isoflurane, and the mPFC tissue was quickly dissected from the brain and homogenized in lysis RIPA buffer (50 mM Tris HCl, pH 7.4 (Sigma), 150 mM NaCl, 1% Triton X-100 (Sigma) and protease inhibitor cocktail (Sigma)) on ice. After determining the protein concentration with the bicinchoninic acid assay, 35 mg of total protein from each mPFC sample was loaded onto a 4–20% SDS–PAGE gel for separation. Proteins were then transferred to a polyvinylidene fluoride membrane for western blot analyses. Rabbit anti-BDNF (1:1,000; Abcam, ab108319), rabbit anti-CD73 (1:1,000; Cell Signaling Technology, 13160), rabbit anti-GAPDH (1:5,000; Cell Signaling Technology, 2118), rabbit anti-HSP90 (1:1,000; Cell Signaling Technology, 4874) and HRP-conjugated antibody goat anti-rabbit IgG (1:30,000; Sigma-Aldrich, AP156P) were used, along with high-sensitivity ECL reagent (Perkin Elmer). All bands were analysed using ImageJ software.
Histology and immunohistochemistry
For tissue preparation, mice were anaesthetized with an overdose of pentobarbital and intracardially perfused with PBS followed by 4% paraformaldehyde in PBS. Brains were postfixed in 4% paraformaldehyde for 4 h at room temperature or overnight at 4 °C, then cryoprotected in 30% sucrose until they sank. Coronal sections (35 µm) were prepared using a cryostat (Leica CM1950). Virus expression and fibre implantation sites were verified in brain sections using an Olympus VS120 slide scanner with a ×10 objective.
Statistics and reproducibility
All experiments were independently performed ≥3 times with mice randomly assigned to each group, and investigators were blinded to allocation during behavioural experiments and outcome assessment. No statistical methods were used to predetermine the sample sizes.
Reporting summary
Further information on research design is available in the Nature Portfolio Reporting Summary linked to this article.
Data availability
All data supporting the findings of this study are provided within the Article and its Supplementary Information. Any additional information required to reproduce analyses is available from the corresponding authors. Source data are provided with this paper.
References
Berman, R. M. et al. Antidepressant effects of ketamine in depressed patients. Biol. Psychiatry 47, 351–354 (2000).
Zarate, C. A. Jr et al. A randomized trial of an N-methyl-D-aspartate antagonist in treatment-resistant major depression. Arch. Gen. Psychiatry 63, 856–864 (2006).
Lisanby, S. H. Electroconvulsive therapy for depression. N. Engl. J. Med. 357, 1939–1945 (2007).
Autry, A. E. et al. NMDA receptor blockade at rest triggers rapid behavioural antidepressant responses. Nature 475, 91–95 (2011).
Li, N. et al. mTOR-dependent synapse formation underlies the rapid antidepressant effects of NMDA antagonists. Science 329, 959–964 (2010).
Aguilar-Valles, A. et al. Antidepressant actions of ketamine engage cell-specific translation via eIF4E. Nature 590, 315–319 (2021).
Casarotto, P. C. et al. Antidepressant drugs act by directly binding to TRKB neurotrophin receptors. Cell 184, 1299–1313 (2021).
Moda-Sava, R. N. et al. Sustained rescue of prefrontal circuit dysfunction by antidepressant-induced spine formation. Science 364, eaat8078 (2019).
Kim, J. W., Suzuki, K., Kavalali, E. T. & Monteggia, L. M. Ketamine: mechanisms and relevance to treatment of depression. Annu. Rev. Med. 75, 129–143 (2024).
Zanos, P. et al. NMDAR inhibition-independent antidepressant actions of ketamine metabolites. Nature 533, 481–486 (2016).
Yang, Y. et al. Ketamine blocks bursting in the lateral habenula to rapidly relieve depression. Nature 554, 317–322 (2018).
Anis, N. A., Berry, S. C., Burton, N. R. & Lodge, D. The dissociative anaesthetics, ketamine and phencyclidine, selectively reduce excitation of central mammalian neurones by N-methyl-aspartate. Br. J. Pharmacol. 79, 565–575 (1983).
Zanos, P. & Gould, T. D. Mechanisms of ketamine action as an antidepressant. Mol. Psychiatry 23, 801–811 (2018).
Krystal, J. H., Abdallah, C. G., Sanacora, G., Charney, D. S. & Duman, R. S. Ketamine: a paradigm shift for depression research and treatment. Neuron 101, 774–778 (2019).
Leaver, A. M., Espinoza, R., Wade, B. & Narr, K. L. Parsing the network mechanisms of electroconvulsive therapy. Biol. Psychiatry 92, 193–203 (2022).
Dunwiddie, T. V. & Masino, S. A. The role and regulation of adenosine in the central nervous system. Annu. Rev. Neurosci. 24, 31–55 (2001).
Chen, J. F., Lee, C. F. & Chern, Y. Adenosine receptor neurobiology: overview. Int. Rev. Neurobiol. 119, 1–49 (2014).
Fries, G. R., Saldana, V. A., Finnstein, J. & Rein, T. Molecular pathways of major depressive disorder converge on the synapse. Mol. Psychiatry 28, 284–297 (2023).
van Calker, D., Biber, K., Domschke, K. & Serchov, T. The role of adenosine receptors in mood and anxiety disorders. J. Neurochem. 151, 11–27 (2019).
serchov, t. et al. Increased signaling via adenosine A1 receptors, sleep deprivation, imipramine, and ketamine inhibit depressive-like behavior via induction of Homer1a. Neuron 87, 549–562 (2015).
Hines, D. J., Schmitt, L. I., Hines, R. M., Moss, S. J. & Haydon, P. G. Antidepressant effects of sleep deprivation require astrocyte-dependent adenosine mediated signaling. Transl. Psychiatry 3, e212 (2013).
Masino, S. A., Kawamura, M., Wasser, C. D., Pomeroy, L. T. & Ruskin, D. N. Adenosine, ketogenic diet and epilepsy: the emerging therapeutic relationship between metabolism and brain activity. Curr. Neuropharmacol. 7, 257–268 (2009).
Latini, S. & Pedata, F. Adenosine in the central nervous system: release mechanisms and extracellular concentrations. J. Neurochem. 79, 463–484 (2001).
Borea, P. A., Gessi, S., Merighi, S., Vincenzi, F. & Varani, K. Pharmacology of adenosine receptors: the state of the art. Physiol. Rev. 98, 1591–1625 (2018).
Wang, M. et al. Lateral septum adenosine A2A receptors control stress-induced depressive-like behaviors via signaling to the hypothalamus and habenula. Nat. Commun. 14, 1880 (2023).
Winn, H. R., Rubio, R. & Berne, R. M. Brain adenosine concentration during hypoxia in rats. Am. J. Physiol. 241, H235–H242 (1981).
Dinis-Oliveira, R. J. Metabolism and metabolomics of ketamine: a toxicological approach. Forensic Sci. Res. 2, 2–10 (2017).
Jacobson, K. A. & Gao, Z. G. Adenosine receptors as therapeutic targets. Nat. Rev. Drug Discov. 5, 247–264 (2006).
Chen, J. F., Eltzschig, H. K. & Fredholm, B. B. Adenosine receptors as drug targets—what are the challenges? Nat. Rev. Drug Discov. 12, 265–286 (2013).
Lazarevic, V., Yang, Y., Flais, I. & Svenningsson, P. Ketamine decreases neuronally released glutamate via retrograde stimulation of presynaptic adenosine A1 receptors. Mol. Psychiatry 26, 7425–7435 (2021).
Cunha, M. P. et al. Creatine, similarly to ketamine, affords antidepressant-like effects in the tail suspension test via adenosine A1 and A2A receptor activation. Purinergic Signal. 11, 215–227 (2015).
Walker, A. K. et al. NMDA receptor blockade by ketamine abrogates lipopolysaccharide-induced depressive-like behavior in C57BL/6J mice. Neuropsychopharmacology 38, 1609–1616 (2013).
Li, H. et al. Astrocytes release ATP/ADP and glutamate in flashes via vesicular exocytosis. Mol. Psychiatry 30, 2475–2489 (2025).
Bjorkholm, C. & Monteggia, L. M. BDNF—a key transducer of antidepressant effects. Neuropharmacology 102, 72–79 (2016).
Kim, J. W. et al. Sustained effects of rapidly acting antidepressants require BDNF-dependent MeCP2 phosphorylation. Nat. Neurosci. 24, 1100–1109 (2021).
Yegutkin, G. G. Nucleotide- and nucleoside-converting ectoenzymes: important modulators of purinergic signalling cascade. Biochim. Biophys. Acta 1783, 673–694 (2008).
Berg, J., Hung, Y. P. & Yellen, G. A genetically encoded fluorescent reporter of ATP:ADP ratio. Nat. Methods 6, 161–166 (2009).
Garcia-Gil, M., Camici, M., Allegrini, S., Pesi, R. & Tozzi, M. G. Metabolic aspects of adenosine functions in the brain. Front. Pharmacol. 12, 672182 (2021).
Zanos, P. et al. Ketamine and ketamine metabolite pharmacology: insights into therapeutic mechanisms. Pharmacol. Rev. 70, 621–660 (2018).
Fond, G. et al. Ketamine administration in depressive disorders: a systematic review and meta-analysis. Psychopharmacology 231, 3663–3676 (2014).
Kellner, C. H. et al. ECT in treatment-resistant depression. Am. J. Psychiatry 169, 1238–1244 (2012).
Navarrete-Opazo, A. & Mitchell, G. S. Therapeutic potential of intermittent hypoxia: a matter of dose. Am. J. Physiol. Regul. Integr. Comp. Physiol. 307, R1181–R1197 (2014).
Duszczyk, M. et al. Antidepressant-like and anxiolytic-like effects of mild hypobaric hypoxia in mice: possible involvement of neuropeptide Y. Acta Neurobiol. Exp. 75, 364–371 (2015).
Tebano, M. T. et al. Adenosine A2A receptors are required for normal BDNF levels and BDNF-induced potentiation of synaptic transmission in the mouse hippocampus. J. Neurochem. 104, 279–286 (2008).
Fontinha, B. M., Diogenes, M. J., Ribeiro, J. A. & Sebastiao, A. M. Enhancement of long-term potentiation by brain-derived neurotrophic factor requires adenosine A2A receptor activation by endogenous adenosine. Neuropharmacology 54, 924–933 (2008).
Su, T., Lu, Y., Fu, C., Geng, Y. & Chen, Y. GluN2A mediates ketamine-induced rapid antidepressant-like responses. Nat. Neurosci. 26, 1751–1761 (2023).
Duman, R. S., Aghajanian, G. K., Sanacora, G. & Krystal, J. H. Synaptic plasticity and depression: new insights from stress and rapid-acting antidepressants. Nat. Med. 22, 238–249 (2016).
Somani, A. & Kar, S. K. Efficacy of repetitive transcranial magnetic stimulation in treatment-resistant depression: the evidence thus far. Gen. Psychiatr. 32, e100074 (2019).
Lopes, J. P., Pliassova, A. & Cunha, R. A. The physiological effects of caffeine on synaptic transmission and plasticity in the mouse hippocampus selectively depend on adenosine A1 and A2A receptors. Biochem. Pharmacol. 166, 313–321 (2019).
Fredholm, B. B., Battig, K., Holmen, J., Nehlig, A. & Zvartau, E. E. Actions of caffeine in the brain with special reference to factors that contribute to its widespread use. Pharmacol. Rev. 51, 83–133 (1999).
Lin, R. et al. Directed evolution of adeno-associated virus for efficient gene delivery to microglia. Nat. Methods 19, 976–985 (2022).
Yuan, Z. et al. A corticoamygdalar pathway controls reward devaluation and depression using dynamic inhibition code. Neuron 111, 3837–3853 (2023).
Li, Y. et al. Hypothalamic circuits for predation and evasion. Neuron 97, 911–924 (2018).
Wu, Z. et al. Neuronal activity-induced, equilibrative nucleoside transporter-dependent, somatodendritic adenosine release revealed by a GRAB sensor. Proc. Natl Acad. Sci. USA 120, e2212387120 (2023).
Peng, W. et al. Regulation of sleep homeostasis mediator adenosine by basal forebrain glutamatergic neurons. Science 369, eabb0556 (2020).
Wu, Z. et al. A sensitive GRAB sensor for detecting extracellular ATP in vitro and in vivo. Neuron 110, 770–782 (2022).
Kim, K. S. & Han, P. L. Optimization of chronic stress paradigms using anxiety- and depression-like behavioral parameters. J. Neurosci. Res. 83, 497–507 (2006).
Powell, T. R., Fernandes, C. & Schalkwyk, L. C. Depression-related behavioral tests. Curr. Protoc. Mouse Biol. 2, 119–127 (2012).
Xin, Q. et al. Neuron–astrocyte coupling in lateral habenula mediates depressive-like behaviors. Cell 188, 3291–3309 (2025).
van Buel, E. M. et al. Mouse repeated electroconvulsive seizure (ECS) does not reverse social stress effects but does induce behavioral and hippocampal changes relevant to electroconvulsive therapy (ECT) side-effects in the treatment of depression. PLoS ONE 12, e0184603 (2017).
Dai, R. et al. A neuropsin-based optogenetic tool for precise control of Gq signaling. Sci. China Life Sci. 65, 1271–1284 (2022).
Acknowledgements
We thank J. Chen for providing Nt5e–/– mice; J. Li, X. Han and G. Wang for drug reagents; X. Qi and Y. He for advice on medicinal chemistry; B. Li for advice on statistical analysis; and staff at the Vector Core, Laboratory Animal Resource Center and at the Optical Imaging Core at CIBR for technical support. This study was supported by CAMS Innovation Fund for Medical Sciences (CIFMS 2024-I2M-ZD-012 to M.L.), a China Brain Initiative grant (STI2030-Major Projects 2021ZD0202803 to M.L.), the Research Unit of Medical Neurobiology at the Chinese Academy of Medical Sciences (2019RU003 to M.L.), the New Cornerstone Investigator Program (M.L. and Y.L.), the Beijing Municipal Government (M.L.), the National Key R&D Program of China (2022YFE0108700 to Y.L.), the National Natural Science Foundation of China (32400820 to Z.Y., 32422031 to Z.W., T2350008 to X.W., and 22207103 to H.W.) and the Strategic Priority Research Program of the Chinese Academy of Sciences (XDB0450102 to X.W.).
Ethics declarations
Competing interests
M.L. is the scientific founder of ThinkerTech Biotech, GenAns Biotech and Neucyber Neurotech. This relationship did not influence this study. The other authors declare no competing interests.
Peer review
Peer review information
Nature thanks Susan Masino and the other, anonymous, reviewer(s) for their contribution to the peer review of this work.
Additional information
Publisher’s note Springer Nature remains neutral with regard to jurisdictional claims in published maps and institutional affiliations.
Extended data figures and tables
Extended Data Fig. 1 Characterization and validation of ketamine-induced adenosine signals.
a, Schematic of fiber photometry setup for monitoring GRABAdo1.0 signals. b, Schematic diagram of acute hypoxia chamber (left) and real-time fluorescence changes of GRABAdo1.0 and GRABAdo1.0-mut probes in the mPFC during acute hypoxia (right; red line). Blue dashed line represents oxygen levels. c, Adenosine signals were not detected in the nucleus accumbens (NAc) following ketamine administration (10 mg·kg−1, i.p.) compared to saline control. Scale bar, 1 mm. d-h, Quantification of GRABAdo1.0 signals induced by ketamine (10 mg·kg−1, i.p.) in the mPFC, ACC, and HPC, showing adenosine peak amplitude (d), average time to peak (e), onset time (f), rise time (g), and decay time (h). i, Two-photon images show fluorescence changes of the GRABAdo1.0 probe in the prefrontal cortex at 0 s (top) and 200 s (middle) following ketamine and saline administration. Bottom, corresponding time-course heatmaps for each region of interest (ROI). Scale bar, 50 µm. j, Heatmaps showing extracellular adenosine changes in the cortex at different time points after ketamine and saline administration. Scale bar, 50 µm. k, Time course of mean adenosine levels in prefrontal cortex ROIs following ketamine or saline administration. l, Area under the curve (AUC) of adenosine levels in the mPFC of CRS and naive mice after ketamine administration (10 mg·kg−1, i.p.), normalized to the naive group. m, n, Rise time (m) and decay time (n) of GRABAdo1.0 signals in the mPFC in response to different ketamine doses. o, p, Specificity of the GRABAdo1.0 probe validated in cultured HEK293T cells. o, Heatmaps and p, time course of fluorescence changes following application of adenosine and ketamine (n = 15 cells per group). Scale bar, 10 µm. Data are mean ± s.e.m. (shading in b, c, p; error bars in d-h, l-n). Statistical analyses used a two-tailed unpaired t-test (c, l) and one-way ANOVA (m, n) (***P < 0.001). See Supplementary Table 1 for detailed statistics. The schematics in a and b were created using BioRender (https://www.biorender.com).
Extended Data Fig. 2 Effect of ketamine metabolites and metabolism inhibitors on adenosine release in the mPFC.
a, Schematic of ketamine metabolism pathways. b, c, Time course of extracellular adenosine levels in the mPFC (b) and and corresponding AUC (c) following administration of ketamine, norketamine (NK), (2 R,6 R)-HNK (all at 10 mg·kg−1, i.p.), or saline. Area under the curve (AUC, normalized to saline) (c) was calculated post-administration. d, e, Effect of ritonavir pretreatment (50 mg·kg−1, i.p.) on ketamine-induced adenosine release. d, Adenosine time course with and without ritonavir. e, Quantification of adenosine peak (ΔF/F %), time to peak, and AUC (normalized to vehicle). Recordings were performed on separate days in the same cohort of mice. f, g, Effect of ketoconazole pretreatment (50 mg·kg−1, i.p.) on ketamine-induced adenosine signals. Same conventions as in (d, e). h, i, Effects of ticlopidine pretreatment (20 mg·kg−1, i.p.) on ketamine-induced adenosine signals, displayed as in d, e. j-l, Time course and AUC of extracellular adenosine in the mPFC after administration of ritonavir (j), ketoconazole (k), or ticlopidine (l) alone, compared to vehicle. Data are mean ± s.e.m. (shading in b, d, f, h, j-l; error bars in c, j-l). Statistical analyses used a two-tailed paired t-test (e, g, i) and two-tailed unpaired t-tests (c, j-l) (**P < 0.01, ***P < 0.001). See Supplementary Table 1 for detailed statistics.
Extended Data Fig. 3 Adenosine receptor activity is critical for ketamine’s antidepressant effects without altering locomotion or adenosine release.
a, Total distance traveled in the open-field test for WT, A1 KO and A2A KO mice. b, c, Time-course (b) and quantification (c) of locomotor activity in WT, A1 KO and A2A KO mice following ketamine (10 mg·kg−1, i.p.) and saline administration. Mouse sample sizes (n) are shown in b. d, Time course of extracellular adenosine levels in the mPFC of WT, A1 KO and A2A KO mice after equal dose of ketamine, quantification of area under the curve (AUC, normalized to WT). e, Experimental timeline for assessing the impact of adenosine receptor antagonists on the antidepressant effects of ketamine. f-i. Effects of pretreatment with adenosine receptor antagonists (PSB36 for A1 and ZM241385 for A2A; 1 mg·kg−1, i.p.) on ketamine’s antidepressant actions (forced swimming immobility: f, h; sucrose preference: g, i) 1 h (f, g) and 24 h (h, i) after ketamine administration. j, upper, Experimental timeline for testing the effect of adenosine receptor antagonists on the antidepressant-like action of ketamine in a lipopolysaccharide (LPS)-induced depression model. lower, Effects of pretreating an A1 antagonist (PSB36, 1 mg·kg−1, i.p.) and A2A antagonist (ZM241385, 1 mg·kg−1, i.p.) on ketamine’s antidepressant actions in a FST test of LPS-challenged mice. Data are mean ± s.e.m. (error bars in a–c, f-j; shading in d). Two-tailed unpaired t-tests were used for a, c, d, f-j (*P < 0.05, **P < 0.01, ***P < 0.001). See Supplementary Table 1 for detailed statistics. The schematics in e and j were created using BioRender (https://www.biorender.com).
Extended Data Fig. 4 Adenosine receptor activation produces antidepressant-like effects.
a, Experimental timelines for assessing the antidepressant-like effects of direct adenosine administration or systemic delivery of specific adenosine receptor agonists in mice subjected to chronic restraint stress (CRS). b, c, Rapid antidepressant-like effects. b, Immobility time in the FST 30 min after intracerebroventricular (i.c.v.) injection of adenosine (1 µg per mouse). c, Immobility time in the FST 30 min after intraperitoneal (i.p.) injection of an A1 receptor agonist (CHA; 0.1 mg·kg−1) or an A2A receptor agonist (CGS21680; 0.1 mg·kg−1). d, e, Sustained antidepressant-like effects. Immobility time in the FST (d) and sucrose preference (e) were measured 24 h after i.p. administration of CHA or CGS21680 in CRS mice. f, Concentrations of CHA and CGS21680 in serum (top) and brain tissue (bottom) at 30 min and 24 h after i.p. injection, measured by LC-MS. Data are mean ± s.e.m. (error bars in b–f). Two-tailed unpaired t-tests were used for b–e (*P < 0.05, **P < 0.01, ***P < 0.001). See Supplementary Table 1 for detailed statistics. The schematic in a was created using BioRender (https://www.biorender.com).
Extended Data Fig. 5 Regional specificity of adenosine-mediated effects.
a-c, Direct infusion of adenosine into the mPFC produced sustained antidepressant-like effects. a, Experimental timeline and representative image of the bilateral infusion site in the mPFC of CRS. Scale bar, 500 µm. b,c, Immobility time in the forced swim test (FST; b) and sucrose preference (c) were measured 24 h after infusion of adenosine (0.1 µg per side). d, FST immobility time in CRS-exposed WT and CD73 knockout (KO) mice following cOpn5-mediated optogenetic stimulation in the mPFC. e, Ketamine-induced BDNF upregulation in the mPFC requires A1/A2A receptor signaling. Top, representative western blots. Bottom, quantified BDNF protein in WT, A1 KO and A2A KO mice 30 min after receiving saline or ketamine (10 mg·kg−1, i.p.). f-j, Adenosine signaling in the dorsal HPC (dHPC) does not elicit antidepressant-like effects. f, images showing adenosine infusion (upper) and optogenetically induced adenosine production (lower) within the dHPC. Scale bar, 500 µm. g, h, FST immobility (g) and sucrose preference (h) in CRS mice 24 h post-infusion (0.1 µg per side). i, j, FST immobility (i) and sucrose preference (j) measured 1 h post-stimulation (cOpn5 vs mCherry) in CRS mice. k-m, Adenosine receptor signaling in the mPFC is necessary for the rapid antidepressant-like effects of ketamine. k, Representative image of saCas9-HA expression (yellow) in the mPFC. Scale bar, 1 mm. l, m, Immobility time in the FST (l) and sucrose preference (m) were measured 1 h after ketamine administration (10 mg·kg−1, i.p.) in CRS-exposed Cas9 mice expressing sgRNAs targeting the A1 receptor, the A2A receptor or a non-targeting control. Data are mean ± s.e.m. (error bars in b–e, g–j, l, m). Two-tailed unpaired t-tests were used for b–e, g–j, l, m (*P < 0.05, **P < 0.01). See Supplementary Table 1 for detailed statistics. The schematic in a was created using BioRender (https://www.biorender.com).
Extended Data Fig. 6 Ketamine-induced adenosine surges are independent of extracellular ATP hydrolysis and broad neuronal hyperactivation.
a, Schematic of extracellular adenosine generation via ATP hydrolysis. b-d, Ketamine does not alter extracellular ATP levels in the mPFC. b, Representative image of GRABATP1.0 expression (green). Scale bar, 500 µm. c, Time course of extracellular ATP following ketamine (10 mg·kg−1, i.p.) or saline administration. d, Corresponding AUC, normalized to saline. e-g, Ketamine-induced adenosine release does not depend on the ectonucleotidase CD73. e, Western blot validation of CD73 knockout (KO). f, Time course of extracellular adenosine in WT (n = 13 mice) and CD73 KO mice (n = 10 mice) after ketamine administration. g, Quantification of adenosine peak and AUC, normalized to WT. h, i, Time course (h) and AUC (i) of extracellular adenosine in the mPFC following the administration of dipyridamole (i.c.v., 1 µg) or vehicle. j-l, Ketamine inhibited Ca²+ signaling in pyramidal neurons. j, Representative images show GCaMP8s expression (green) in mPFC pyramidal neurons of CaMKII-Cre mice. k, Time course of Ca²+ signals in mPFC pyramidal neurons in response to ketamine (10 and 20 mg·kg−1, i.p.) and saline. l, AUC (normalized to saline) quantification of Ca²+ signals in pyramidal neurons. Scale bar, 200 µm. m-o, Ketamine inhibited Ca²+ signaling in inhibitory interneurons. m, Representative images showing GCaMP8s expression in GABAergic neurons of VGAT-Cre mice. n, Time course of Ca²+ signals in mPFC GABAergic neurons in response to ketamine (10 mg·kg−1, i.p.) and saline. o, AUC quantification of Ca²+ signals in GABAergic neurons. Scale bar, 200 µm. p, q, Temporal dynamics of intracellular energy and extracellular adenosine. p, Aligned time courses of PercevalHR (ATP/ADP) and GRABAdo1.0 (adenosine) signals following ketamine injection (10 mg·kg−1; adenosine data replotted from Fig. 1e). q, Quantification of the time to peak for each signal. Data are mean ± s.e.m. (shading in c, f, h, k, n, p; error bars in d, g, i, l, o, q). The box plot in g shows the median (center line), first and third quartiles (box bounds), and 1.5 × IQR (whiskers). Statistical analyses used a two-tailed paired t-test (i) and two-tailed unpaired t-tests (d, g, l, o, q) (*P < 0.05, **P < 0.01, ***P < 0.001). See Supplementary Table 1 for detailed statistics. The schematic in a was created using BioRender (https://www.biorender.com).
Extended Data Fig. 7 Ketamine directly modulates mitochondrial TCA cycle flux.
a, Schematic illustrating the incorporation of ¹³C atoms from pyruvate-13C3 into key tricarboxylic acid (TCA) cycle intermediates. b, Heatmap showing the relative ¹³C-enrichment of TCA cycle metabolites in isolated brain mitochondria incubated with increasing concentrations of ketamine (3 replicates for each concentration). Data are Z-score normalized to the vehicle control group for each metabolite. c, Quantification of ¹³C-labeling for representative TCA cycle intermediates across ketamine concentrations. Data are mean ± s.e.m. (error bars in c). One-way ANOVA was used (*P < 0.05, **P < 0.01). See Supplementary Table 1 for detailed statistics.
Extended Data Fig. 8 In vivo characterization of ketamine analogues: adenosine release and locomotor activity.
a, Chemical structures of the synthesized ketamine analogues. b, Heatmap of peak adenosine signal (upper) and AUC (lower) in the mPFC following administration of each analogue (10 mg·kg−1, i.p.). All values are normalized to the response induced by an equivalent dose of ketamine. c, Locomotor activity time course after ketamine or DCK administration. Baseline recorded for 15 min; i.p. injection at dashed line; activity monitored for 75 min post-injection. Mouse sample sizes (n) are shown near the data series. d, Dose-dependent increase in locomotor activity induced by ketamine and DCK. Data are mean ± s.e.m. (c, d). Two-tailed unpaired t-tests between drugs and saline control (*P < 0.05, ***P < 0.001). See Supplementary Table 1 for detailed statistics.
Extended Data Fig. 9 Comparative analysis of NMDA receptor blockade and adenosine modulation by ketamine analogues.
a–g, Normalized NMDA receptor-mediated excitatory postsynaptic currents (NMDAR-eEPSCs; left) and adenosine responses (right) for each analogue. The numbers in the left panels indicate the sample size (n, cells) for each concentration (increasing left to right). Those in the right panels indicate mouse sample size. h, Relative brain tissue concentrations of ketamine analogues (n = 6, 3, 3, 3, 3, 3, 3 mice, respectively) 10 min after intraperitoneal injection (i.p.), measured by LC–MS and normalized to ketamine. i, Lack of significant correlation between estimated NMDAR inhibition in brain tissue and adenosine modulation in the mPFC by ketamine analogues (Pearson correlation, P = 0.097). Data are mean ± s.e.m. (error bars in a–h; shading in a–g). See Supplementary Table 1 for detailed statistics.
Extended Data Fig. 10 Acute intermittent hypoxia (aIH) alleviates depressive-like phenotypes through adenosine signaling.
a, Experimental timeline for acute intermittent hypoxia (aIH) exposure in mice. b, Oxygen-dependent adenosine dynamics in the mPFC, monitored with GRABAdo1.0 sensor during graded hypoxia (9–21% O2; n = 11 mice). c-e, Experimental paradigm for assessing aIH antidepressant efficacy (c), FST immobility time (d), and sucrose preference (e) of CRS-challenged WT, A1 KO and A2A KO mice. f, Open-field locomotor activity in WT, adenosine receptor A1 KO and A2A KO mice before and after aIH following CRS. Data are mean ± s.e.m. (shading in b; error bars in d–f). Two-tailed unpaired t-tests were used for d–f (***P < 0.001). See Supplementary Table 1 for detailed statistics. The schematics in a and c were created using BioRender (https://www.biorender.com).
Supplementary information
Rights and permissions
Open Access This article is licensed under a Creative Commons Attribution-NonCommercial-NoDerivatives 4.0 International License, which permits any non-commercial use, sharing, distribution and reproduction in any medium or format, as long as you give appropriate credit to the original author(s) and the source, provide a link to the Creative Commons licence, and indicate if you modified the licensed material. You do not have permission under this licence to share adapted material derived from this article or parts of it. The images or other third party material in this article are included in the article’s Creative Commons licence, unless indicated otherwise in a credit line to the material. If material is not included in the article’s Creative Commons licence and your intended use is not permitted by statutory regulation or exceeds the permitted use, you will need to obtain permission directly from the copyright holder. To view a copy of this licence, visit http://creativecommons.org/licenses/by-nc-nd/4.0/.
About this article
Cite this article
Yue, C., Wang, N., Zhai, H. et al. Adenosine signalling drives antidepressant actions of ketamine and ECT. Nature (2025). https://doi.org/10.1038/s41586-025-09755-9
Received: 27 January 2025
Accepted: 14 October 2025
Published: 05 November 2025
Version of record: 05 November 2025
DOI: https://doi.org/10.1038/s41586-025-09755-9