.png)

It has been long claimed that AMD’s AI servers can achieve better inference performance per total cost of ownership (TCO) than Nvidia. We have spent the past six months investigating and validating this claim through a comprehensive analysis and benchmarking of inference solutions offered by both Nvidia and AMD. We expected to arrive at a simple answer, but instead the results were far more nuanced and surprising to us. Performance differs across different tasks such as chat application, document processing/retrieval, and reasoning.
For hyperscalers and enterprises that directly own and operate GPUs, we found that in some workloads, Nvidia has a stronger performance per $ (perf/$), while in other workloads AMD has stronger perf/$. For customers that are using short to medium term rentals (sub-6 month) from Neoclouds, Nvidia always wins on performance per dollar. This is due to the lack of AMD Neoclouds which has led to elevated rental market rate for MI300X, Mi325X. In contrast, when it comes to Nvidia GPUs, there are hundreds of Neoclouds offering the H100, H200 among other cards, making for a competitive market rental rate.
For context, the AMD MI355X is meant to be the competitor to the B200, while the MI325X is seen as the competitor to the H200. However, as we will touch on, the MI325X experienced delays in shipment which meant by the time it came to market, most customers decided to skip it for the B200.
We have been closely collaborating with AMD since the Q3 2024 prior to our AMD training article in December 2024. AMD has taken action to improve their inference solution’s developer experience and quality of, and they’ve added some Continuous Integration (CI) automated tests. Nearly 6 months later, we feel it is appropriate to re-assess. From our testing, despite the meaningful changes thus far at AMD, we still believe there is lots of room for improvement, and we will discuss the issues we ran into as well as the lack of CI coverage later in the article.
Our end goal will be to create a single unified dashboard that is publicly available, updated with the latest software every day, showing inference performance across multiple types of hardware, with multiple leading models in multiple key scenarios such as long context document tasks, chatbot tasks, reasoning tasks, and agentic workflows. This dashboard will cover multiple major inference stacks including VLLM, SGLang TensorRT LLM, and future Dynamo integrations.
Key Insights
- For customers buying hardware and using vLLM/SGLang, sometimes a single node H200 deployment has better performance per $ (perf/$) and sometimes a single node MI325X has better performance per dollar depending on workload and latency requirements.
- For most test scenarios, MI300X is not competitive with H200, delivering worse absolute performance and performance per dollar. For Llama3 405B & DeepSeekv3 670B, MI300X beats H100 in absolute performance and performance per dollar.
- For customers renting GPUs using short to medium term contracts (sub-6-month terms), Nvidia GPUs always have better perf/$ due to fact that only a handful of providers offer AMD GPU rentals on short to medium term contracts. This leads to an artificially tight market and to elevated prices. The Nvidia ecosystem, on the other hand, has over a hundred Neocloud providers offering short to medium term rentals. This abundant supply has led to a competitive market, driving down costs.
- The MI325X was supposed to be the competitor to H200 but the issue was that mass shipments of the MI325X only started in Q2 2025, just one quarter after HGX B200 shipments commenced. This led to poor sales as most providers selected the HGX B200 over the MI325X.
- The MI355X will start shipping in late 2025, two quarters after B200 shipments commence.
- Software for the B200 and GB200 is still not fully fleshed out. As an example, FP8 DeepSeek V3 is not fully working properly on Tensor-RT LLM (TRT-LLM), vLLM or SGLang.
- The B200 dominates for the workloads and models that can currently be deployed on it. The MI325 and H200 is not even close in terms of performance.
- Nvidia’s TRT-LLM inference framework is known for having a poor developer experience. It has improved since the release of TRT-LLM’s pytorch backend and a vLLM-like one line CLI serve command from a huggingface model string, but it is still not close to vLLM or SGLang when it comes to the developer experience.
- TRT-LLM needs to add full support for DeepSeek and to add prebuilt TRT-LLM-serve container images.
- Serving frameworks offer too many configuration flags, creating a combinatorial explosion of setups that makes comprehensive benchmarking nearly impossible. AMD made this worse by adding environment variables, despite our previous advice to remove them. Most users will not get peak performance because it is impossible to know which flags and variable to use without very deep thorough sweeps for each type of workload.
- Anush and his team are working hard on bringing ROCm SGLang CI Coverage to parity with Nvidia’s coverage but there is still a far way to go. It is at less than 10% parity with NVIDIA currently.
- AMD should utilize their robust financial resources to increase spending on internal cluster resources. Last quarter, AMD spent $749 million on stock buybacks, but only ~$13M on internal R&D cluster resources. The lack of abundant R&D cluster resources is a key factor behind the weaker developer experience compared to Nvidia as well as AMD’s continued lag between NVIDIA when it comes to AI software. We think that rediverting even a small amount of the sizeable buyback amounts could lead to much better long-term shareholder returns without sacrificing short-term shareholder satisfactions from the buybacks.
- Models score worse on various evals on ROCm compared to CUDA due to lack of CI and numeric accuracy kernels.
SemiAnalysis is hiring additional Member of Technical Staff to help us further advance open-source benchmarking efforts and system modeling. This work is highly impactful, is supported by access to the best available hardware, and has a high impact on the ecosystem. To apply, send your resume and 5 bullet points demonstrating engineering excellence here. We are also hiring Research Analysts in South Korea and Singapore.
We are very thankful to AMD and Nvidia for being supportive of our independent analysis. Their technical support throughout this process has been invaluable. We want to shout out to and thank Anush Elangovan (AMD AI Czar) and his team for triaging and fixing our various bug reports and looking over our results to make sure we have the correct flags turned on (there are many for AMD). On the Nvidia side, we are grateful to Ian Buck for the support as well as to Kedar Pandurang Potdar and Sridhar Ramaswamy for triaging and fixing our bug reports and for their support.
Thank you to TensorWave, Nebius, Crusoe, DataCrunch and CoreWeave for the compute and for supporting an open ecosystem that enables independent benchmarking and analysis.
 Source: SemiAnalysis
H100 vs MI300X vs H200 vs MI325X vs B200 vs MI355X
The decode phase of inference tends to be memory bandwidth bound. As such, the two main system specifications that matter are HBM capacity and HBM Bandwidth. We see that a single MI300 node (with 1,536GB HBM capacity) has a clear advantage over an H100 node (with 640GB HBM capacity) as the H100 cannot even fit DeepSeek V3 FP8 within the single node. NVIDIA addressed the capacity shortcoming in Q3 2024 when they started mass production of H200, which has 141GB of memory compared to just 80GB of HBM Capacity in H100 and delivers better performance than the MI300 in our testing. AMD’s answer to H200 was the MI325X, but it unfortunately came to the market too late with customers opting to purchase the B200 instead.
 Source: SemiAnalysis
The MI325X was supposed to ship in Q3 2024, the same quarter as the H200 started shipping, but due to delays, it instead started shipping volume in Q2 2025. This put it into direct competition with the HGX x86 B200 SXM which started rolling out to customers starting in Q1 2025. Most customers have decided to purchase the B200 over the MI325X, which is why the MI325X has not seen considerable hyperscaler volumes outside of Meta.
To be clear, production delays are not just an AMD problem, on the Nvidia side, the GB200 NVL72 has faced massive delays due to challenges integrating the NVLink backplane as well as a lack of backplane debugging tools available to cluster operators.
AMD’s market share in Datacenter AI GPUs has been increasing at a steady pace since Q1 CY2023. However, in Q1 CY2025, Nvidia’s massive Blackwell ramp commenced, and with AMD’s answer to Blackwell only coming by Q3 2025, AMD’s market share accordingly dipped in Q1 CY2025. We expect AMD’s market share to decline in Q2 CY2025. However, with AMD’s MI355X coming out later this year as well as AMD’s rapid pace of software improvement, we see the potential for AMD to recapture some market share late this year or early next year.
 Source: SemiAnalysis Accelerator Model, AMD Earnings, Nvidia Earnings
Inference Benchmark Methodology – Online Throughput vs Latency
In order for our benchmark to be as close to real world inference workloads as possible, our inference benchmarking methodology emphasizes analyzing online throughput against end-to-end latency per user for a given configuration rather than being based on traditional offline benchmarking. Unlike offline benchmarks, which measure throughput under ideal conditions without accounting for real-world latency impacts, our approach explicitly captures the trade-off between how many users the system concurrently handles and the latency each individual user experiences. By progressively increasing the number of concurrent users, we measure how latency increases, enabling us to derive a realistic throughput metric that directly reflects operational conditions and user experience.
We will start by explaining key metrics to understand and the definition of these metrics.
Throughput measures the amount of work completed within a given time period—for example, how many tokens can be processed per second by each GPU. Higher throughput means the system can serve more requests simultaneously, increasing overall capacity, efficiency and revenue.
Latency refers to the time taken to complete a single request—from the moment the request is made until the final response is delivered. Lower latency means faster responses and a better user experience. In our framework, we focus on End-to-End (E2E) Latency, which we define below.
In inference benchmarking, these two metrics are correlated. Increasing throughput by adding more concurrent requests typically raises the latency experienced by individual users. This is because as a system handles many concurrent users, resources become more strained, causing individual requests to wait longer. Conversely, optimizing for low latency often limits overall throughput, because fewer requests are processed simultaneously to keep responses rapid.
Understanding the balance between throughput and latency is essential for choosing the right configuration – interactive applications prioritize low latency for responsive user experiences, while batch processing tasks prioritize higher throughput even if latency per request increases.
Time to First Token (TTFT) represents the initial latency a user experiences from sending a request to receiving the first generated token, reflecting the time to prefill the whole input prompt tokens.
Time Between Output Tokens (TBOT) quantifies the latency between successive tokens once the initial token is generated, capturing steady-state inference performance.
End-to-End (E2E) Latency is calculated as E2E Latency = TTFT + (Output Sequence Length * TBOT). It is our preferred metric to analyze user experience because it incorporates all the various sources of latency when processing requests. This is in contrast to some analyses that only compare throughput per GPU vs TBOT.
 Source: SemiAnalysis
Traditional offline benchmarks fail to model realistic user conditions by neglecting these latency interactions and concurrency effects, thus producing overly optimistic throughput numbers disconnected from real operational contexts. When offline benchmarks analyze throughput vs batch size, the results are not accurate because different AI chips could have very different latencies even when throughput per GPU is the same for a given batch size.
 Offline Throughput Benchmark, Source: Signal65
Inference Benchmark Methodology – Model Selection
There two main categories of models for real world production workloads: Dense architectures and sparse Mixture-of-Experts (MoE) architectures.
For dense models, we tested Llama3 70B at FP16 precision as a representative of medium-scale FP16 deployments and Llama3 405B at FP8 precision for large-scale dense scenarios.
To benchmark sparse MoE models, we selected DeepSeekV3 670B at FP8 precision. In terms of arithmetic intensity, approximate active, total parameter count, and memory access patterns, DeepSeekV3’s model architecture closely matches frontier closed models such as OpenAI’s 4o/4.1/o1/o3/o4 model architecture. Thus, DeepSeek is the best proxy model for benchmarking to what OpenAI’s internal model architecture likely is.
Inference Benchmark Methodology – Input/Output Token Lengths
We benchmark three distinct combinations of input and output token lengths to reflect realistic inference scenarios and performance characteristics.
The first uses a 4K-input and 1K-output token scenario. This is representative of summarization tasks which are characterized by large prefill General Matrix Multiplication (GEMM) operations. This scenario is heavily compute-bound, favoring architectures such as NVIDIA GPUs that consistently excel at compute-intensive prefills.
The second scenario, featuring 1k-input and 1k-output tokens, aligns closely with translation or conversational workloads, balancing prefill and decoding performance demands.
Lastly, we test a 1k-input and 4k-output token scenario. This is representative of reasoning-intensive tasks that output lots of reasoning tokens, meaning that performance is typically constrained by memory bandwidth rather than compute. Evaluating all three of these input/output lengths scenarios provides a comprehensive understanding of model and hardware performance across diverse inference workloads.
We will be updating these ratios in the future as workloads evolve and we gather more data.
Inference Benchmark Methodology – Inference Engines
For inference benchmarking on Llama3 70B and 405B, we selected vLLM as our primary inference engine. While many users are now switching to QWEN due to better performance, Llama3 is still the most used model. vLLM is the most widely adopted inference framework for these models. It is endorsed and actively recommended by both NVIDIA and AMD due to its optimized performance, ease-of-use, and robustness. For the H200 GPU platform, we additionally evaluated TensorRT-LLM (TRT-LLM) serve alongside vLLM. While TensorRT-LLM historically offered a suboptimal user experience due to its initial C++-based implementation, NVIDIA introduced a Python-based version in December, similar in functionality and usage style to vLLM and SGLang. However, as of our latest testing, the overall user experience and maturity of this Python-based TensorRT-LLM implementation still lags behind vLLM, although ongoing improvements continue to narrow this gap. We benchmarked both implementations for completeness.
TRT-LLM has gotten a lot easier to use with their new python pytorch backend, the availability of an easy one-line command line interface for launching inference instances as well as and their OpenAI compatible HTTP server. However, there are still a lot of issues with it – for example, DeepSeek is not working well on TRT-LLM, and Nvidia has also yet to publish python TRT-LLM-serve docker images, leading to hours of wasted time installing from source. We recommend the TRT-LLM team fix the DeepSeek V3 implementation and publish TRT-LLM-serve docker images.
 Source: SemiAnalysis
In contrast, for the substantially larger DeepSeek 670B model, we chose SGLang as the inference engine. SGLang is the most commonly recommended and adopted inference framework for DeepSeek 670B deployments, and it has received strong endorsements from Nvidia and AMD due to its capability of efficiently handling larger model sizes and the complexities inherent to DeepSeek-scale inference workloads.
Inference Benchmark Methodology – Parallelism Strategies
In our benchmarking methodology, we systematically evaluate all practical tensor parallelism (TP) configurations permitted by each GPU architecture and test scenario. For instance, when benchmarking the 405B model, AMD’s MI300X supports both TP=4 and TP=8 configurations, whereas NVIDIA’s H100 typically supports only TP=8 due to memory and performance constraints. For each parallelism configuration, we measure throughput and latency to construct a performance roofline—identifying the optimal tensor parallelism strategy that delivers maximum throughput for a given latency requirement. This comprehensive approach ensures we accurately determine the most efficient and performant parallelism settings tailored to each GPU platform and model scenario.
Note that we only test single node scenarios – with the invention of disaggregated decode and disaggregated prefill, which is used in production by all the major AI labs, multi node inferencing has become the de facto frontier standard. Unfortunately, disaggregated decode/prefill is not currently available on AMD on open software stacks, and only available on Nvidia’s systems.
Inference Benchmark Methodology – How to Interpret the Data
Our inference benchmark data should be looked at through the lens of performance per dollar and the relative performance between each GPU type. There are ways to continue to improve absolute performance by micro-optimizing (for example, using FP8 KV-cache for FP16 models or micro-optimizing max-batch-tokens) of each specific datapoint for each GPU type, but that would only optimize that specific datapoint instead of the whole curve. This is why we recommend that readers focus on the relative performance between each GPU type as opposed to absolute performance achieved.
Also, note that when comparing H200 to the rest of the GPU types, we provide results for the H200 when using the TRT-LLM inference framework as well as when using vLLM. TRT-LLM delivers stronger performance, but it has a weaker developer experience than vLLM. We recommend looking at data points for both vLLM H200 and TRT-LLM H200 instead of just looking at the TRT-LLM H200 performance curves.
Our benchmarks are made available on Docker hub with the exact vLLM and SGLang versions we tried so as to allow reproducibility.
Llama3 70B FP16 Throughput Vs Latency Results
 Source: SemiAnalysis
The figure above shows the results of serving LLaMA 3 70B for the 1k output/1k input scenario, which maps to translation and chat applications. We see that H100 and H200 with vLLM outperforms both AMD GPUs under low-latency scenarios, but the MI325X barely pulls ahead and surpasses the Nvidia setups at a higher batch size/higher concurrency.
Regarding tensor parallel (TP) size, we see TP=8 dominating low-latency scenarios, while TP=2 or TP=4 offers the highest throughput at greater batch size/high concurrency. For the AMD GPUs, TP=1 never offers the best performance, with MI325X at high concurrency being the sole exception. We believe this is because at high concurrency, the communication volume is large enough that we see the performance difference between loading data from HBM and communicating data through NVLink. MI325X’s TP=1 datapoint shows the benefit of having high HBM bandwidth.
Overall, the H200 with TRT-LLM, denoted H200-TRT, mostly dominates the benchmark. We attribute this to NVIDIA knowing their hardware best and putting great effort into tuning the performance.
 Source: SemiAnalysis
For reasoning-like workloads (1k input, 4k output) on LLaMA 3 70B, the H100 severely underperforms all other GPUs, quickly plateauing at around 900 tokens per second per GPU. On the other hand, the MI325X plateaus later than all the other GPUs, which means it has the highest throughput at around 450s latency. This also explains why H200 with vLLM surpasses the MI325X at high concurrency, even though it outperforms MI325X at low latency regions. Under the sub-300-second latency scenario, we see a clear ranking of performance (best to worst) as follows: H200 with TensorRT-LLM, H200, MI325X, MI300X, and H100.
 Source: SemiAnalysis
When it comes to serving LLaMA 3 70B for summarization-like workloads (4k input, 1k output), the prefill-heavy nature of the workload generally favors Nvidia GPUs. We see that after the 30 second latency mark, the H100 surpasses MI300X and H200 with vLLM pulls ahead of the MI325X. However, the MI325X’s TP=1 configuration again shines at high concurrency, outperforming H200 with vLLM. The H200 with TensorRT LLM remains unrivaled, offering the highest throughput at every point starting from the 20 second mark.
Llama3 405B FP8 Throughput Vs Latency Results
 Source: SemiAnalysis
For serving LLaMA 3 405B at 1k input and 1k output, we see most setups plateauing quickly. At sub-40-second latencies, the MI325X and MI300X both outperform the H100 and surprisingly the H200 with vLLM. Overall, the MI325X consistently outperforms the H200 with vLLM as well as the MI300X, and H100. The H100 barely reaches 400 tokens per second under the 150-second latency constraint. This shows the importance of memory bandwidth when serving large dense models.
Meanwhile, the H200 with TensorRT LLM again crushes its competitors. It can serve at almost 1,000 tokens per second per GPU under 150 seconds of latency, and it doesn’t show signs of plateauing with higher concurrency. We believe this is because TensorRT-LLM has better control of memory usage and as such, it can sustain higher memory utilization and improve performance.
 Source: SemiAnalysis
Serving LLaMA 3 405B for reasoning workloads (1k input, 4k output) shows the effects of being memory bound. For example, we see the H100 serving at less than half of the throughput of its counterparts. We also see the H200 with vLLM underperforming the MI300X and only overtaking it again at higher concurrency, where we perform more computation. However, that doesn’t help the H200 with vLLM compete with MI325X. The MI325 outperforms the H100, MI300X, and the H200 with vLLM across all scenarios.
The H200 with TensorRT-LLM again shows its technical prowess, offering up to 1.5x throughput under similar latency vs the MI325X. This shows that vLLM is far from optimal, and it also shows why vLLM considers TensorRT-LLM to be its main competitor.
 Source: SemiAnalysis
Based on the graph above, we can conclude that serving large dense models is AMD GPUs’ strong suit. Specifically, we see the MI325X crushing the competition across all latency scenarios and the MI300X even outperforming the H200 with vLLM at around the 250-second latency mark. On the other hand, the H100 plateaus at around 350 tokens per second, and the H200 with vLLM at 600 tokens per second. As in other cases, the H200 with TensorRT-LLM reigns supreme, significantly outperforming all the other configurations after the 50-second latency mark.
Running large dense models for summarization-like workloads is still memory-bound, despite the workload being prefill-heavy, and we can see the effects from the graph.
This is why AMD chose to use MI300X and MI325X for their large model serving.
DeepSeekV3 670B FP8 Throughput Vs Latency Results
For DeepSeekv3 670B we use the SGLang inference framework and we test H200, MI300, MI325X. We do not test the H100 as it does not fit DeepseekV3 670B into a single node.
For the translation and chat applications scenario (1k input 1k output), we see that the H200 beats the MI300X across all latency levels. The MI325X is only competitive with the H200 across a small range of latencies from 25 to 35 seconds. For the rest of the latency range, the H200 wins. At low latency for high interactivity, the H200 is the clear winner when there are only 4-16 concurrency users per model replica at a time.
 Source: SemiAnalysis
We see that for the reasoning test scenario (1k input/4k output), we see that the H200 beats the MI300 across all latency ranges. But the MI325X beats the H200 beyond a latency range of 100 seconds. For latency of below 100 seconds, the H200 is the clear winner.
 Source: SemiAnalysis
When we look at the summarization task scenario (4k input, 1k output), the same story plays out when it comes to the comparison between the between H200 and MI300X – the H200 crushes the MI300X across all latency ranges. For the MI325X, after 25 seconds of latency, the MI325X starts to surpass the H200. For the more online low latency use case, the H200 beats the MI300X and MI325X.
 Source: SemiAnalysis
At low and medium latency that is required for most applications, H200 beats our MI300X and MI325X hence labs like OpenAI opting for that instead.
TCO per Hour Per GPU – Self Owned and Operated Clusters
When considering Total Cost of Ownership (TCO), choosing between AMD and NVIDIA GPUs involves careful assessment of both capital expenditures and ongoing operating costs. AMD’s MI300X and MI325X GPUs generally present lower total hourly costs compared to NVIDIA’s H100 and H200 GPUs.
For each latency and model test scenario, we have calculated the performance per dollar in the unit of cost per million tokens to capture what the performance between AMD and NVIDIA would be after factoring in total cost of ownership as per the table below. Note that the graphs below are generated based on the TCOs in the table below and represent the total cost for a customer that is buying the GPUs for their own use. It does not represent the cost structure that renters of GPUs from Neoclouds would have.
At the end of the article, we will dive deeper into the detailed financial analysis and strategic considerations behind how we structure capex, opex and TCO calculations.
 Source: SemiAnalysis
Llama3 70B FP16 Cost Per Million Tokens
 Source: SemiAnalysis
For ultra-low latency inferencing, the MI325X and MI300X surpasses all other GPUs on performance per dollar for Llama3 70B chat and translation tasks (1k input/1k output).
 Source: SemiAnalysis
Zooming out and considering longer latency periods, we start seeing price differentiation when latency is greater than 20 seconds. AMD GPUs are less cost-effective than the H100 and the H200 with vLLM, but as latency increases, the MI325X becomes more economical than the H200 because of its great performance at high concurrency.
 Source: SemiAnalysis
Turning to our reasoning scenario (1k input, 4k output), starting with low latency applications, we see that the MI325X and MI300X wins on performance per TCO.
 Source: SemiAnalysis
Expanding this analysis into longer latency periods, we see that serving LLaMA 3 70B on the H100 is the least cost-effective due to its weak performance. The MI300X and MI325X are more expensive than H200 with vLLM and with TensorRT LLM, but they become more competitive at higher latencies. Interestingly, serving on the MI300X costs almost the same as serving on the MI325X, indicating that the performance improvement of MI325X doesn’t justify the price increase in this case.
 Source: SemiAnalysis
 Source: SemiAnalysis
We see a similar trend for summarization workloads. AMD GPUs are most cost-effective at low latency regions, and the H100 lags behind every other setup. While the H200 with vLLM and TensorRT is the most economical at mid latency regions, the MI325X’s cost per million tokens drops below that of the H200 with vLLM and becomes comparable to the H200 with TensorRT.
Llama3 405B FP8 Cost Per Million Tokens
 Source: SemiAnalysis
 Source: SemiAnalysis
Starting with the chat and translation scenario (1k input, 1k output, AMD GPUs being lower priced and being more performant in serving large dense models makes the cost efficiency differential more apparent. We see that the MI325X serves at a consistently lower cost than the H200 with vLLM and H100, and that the MI300X is on par with the H200 using vLLM as well. That said, the H200 with TensorRT LLM wins again after the 60-second latency mark with its superior performance.
 Source: SemiAnalysis
For ultra low latency 405B for reasoning tasks (1k input, 4k output), it is no question that the MI325X and MI300X beats H200 vLLM and H100 vLLM. It even beats the H200 on TRT-LLM!
 Source: SemiAnalysis
Looking at longer latencies for the reasoning task scenario, like all previous configurations for serving large dense models, both MI300X and MI325X are more price-efficient than H100 and H200 with vLLM. The caveat is that the H200 with TensorRT LLM remains the most cost-efficient among all because the performance boost it provides is greater than the price difference between the H200 and the AMD GPUs.
 Source: SemiAnalysis
 Source: SemiAnalysis
Turning to the summarization scenario (4k input, 1k output) the MI325X is the clear winner. At low latency, the MI325X outperforms all setups, including the H200 with TensorRT LLM, and it remains competitive even at high latency. The MI300X also beats the H200 with vLLM on cost-efficiency at high latency, and it comes close to the H200 with TensorRT LLM at low latency. Surprisingly, this time the H200 with TensorRT LLM can’t justify its price, despite being more performant.
DeepSeekv3 670B FP8 Cost Per Million Tokens
 Source: SemiAnalysis
For chat and translation tasks (1k input, 1k output), MI300X perf/$ is not competitive with the H200 but the MI325X is decently competitive with the H200 from 25 to 40 seconds of latency but not by much. The small gains of performance per $ is not worth the pain of switching to and adopting ROCm.
 Source: SemiAnalysis
For reasoning tasks (1k input, 4k output), we see that after 100 seconds of latency, the MI325X becomes better than the H200 – showing as much as 20% better performance per $ than H200. But we see that for low latency/medium to high interactivity cases (i.e. below 100 seconds of latency), the H200 still wins handily. The MI300X is not competitive to the H200 on reasoning tasks in terms of performance per $.
 Source: SemiAnalysis
For summarization tasks (4k input, 1k output), we see that the H200 wins for low latency/high interactivity in terms of performance per dollar.
 Source: SemiAnalysis
Staying on summarization tasks, but looking at medium to high latency, we see that the MI300X is competitive with the H200 and we see that the MI325X has 20-30% better performance per dollar than the H200.
Why does nobody use AMD besides Hyperscalers?
The performance-per-TCO analyses above focus on direct purchasing scenarios—comparing AMD GPUs to buying NVIDIA GPUs in contexts where large hyperscalers or enterprises buy hardware outright as opposed to renting GPUs from Neoclouds.
When it comes to renting GPUs – costs are very different. AMD faces a significant competitive disadvantage compared to NVIDIA, primarily due to limited availability and reduced market competition.
Currently, over 100 different Neocloud providers offer short-term (sub-six-month) rentals of NVIDIA GPUs, creating price competition and driving down rental costs. In contrast, only a handful of providers offer similar short-term AMD GPU rentals.
This scarcity in the rental market leads to artificially high prices for AMD GPU rentals, eroding AMD GPUs’ overall cost-competitiveness. Consequently, NVIDIA consistently outperforms AMD in terms of performance-per-dollar within the rental market, irrespective of latency requirements. This imbalance explains why AMD GPUs see minimal adoption beyond major hyperscalers, who typically make direct, long-term GPU purchases and can leverage AMD’s favorable hardware economics without facing the AMD rental market’s pricing constraints.
What rental price would make AMD GPUs competitive with Nvidia for renters of compute for inference?
In Q2 2025, the current 1m term contract market rental price for the H200 is at about $2.5/hr/gpu, with wide variance and .lower pricing for low quality clouds. One-month contracts for renting the MI325X are non-existent, while one-month contracts for renting MI300X stand at over $2.5/hr, which makes the MI300X uncompetitive for renting. Below, we calculated what the approximate MI300 and MI325X 1-month rental price needs to be for the MI300X and MI325X in order for them to be competitive with renting NVIDIA H200s.
 Source: SemiAnalysis
For translation and chat workloads (1k input, 1k output) MI300X rentals need to be priced at $1.9/hr in order to be competitive with the H200. The MI325X needs to be priced under $2.5/hr for a 1-month contract term to be competitive with the H200.
 Source: SemiAnalysis
For reasoning inference tasks (1k input, 4k output), the MI300X needs to be priced at under $2.1-2.4/hr for 1-month contracts in order for it to have a competitive performance per dollar with H200. For the MI325, need to be priced between $2.75/hr/gpu to $3/hr/gpu, depending on interactivity, in order to be competitive.
 Source: SemiAnalysis
For summarization tasks (4k input, 1k output), The MI325X 1-month contract should be priced $2.75 to $3/hr while the MI300X should be priced at between $2.1 to $2.4/hr.
Sneak Peek of B200 Performance
We didn’t include B200 in our full benchmark run due to the lack of software support at present. At the time of writing, most major serving frameworks don’t have stable support for B200 GPUs. vLLM’s standard release image doesn’t support B200 yet (ref), and the SGLang team hasn’t announced any clear timeline of B200 support. On AMD’s side, we didn’t benchmark the MI355X because production units aren’t available yet. Although engineering samples exist, the bugs aren’t fully ironed out and as such the system is not ready for testing yet.
While TensorRT-LLM supports B200, it’s only optimized for a small list of models, and this small list is most notably lacking DeepSeek V3 FP8. For that reason, we benchmarked B200 with TensorRT-LLM on selected models and scenarios as a sneak peek of B200’s performance. In the graph below, we present LLaMA 70B and 405B on reasoning workloads (1k input, 4k output).
 Source: SemiAnalysis
The B200 with TensorRT LLM, labeled as B200-TRT, dominates the LLaMA 70B benchmark, offering lower latency and higher throughput across the board. The MI325X and MI300X are very far from competing with the B200.
 Source: SemiAnalysis
For LLaMA 405B, the B200 again crushes all other setups at every latency and throughput while not even reaching a plateau at the highest request rate we tested.
The B200 showed extremely high performance for the benchmarks we’ve run so far. To ensure that we paint the full picture, we will report on MI355X and B200 training and inference performance within the couple months.
AMD and NVIDIA Bugs During Inference
We faced multiple roadblocks during benchmarking.
The large number of tuning flags in serving frameworks creates a combinatorially explosive number of configurations. For instance, vLLM uses max-num-seq, max-num-batched-tokens, num-scheduler-steps, and max-model-len; most of these configurations are under-documented with respect to how each flag individually affects performance. This made benchmarking extremely time-consuming, and means that it is not possible to guarantee that the proper combination has been found in order to achieve optimal performance. As a result, we had to rely on NVIDIA and AMD engineers giving us their best configurations. We hope all serving frameworks improve documentation on the performance implications of every flag, and ideally auto-tune them. This is something AMD and Nvidia should dedicate GPUs to doing and publicly serving. We are happy to collaborate.
We struggled with getting up-to-date performance results due to the speed with which serving frameworks update their code. Even when given the best configurations, every benchmark run for one GPU type takes 60 to 120 hours, while serving frameworks update code at almost a weekly basis. We had to start benchmarking from scratch because of the vLLM v0 to v1 transition, SGLang CUDA Graph capture failures, SGLang AMD segmentation fault errors, and also had to restart numerous times when we were asked to reconfigure flags. What’s worse, AMD asked us numerous times to enable features that were newly developed between feedback loops, resulting in multiple re-runs and software version disparity. We hope to mitigate this issue by publishing a live benchmark website in the future.
Another reason that benchmarking takes a long time is that we cannot parallelize experiments across machines. We see non-negligible throughput and latency differences on machines from cloud service providers, which led to AMD and NVIDIA requesting that we redo all experiments.
Finally, AMD maintaining separate repo forks and configurations caused major delays. Since AMD maintains a separate vLLM fork, we had to write a separate benchmarking setup. In terms of configuration, they added AITER-related environment variables, giving us PYTORCH_TUNABLE_OP flashbacks. We have expressed our disdain for using environment variables to enable features, and we hope this can be removed like PYTORCH_TUNABLE_OP was.
AMD SGLang CI Testing Lacks Coverage Parity
AMD’s overall continuous integration (CI) has improved a lot over the past 5 months. 5 months ago, AMD had zero SGLang inference CI but it now has some. Unfortunately, the CI test coverage is nowhere close to that of NVIDIA.
Three weeks ago, Anush (AMD AI Czar) tasked one of their hardcore engineers to work 996 in order to fix SGLang CI. AMD has made some progress but unfortunately there are still dozens of missing unit tests. Without proper testing, AMD will continue to have worse software quality and plenty more bugs leading to worse developer experience and slower adoption.
 Source: SemiAnalysis, SGLang, Github
 Source: SemiAnalysis
There are also a lot of multi-GPU unit tests missing that are relevant to DeepSeekv3 such as DP attention, MoE EP tests, etc.
 Source: SemiAnalysis
Using ROCm makes the models “Dumber” than on CUDA
In terms of nightly accuracy, AMD had ZERO accuracy tests until SemiAnalysis pointed out accuracy issues three weeks ago. For most models, we observe worse accuracy quality on AMD when compared to using NVIDIA. 25% of the tested models are failing accuracy tests when run on AMD.
This means that using the same model on ROCm, you get dumber answers than what you would get on NVIDIA.
AMD needs to task more 996 engineers to fix this immediately!
 Source: SemiAnalysis, SGLang, Github
Stock BuyBacks Versus Internal Clusters
In Q1 CY2025, AMD approximately spent $750M on stock buybacks while we estimate they only spent $13M on renting clusters for internal R&D. Although there have been massive improvements to ROCm software quality, the software quality and developer experience is still nowhere near NVIDIA software quality and feature completeness.
For example, disaggregated prefill inferencing optimization has still not come to AMD due to the lack of internal cluster level resources which is required to develop this optimization.
Our estimate of AMD’s internal R&D Budget comes from the fact that AMD internally has approximately 4,000 MI300Xs and it costs them $1.5/hr to rent from their hyperscalers and Neoclouds. $1.5/hr/gpu * 4000 GPUs * 90 days/quarter * 24hrs/day = 13M per quarter of R&D cluster spend. While they are increasing spend, they do it through short term GPU rentals rather than having committed clusters to teams and projects for long term.
 Source: SemiAnalysis
Speed is the moat and for AMD to even have a chance, they need to run even faster and make even bigger bets. More internal cluster resources will help accelerate internal development and CI support.
Why would a customer buy a large cluster from AMD if AMD themselves haven’t dogfooded and AMD themselves internally only have 4k GPUs? They bigger plans with MI325X, but these aren’t locked in for long term contracts, only short term.
AMD’s Lack of Disaggregated Prefill Inference Optimization
Although AMD wins for single node inferencing, AMD is currently lacking support for many inference features such as disaggregated prefill, Smart Routing, and NVMe KV Cache Tiering. Disaggregated serving has been an industry standard for years, and last month NVIDIA open-sourced Dynamo, a distributed inference framework, further democratizing this technique. Disaggregated serving uses separate compute instances to process different stages of requests, including prefill and decode.
 Source: Peking University
In addition, NVIDIA has partnered with SGLang to bring disaggregated serving to SGLang as well, whereas AMD SGLang disaggregated serving does not exist. Since AMD has no disaggregated prefill solution, NVIDIA wins on raw performance and performance per dollar.
AMD is looking to provide a 16-node MI300X cluster to the SGLang maintainer team at LMSys such that they can start looking into partnering and getting disaggregated prefill to work on ROCm too. We believe that a prototype of AMD disaggregated prefill using a forked version of NVIDIA dynamo will be demoed on June 12th at AMD’s Advancing AI event.
 Source: LMSys
The gaps between AMD and Nvidia’s capabilities extend to other features that form part of Nvidia Dynamo.
Dynamo Smart Router intelligently routes each token in a multi-GPU inference deployment to both available instances. For the prefill phase – this means ensuring that incoming tokens are equally distributed to the different GPUs serving prefill to avoid bottlenecks on any given experts in the prefill phase.
Similarly – in the decode phase – it is important to ensure sequence lengths and requests are well distributed and balanced across GPUs serving decode. Some experts that are more heavily trafficked can be replicated as well by the GPU Planner provided by Dynamo to help keep the load balanced.
The router also load balances across each replica serving the model which is something that AMD’s vLLM and many other inference engines do not support.
 Source: Nvidia
Dynamo’s GPU Planner is an autoscaler of both prefill and decode nodes, spinning up additional nodes with fluctuations in demand that are natural over the course of the day. It can implement a degree of load balancing among many experts in an MoE model in both prefill and decode nodes. The GPU planner spins up additional GPUs to provide additional compute to high-load experts. It can also dynamically reallocate nodes between prefill and decode nodes as needed, further maximizing resource utilization.
This additionally supports changing the ratio of GPUs used for decoding and for prefill – this is especially useful for cases like Deep Research, where more prefill is required as opposed to decoding, as these applications need to review a huge amount of context but only generate a comparatively small amount.
Unfortunately – this is not a feature that is available in the AMD ecosystem at present.
 Source: SemiAnalysis
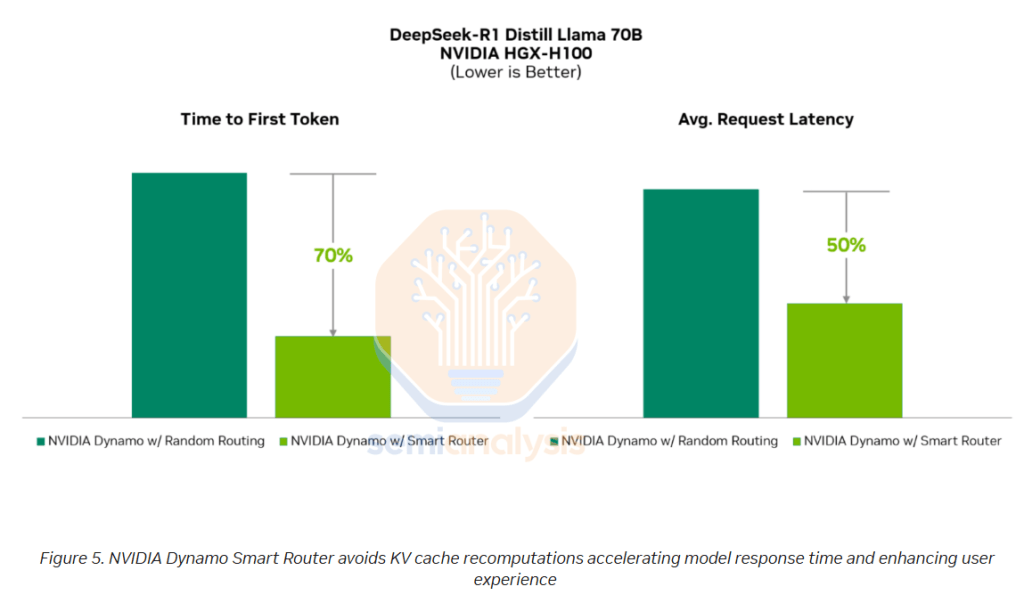
NVIDIA Dynamo’ KVCache Offload Manager allows more efficient overall execution of prefill overall by saving the KVCache from prior user conversations in NVMe storage rather than discarding it.
 Source: Nvidia
When a user engages in an ongoing multi response conversation with an LLM, the LLM needs to factor in the prior questions and responses earlier in the conversation, taking these as input tokens as well. In the naïve implementation, the inference system will have discarded the KV Cache originally used for generating those earlier questions and responses, meaning that the KV Cache will have to be computed again, repeating the same set of calculations.
Instead, with Dynamo’s NVMe KVCache offload feature, when a user steps away, the KVCache can be offloaded to an NVMe storage system until the user returns to the conversation. When the user asks a subsequent question in the conversation, the KVCache can be quickly retrieved from the NVMe storage system, obviating the need to calculate the KVCache again.
This frees up capacity on the prefill nodes to handle more incoming volume, or alternative could reduce the size of the prefill deployment needed. The user will also have a much better experience with faster time to first token as there is now much less time needed to retrieve the KV Cache vs computing it.
 Source: Nvidia
These features for KVCache offload will matter more and more as RLVR and multi-agent systems with tool use become more common, and it is another important feature for AMD to explore.
In addition to NVIDIA Dynamo, we are seeing more and more distributed serving libraries. For example, in their DeepSeek inference system replication attempt, the SGLang team used Mooncake Transfer Engine for KV cache transfer. Mooncake Transfer Engine is a high-performance, zero-copy data transfer library. Originally designed as part of the Mooncake serving platform, Mooncake Transfer Engine now integrates into NIXL as a backend plugin. Recently, Red Hat AI announced llm-d, a Kubernetes-native distributed inference framework that also uses NIXL for KV cache transfer. NIXL gaining popularity means that NVIDIA GPUs would get first-class and latest support. If AMD doesn’t work on supporting the developers, the same software fragmentation issues will happen again.
AMD engineers will need far more compute resources to explore and implement all the inference optimizations mentioned above.
Next Steps and Future Exploration
We are committed to continuing to improve our benchmarking methodology. As part of this, in the long term, we plan to set up an automated regular benchmark open-source repo, e.g. weekly runs with GitHub CI, to keep up with the pace of serving software updates. This will allow auditable benchmark logs for verification of results by the community. We have gotten commitments for multiple industry collaborators already to support this effort.
To converge our proxy benchmarks close and close to real production workloads, we will explore more the input and output sequence length ratios and collect reasoning chat logs multi-turn dataset with a diverse set of input/output lengths distribution. Finally, we will present more metrics, including time to first token (TTFT), time between output tokens (TBOT), and more.
We hope this article will serve as a call for better inference benchmarks, and we would be happy to collaborate with industry partners and serving framework developers.
Below, we will provide a detailed analysis of Capex, Opex and Total Cost of Ownership for the MI300,MI325X, H100, H200, B200, and the MI355X.
Subscribe for full access to this article
With a SemiAnalysis subscription you’ll get access to newsletter articles and article discussions.
Model access not included – please reach out to [email protected] for our institutional offerings.
Please verify your email address to proceed.
By subscribing, you agree to the Privacy Policy and Terms and Conditions.
![The Art of Poison-Pilling Music Files [video]](https://www.youtube.com/img/desktop/supported_browsers/chrome.png)


