.png)


I am in the midst of moving, so here is another short post!
Last week, we talked about how to use rejection sampling to sample possible complicated distributions, or distributions we only have limited knowledge of, or distributions that are for some reason difficult to sample directly.
Rejection sampling was actually the tool I came to second to solve this kind of problem, the first was an algorithm called Metropolis-Hastings.
I've been told (again, by a data science friend) that this is something that like, you know, everyone who has taken some number of stats classes is familiar with. But I only took the one! And I didn't know about it! And it's really cool! So now I'm gonna tell it to you.
Remember our setup from last week, we have some distribution that we'd like to sample from, but crucially, we only have some limited amount of knowledge of this distribution. We only know the probability density function, which is the derivative of the cumulative density function. Actually, we don't even know that: we have some function which is some (unknown) constant multiple of the probability density function.
This is the setup that is represented if we have a greyscale image, and we would like to sample points in a way such that darker areas have proportionally more points sampled.
We did this last week by constructing a distribution that was easy to sample from and was "bigger" than the target distribution, and then rejecting points that didn't fall in the target distribution. Then we showed there were some ways we could manipulate that distribution to be "closer" to the target so that we would reject fewer points.
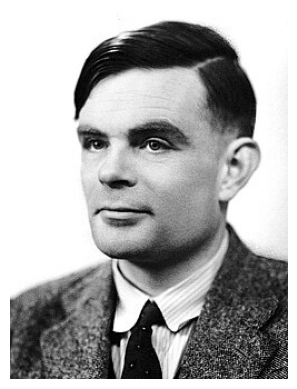
Imagine we would like to sample points from this image:
The Metropolis-Hastings algorithm is extremely simple:
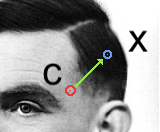
- Start from some point on the image,
- somehow, pick a new point to "jump" to. The somehow is pretty loose, it turns out. There are restric tions, but they're very benign.
- Check the intensities of the current point p(c) and the proposed point and p(x), and jump to the proposed point with probability p(x)/p(c).
- Repeat.
(More intense, guaranteed to jump. Less intense, less likely to jump.)
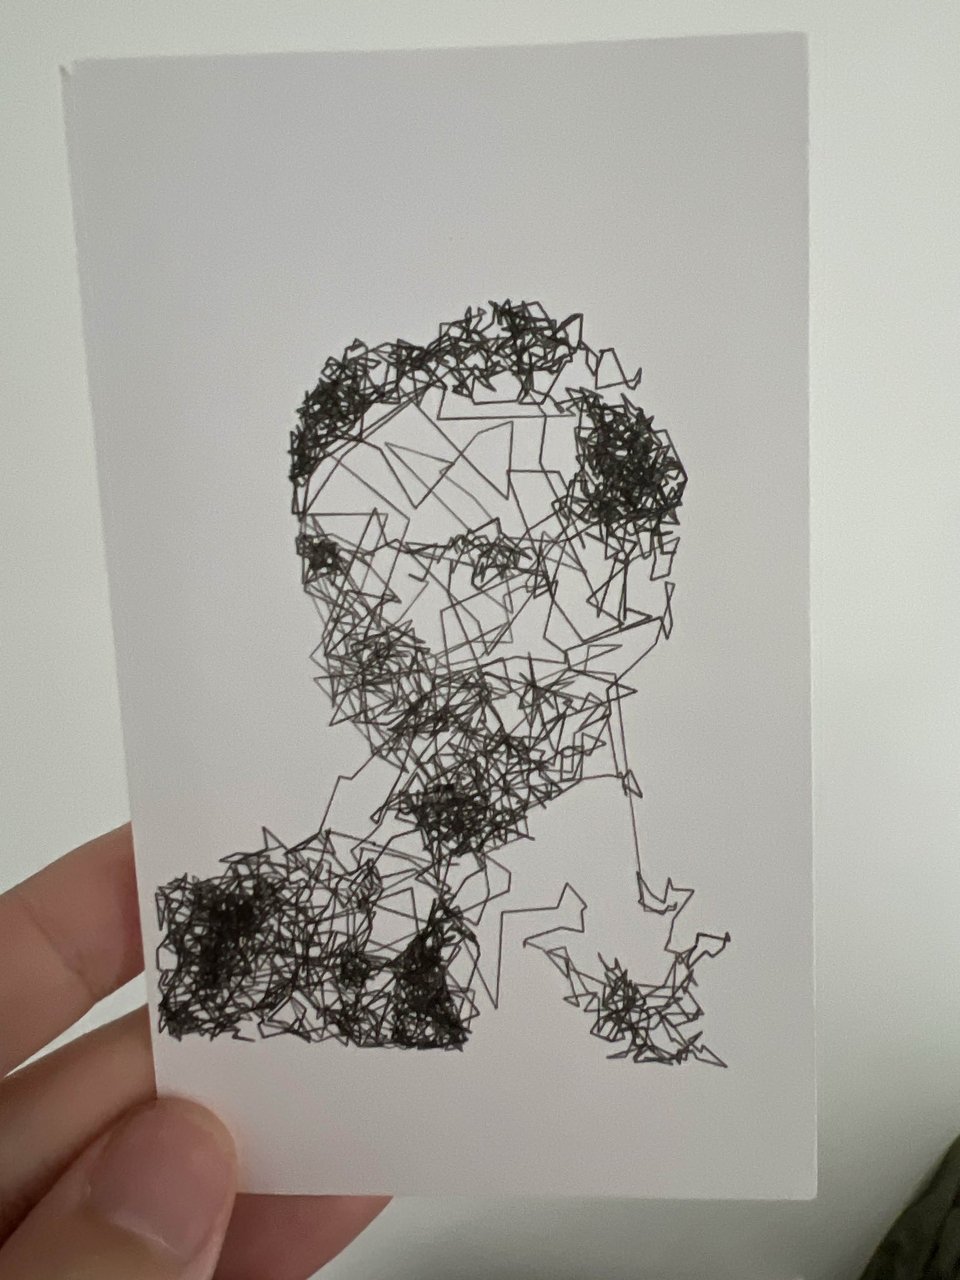
If you do this for a while, eventually, the sequence of points you generate will be as though drawn from the underlying distribution:
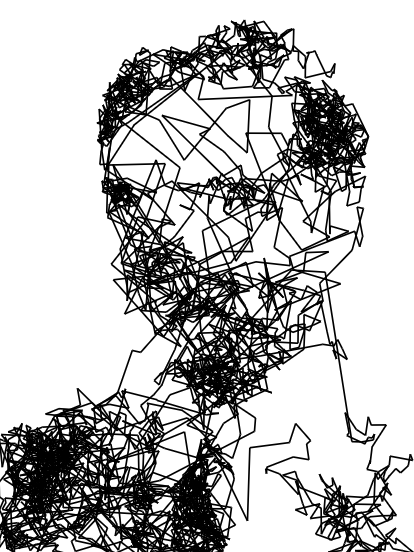
In this example, I've also drawn in the lines connecting subsequent points in the sample. This isn't very many points, and the lines themselves are not actually representative of the underlying image (only the points they're connecting are), but you can see that the image itself can be recognized from the sample.
What actually is going on here?
A Markov chain is a random variable that takes on some sequence of values, and the stationary distribution of a Markov chain is (informally) the distribution that that sequence approaches over time.
The more precise statement of what we're doing here with Metropolis-Hastings is constructing a Markov chain that has a particular stationary distribution: the one of the underlying image.
This process doesn't have to be in two dimensions: the values that our Markov chain takes on could be points on the 1D line, or 3D space. But I think it demonstrates the value of being able to take this kind of distribution by showing how easily you can use it to generate these images, with just a little bit of code.