.png)

This is a preprint.
It has not yet been peer reviewed by a journal.
The National Library of Medicine is running a pilot to include preprints that result from research funded by NIH in PMC and PubMed.
[Preprint]. 2024 Aug 6:2024.08.06.606696.
doi: 10.1101/2024.08.06.606696.
Adinda Kok 1 , Samuel H Wilks 2 , Sina Tureli 2 , Sarah L James 2 , Theo M Bestebroer 1 , David F Burke 2 , Mathis Funk 1 , Stefan van der Vliet 1 , Monique I Spronken 1 , Willemijn F Rijnink 1 , David Pattinson 1 2 3 , Dennis de Meulder 1 , Miruna E Rosu 1 , Pascal Lexmond 1 , Judith M A van den Brand 3 , Sander Herfst 1 , Derek J Smith 2 , Ron A M Fouchier 1 , Mathilde Richard 1
Affiliations
- PMID: 39553979
- PMCID: PMC11566024
- DOI: 10.1101/2024.08.06.606696
Adinda Kok et al. bioRxiv. 2024.
Abstract
Highly pathogenic avian influenza A(H5) viruses globally impact wild and domestic birds, and mammals, including humans, underscoring their pandemic potential. The antigenic evolution of the A(H5) hemagglutinin (HA) poses challenges for pandemic preparedness and vaccine design. Here, the global antigenic evolution of the A(H5) HA was captured in a high-resolution antigenic map. The map was used to engineer immunogenic and antigenically central vaccine HA antigens, eliciting antibody responses that broadly cover the A(H5) antigenic space. In ferrets, a central antigen protected as well as homologous vaccines against heterologous infection with two antigenically distinct viruses. This work showcases the rational design of subtype-wide influenza A(H5) pre-pandemic vaccines and demonstrates the value of antigenic maps for the evaluation of vaccine-induced immune responses through antibody profiles.
Conflict of interest statement
Competing interests: Authors declare that they have no competing interests.
Figures
 Fig. 1.. High resolution three-dimensional A(H5) antigenic map comprised of genetically diverse HAs.
(A) Maximum likelihood phylogenetic tree based on 14896 A(H5) nucleotide sequences, rooted on the midpoint, corresponding to the divergence of the Eurasian and American non-GsGd lineages. The HAs selected for antigenic characterization are highlighted with closed circles or open squares, color-coded based on their respective genetic lineage, as indicated in (B). Open squares represent HAs of viruses against which homologous ferret sera were raised. Zoomable pdf file with isolate names displayed is available in Data S1 and an interactive version of the tree is available at
https://itol.embl.de/tree/156831160222541718279907. (B) The three-dimensional antigenic map constructed from HI data of 117 antigens titrated against 29 post-infection sera. Antigens are represented as closed spheres and sera as open cubes. Antigens and sera are color-coded based on their respective genetic lineage as shown on the right-hand side of the figure. Each direction (x, y, z) represents antigenic distance, and one square of the grid corresponds to one antigenic unit, defined as a two-fold change in HI titer. The corresponding interactive display (Data S2) provides additional information, e.g., visualization of the map from different angles, and display of antigen and serum names. GsGd: A/goose/Guangdong/1/1996.

Fig. 2.. Antibody profiles illustrate the broad cross-reactivity in A(H5) antigenic space of ferret sera…
For each vaccine, (A) IraqVACC, (B) CVA-VietnamVACC, (C) CVA-IndonesiaVACC and (D) CVA-AnhuiVACC, antibody profiles are displayed in the antigenic map from Fig. 1B. Each plot displays the mean titers for two vaccinated ferrets. Lines connect the position of the serum with the antigens against which a titer above the assay’s detection limit was observed (i.e. ≥ 10). Antigens and connecting lines are colored by the HI titer as indicated in the right-hand legend. Numbers on top of each panel indicate the distance of the mean serum position to the center of the antigenic map, the overall GMT of the mean serum, and the mean number of titers above the detection limit per serum. The four antigens that were not titrated against these sera are shown in a transparent white color. One CVA-AnhuiVACC animal reached humane endpoints during the study because of a malignant lymphoma, which was unrelated to the experimental procedures. Due to the premature sacrifice of this ferret, data of a single serum were used for analysis and visualization in (D). GMT: geometric mean titer.

Fig. 3.. Broader, higher, and more central antibody responses in ferrets upon vaccination with split-inactivated…
For each vaccine group, antibody profiles representing the mean HI titers per group (n=6) are displayed in the antigenic map from Fig. 1B. Antibody profiles of ferrets from the vaccination-challenge with the Giza (A-C) and the Sichuan (D-F) virus, vaccinated with vaccines containing the following HA: (A, D) AnhuiVACC, (B, E) AC-AnhuiVACC, (C) GizaVACC or (F) SichuanVACC. Same representation as in Fig. 2. For an interactive version of this figure, see Data S8. AU: antigenic unit; GMT: geometric mean titer.
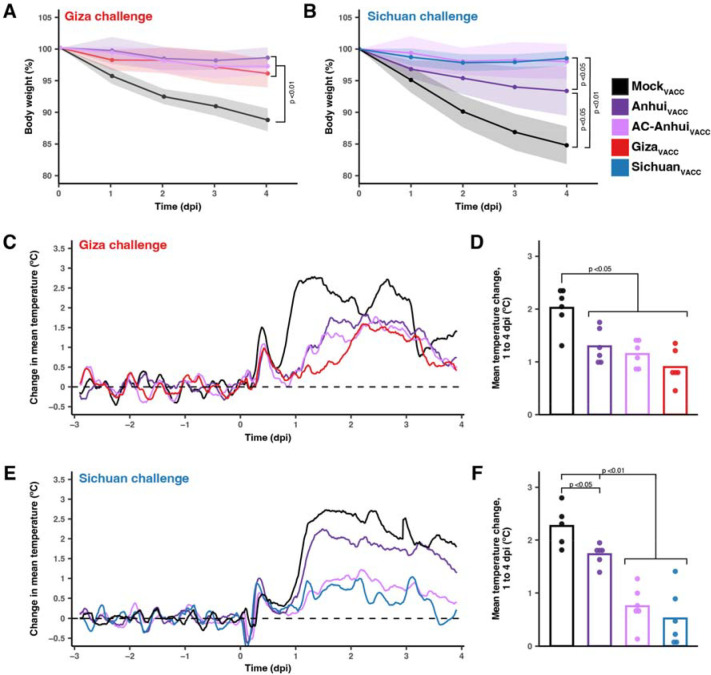
Fig. 4.. Ferret body weight and temperature changes reveal non-inferior protection of AC-Anhui VACC vaccination…
(A, B) Body weight expressed as a percentage of starting body weight of ferrets (n=6 per group) challenged with the Giza (A) or Sichuan (B) virus. Lines connect the daily arithmetic means. Shaded areas indicate the standard deviation of the mean per group. (C, E) Temperature change from baseline (mean temperature recorded during the three days prior inoculation, indicated as dashed line) of ferrets challenged with the Giza (C) or Sichuan (E) virus. Per group (n=6, n=5 for MockVACC in Sichuan challenge due to temperature probe malfunctioning), the mean of individual four-hour sliding means is displayed. (D, F) Mean temperature change from baseline between 1 and 4 dpi of ferrets challenged with the Giza (D) or Sichuan (F) virus. Dots show data of individual animals. In (E, F), data of the two deceased animals in the MockVACC group are included in visualization and analysis up until three dpi. Statistically significant differences, as determined with pairwise Mann-Whitney tests, are indicated with the corresponding p-value in (A, B, D, F). In (A, B), areas under the curve were used for statistics. Dpi: days post-inoculation.

Fig. 5.. Vaccination with AC-Anhui reduced infectious virus titers in ferret tissues equally well as…
(A) Vaccination-challenge with the Giza virus. (B) Vaccination-challenge with the Sichuan virus. Data are color-coded based on vaccine group as indicated in the legend. Bars represent the geometric mean titer (TCID50/g tissue) per group (n=6). Dots represent titers in tissues of individual animals. Horizontal black lines indicate the detection limit for each tissue. Statistically significant differences, as determined with pairwise Mann-Whitney tests, are indicated with the corresponding p-value. TCID50: 50% tissue culture infectious dose.
References
-
- Yoon S. W., Webby R. J., Webster R. G., Evolution and ecology of influenza a viruses. Curr Top Microbiol Immunol 385, 359–375 (2014). - PubMed
-
- Shaw M. L., Palese P., “Orthomyxoviridae” in Fields Virology, Knipe D. M., Howley P. M., Eds. (Lippincott Williams & Wilkins, ed. 6, 2013), pp. 1152–1181.
-
- Karakus U., Mena I., Kottur J., El Zahed S. S., Seoane R., Yildiz S., Chen L., Plancarte M., Lindsay L., Halpin R., Stockwell T. B., Wentworth D. E., Boons G.-J., Krammer F., Stertz S., Boyce W., de Vries R. P., Aggarwal A. K., García-Sastre A., H19 influenza A virus exhibits species-specific MHC class II receptor usage. Cell Host Microbe 32, 1089–1102.e10 (2024). - PMC - PubMed
-
- Xu X., Subbarao K., Cox N. J., Guo Y., Genetic characterization of the pathogenic influenza A/Goose/Guangdong/1/96 (H5N1) virus: Similarity of its hemagglutinin gene to those of H5N1 viruses from the 1997 outbreaks in Hong Kong. Virology 261, 15–19 (1999). - PubMed