.png)


Overview

Superset is fast, lightweight, intuitive, and loaded with options that make it easy for users of all skill sets to explore and visualize their data, from simple line charts to highly detailed geospatial charts.
Powerful yet easy to use
Superset makes it easy to explore your data, using either our simple no-code viz builder or state-of-the-art SQL IDE.

Integrates with modern databases
Superset can connect to any SQL-based databases including modern cloud-native databases and engines at petabyte scale.

Modern architecture
Superset is lightweight and highly scalable, leveraging the power of your existing data infrastructure without requiring yet another ingestion layer.

Rich visualizations and dashboards
Superset ships with 40+ pre-installed visualization types. Our plug-in architecture makes it easy to build custom visualizations.

Self-serve analytics for anyone
- Dashboards
- Chart Builder
- SQL Lab
- Datasets
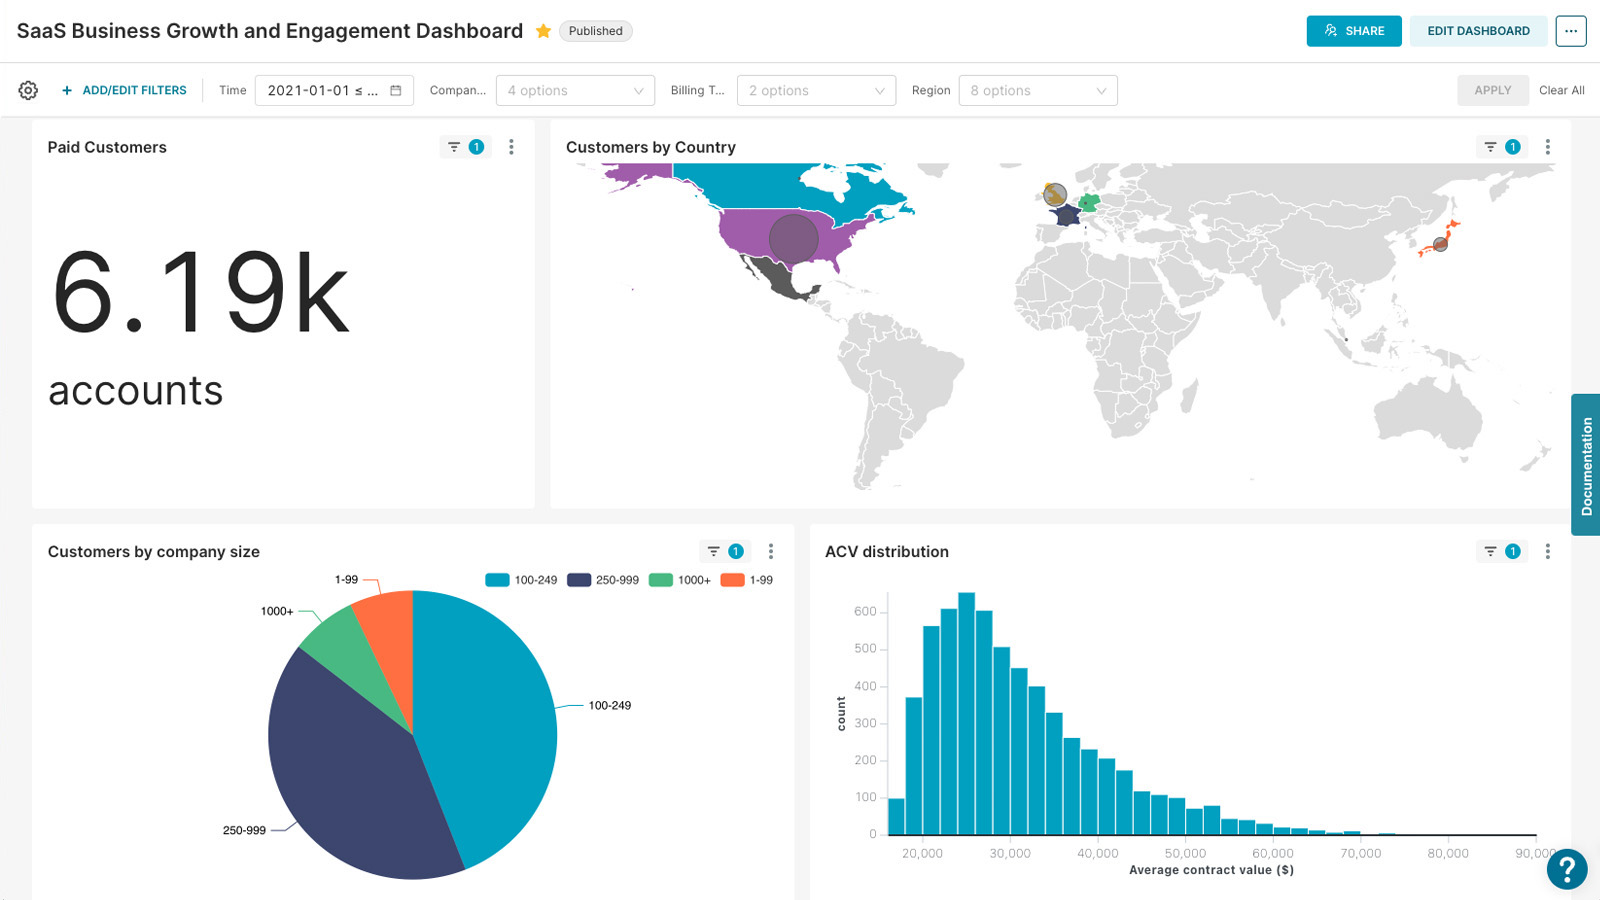
Explore data and find insights from interactive dashboards.
Key features
![]()
40+ pre-installed visualizations
![]()
Support for drag-and-drop and
SQL queries
![]()
Data caching for the faster load time of charts and dashboards
![]()
Jinja templating and dashboard filters for creating interactive dashboards
![]()
CSS templates to customize charts and dashboards to your brand’s look and feel
![]()
Semantic layer for SQL data transformations
![]()
Cross-filters, drill-to-detail, and drill-by
features for deeper data analysis
![]()
Virtual datasets for ad-hoc data exploration
![]()
Access to new functionalities through
feature flags