.png)

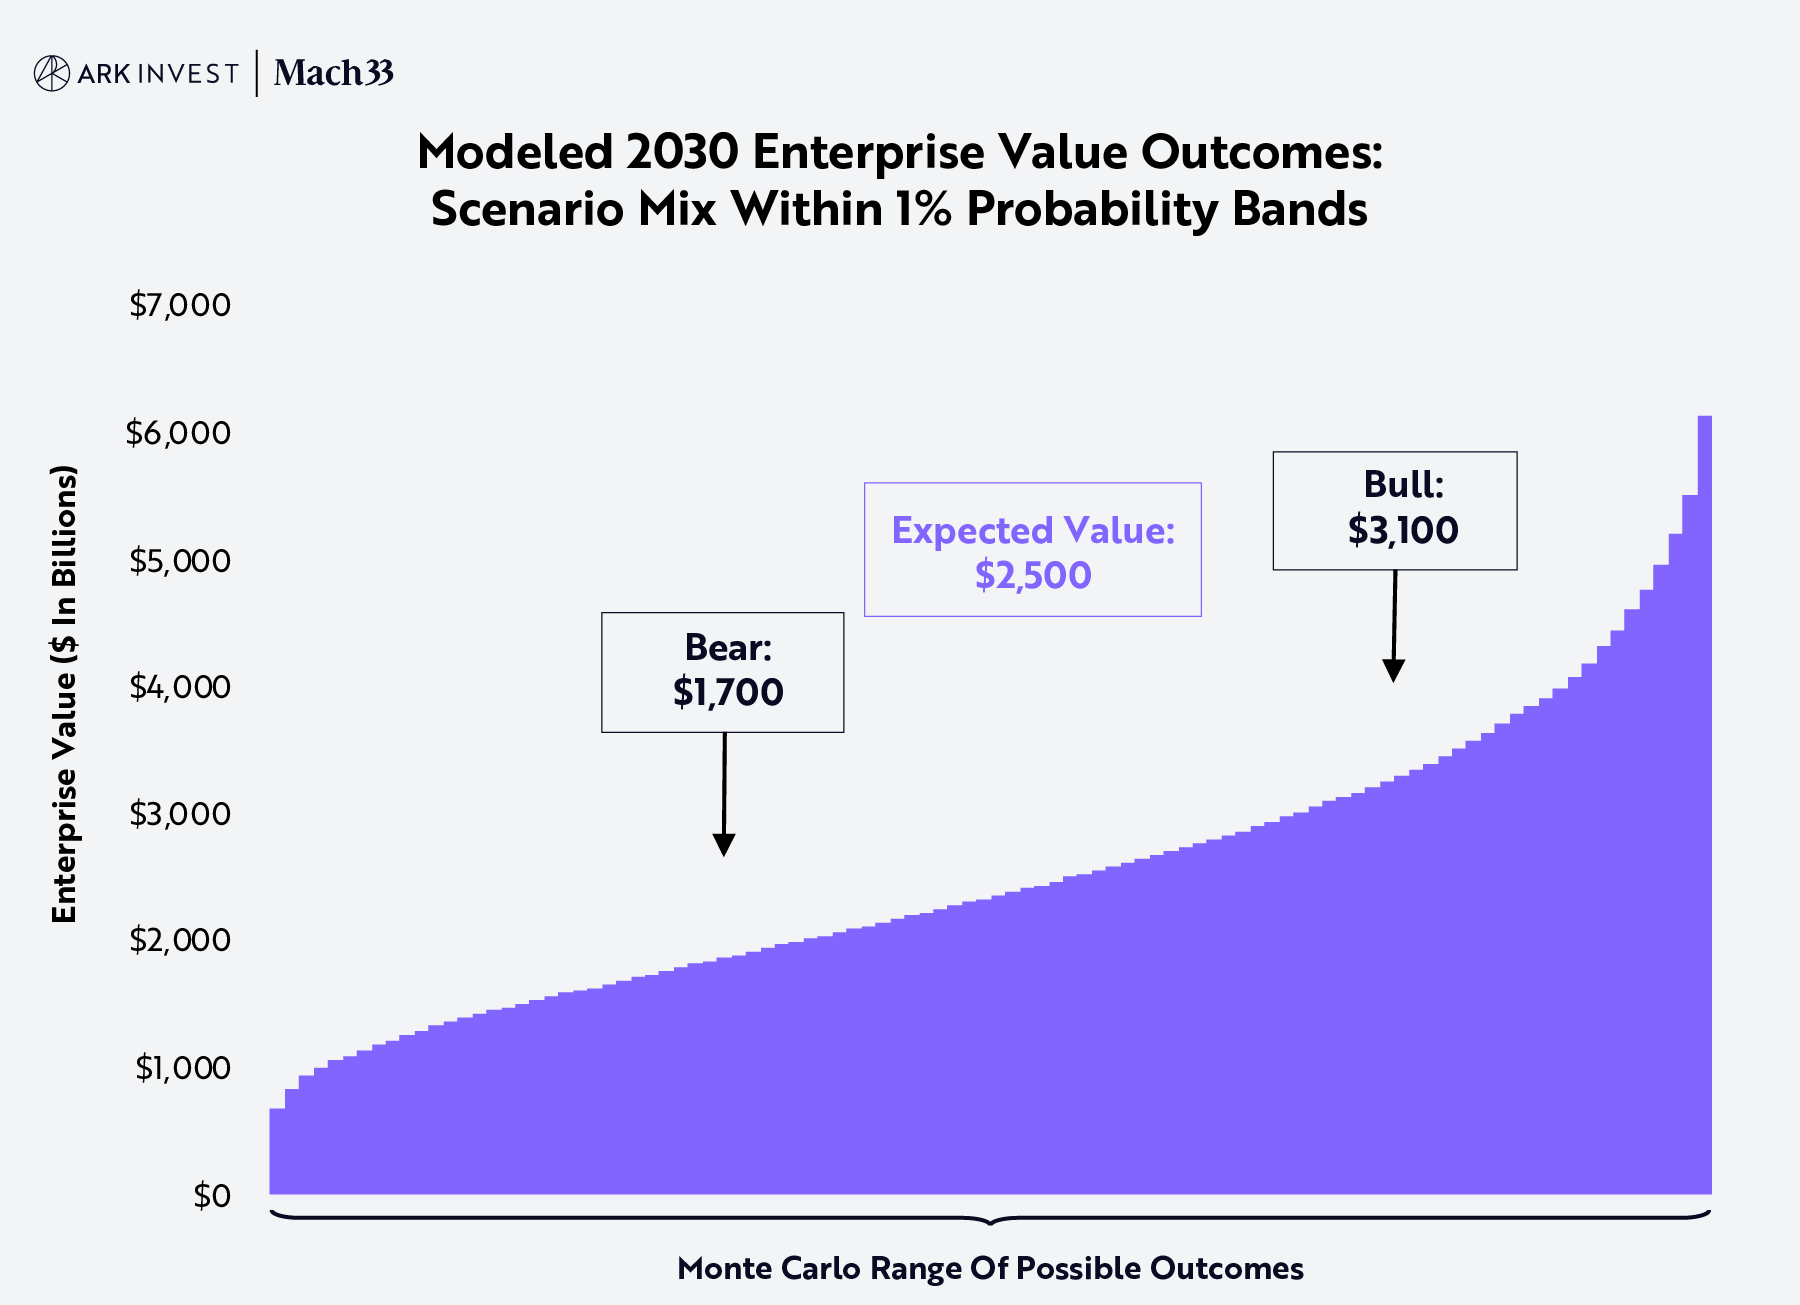
Developed in collaboration with Mach33, ARK’s open-source SpaceX model yields an expected enterprise value in 2030 of ~$2.5 trillion, generating a ~38% compound annual rate of return from its last funding round at $350 billion in December 2024.1 Tuned to the 75th and 25th percentile Monte Carlo outcomes, our bull and bear cases are ~$3.1 trillion and ~$1.7 trillion, respectively, as shown below.
| Simulation Outputs | 2030 Price Estimate (Enterprise Value) | Significance |
| Base (Expected Value) | ~$2.5 Trillion | This estimate is our expected enterprise value for SpaceX in 2030, based on our Monte Carlo analysis. |
| Bear | ~$1.7 Trillion | In this analysis, the probability that SpaceX’s enterprise value will be ~$1.7 trillion or less in 2030 is 25%. |
| Bull | ~$3.1 Trillion | In this analysis, the probability that SpaceX’s enterprise value will be ~$3.1 trillion or more in 2030 is 25%. |
Source: ARK Investment Management LLC, 2025. For the benefit of readers, this article presents “expected” (or “base”), “bear,” and “bull” cases as a way of contextualizing the meaning of our 2030 valuation expectations. Methodologically, we arrive at our base-case valuation by averaging one million simulations produced by our Monte Carlo model. Our bear and bull cases are the 25th and 75th percentile values, respectively. Forecasts are inherently limited and cannot be relied upon as a basis for making an investment decision and are built on our modeling that reflects our biases and long-term positive view of the company. Please see additional disclosures on forecasts at the end of the document. For informational purposes only and should not be considered investment advice, or a recommendation to buy, sell or hold any particular security.
Our open-source model includes 17 key independent inputs to simulate a range of potential outcomes for SpaceX, including Mars, and its enterprise value in both 2030 and 2040, as shown below. For dynamic visualizations, please refer to Mach33’s blog, available here.
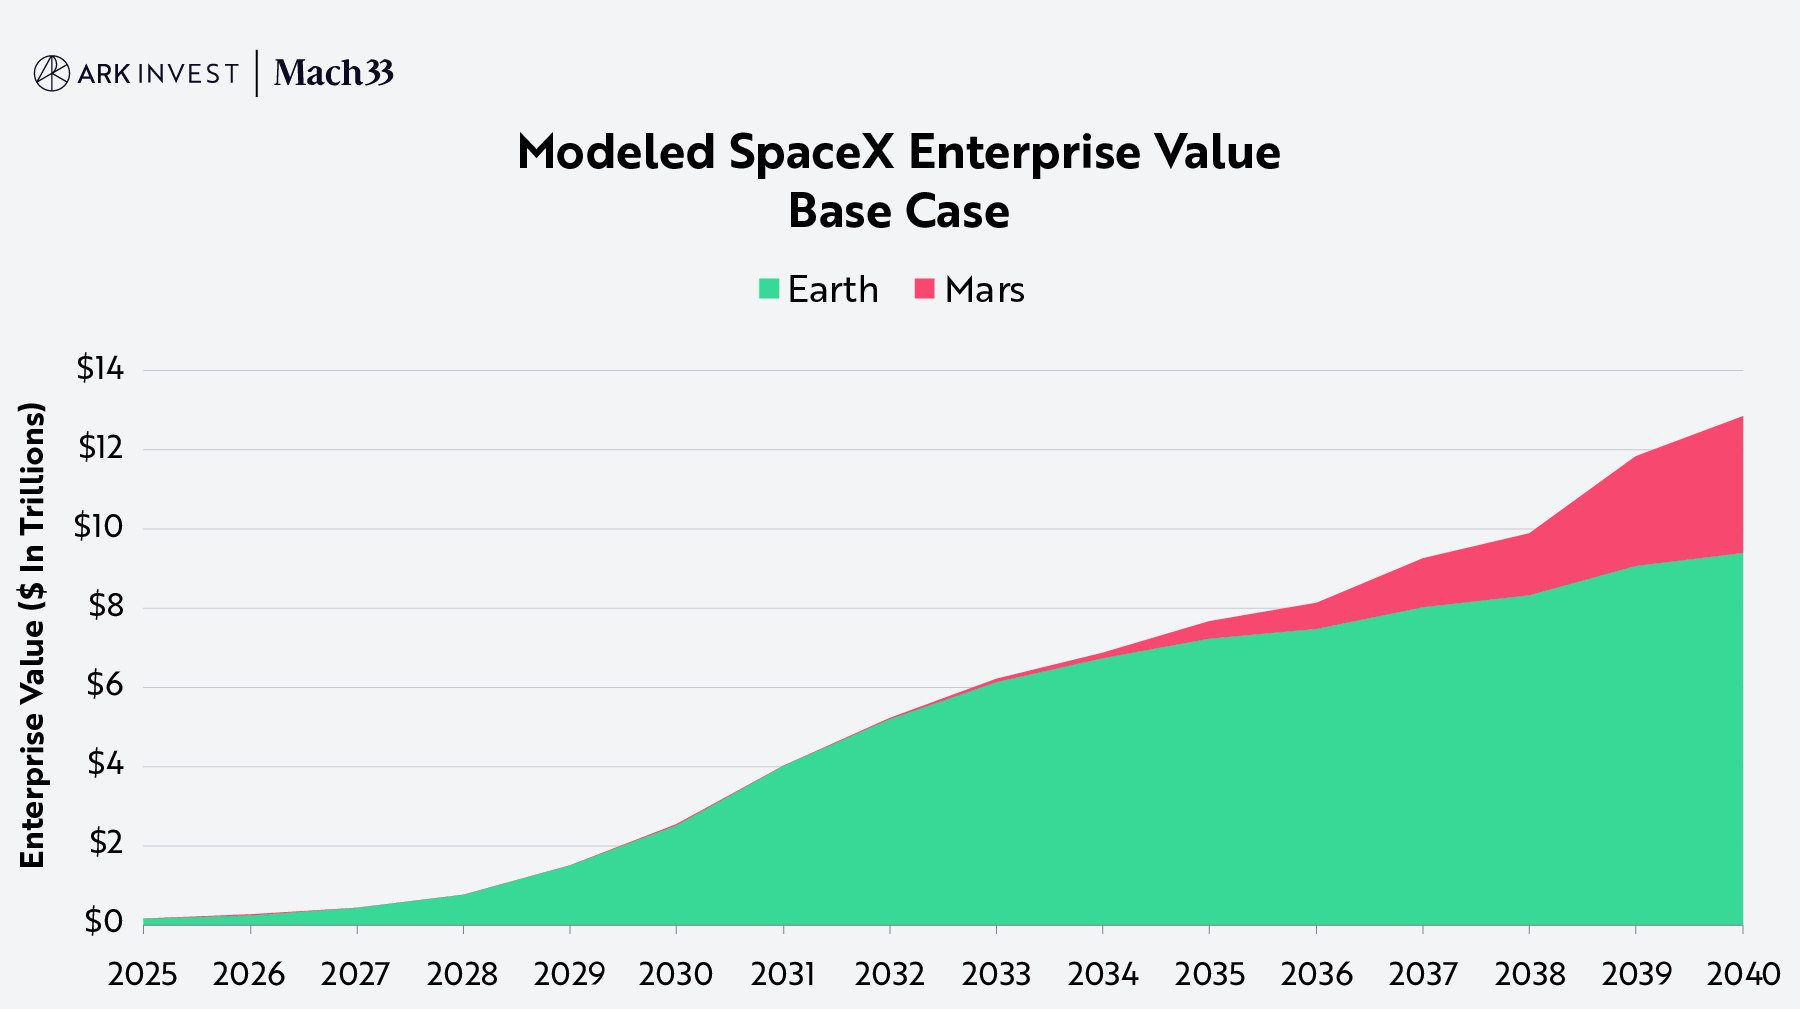
Note: Earth enterprise value (EV) is calculated as our forecasted EBITDA2 multiplied by an 18x EBITDA-to-EV multiple,3 consistent with the industry average for aerospace and defense companies per Stern. Mars enterprise value reflects the accumulated cash designated for Mars development plus the book value assigned to SpaceX for infrastructure built on Mars. Source: ARK Investment Management LLC and Mach33, 2025. This analysis draws on a range of external data sources as of May 29, 2025, which may be provided upon request. For informational purposes only and should not be considered investment advice or a recommendation to buy, sell, or hold any particular security. Forecasts are inherently limited and cannot be relied upon as a basis for making an investment decision and are built on our modeling that reflects our biases and long-term positive view of the company.
Source: ARK Investment Management LLC and Mach33, 2025. This analysis draws on a range of external data sources as of May 29, 2025, which may be provided upon request. For informational purposes only and should not be considered investment advice or a recommendation to buy, sell, or hold any particular security. Forecasts are inherently limited and cannot be relied upon as a basis for making an investment decision and are built on our modeling that reflects our biases and long-term positive view of the company.
We present the details of our model in the following seven sections:
- Model Logic
- Total Addressable Market (TAM) And Unit Economics
- Satellite Performance
- Starship And Wright’s Law
- Mars Game Plan
- Risks And Limitations Of The Model And Our Assumptions
- Conclusion
Model Logic
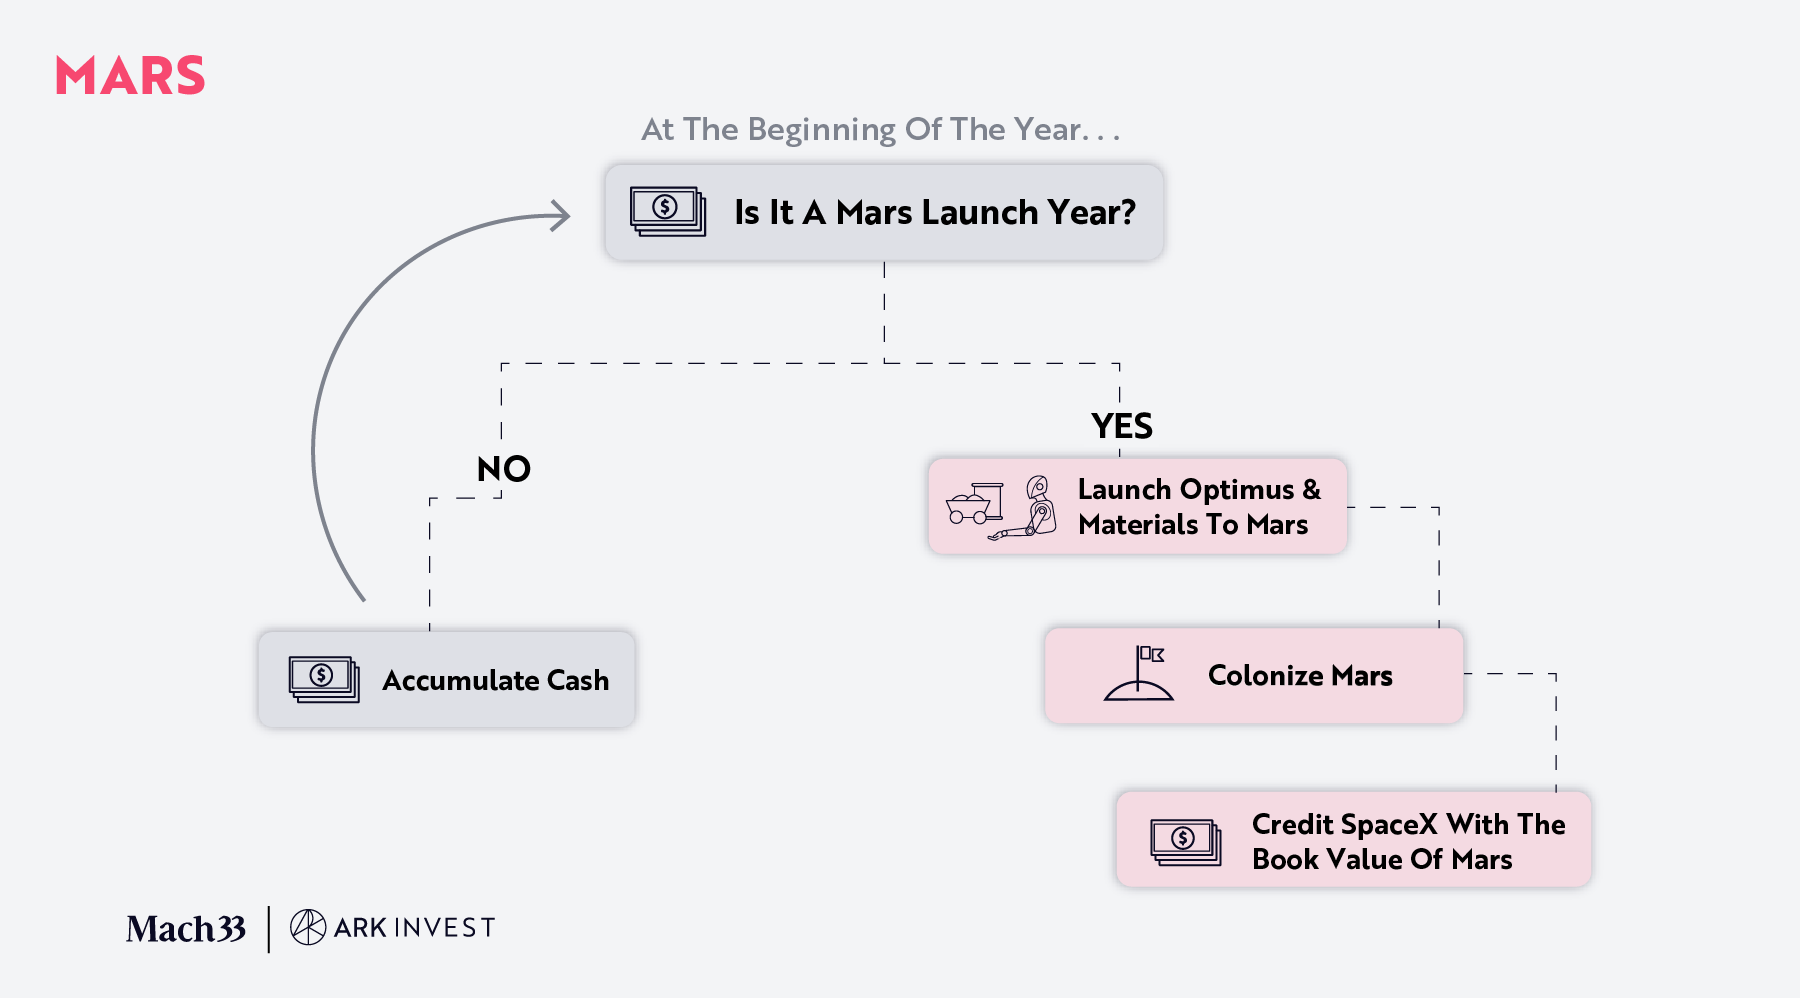
Analytically, the model works like a flywheel with self-reinforcing momentum, as shown in the two charts below: Beginning with cash, SpaceX builds rockets and satellites, creates orbital bandwidth, acquires Starlink customers, and reinvests the resulting cash. As the cycle continues, funds flow gradually toward the development of Mars, until the Starlink constellation is complete.
.png)
Source: ARK Investment Management LLC and Mach33, 2025. For illustrative purposes only. Forecasts are inherently limited and cannot be relied upon as a basis for making an investment decision and are built on our modeling that reflects our biases and long-term positive view of the company.
When the Starlink constellation is complete, we assume that SpaceX sustains the constellation and then ramps up its investment in Mars. Each Mars-bound rocket carries a combination of Optimus humanoid robots and materials. Assuming Optimus productivity improves and costs decline over time, SpaceX builds its Mars “book value,” as shown below.
Source: ARK Investment Management LLC and Mach33, 2025. For illustrative purposes only. Forecasts are inherently limited and cannot be relied upon as a basis for making an investment decision and are built on our modeling that reflects our biases and long-term positive view of the company.
Total Addressable Market (TAM) And Unit Economics
Our top-down open-source Satellite Broadband Revenue Demand model, available here, allocates SpaceX’s revenue based on the available bandwidth, the addressable population, and the acceptable price and speed of broadband in each country. On average, the Monte Carlo simulation suggests that its bandwidth plateaus at ~130 million gigabits per second (Gbps), beyond which additional gigabits are uneconomic. The crossover point occurs at ~$0.20 per megabit per second (Mbps) per month, which is ~75% below the US average today,4 also shown below.
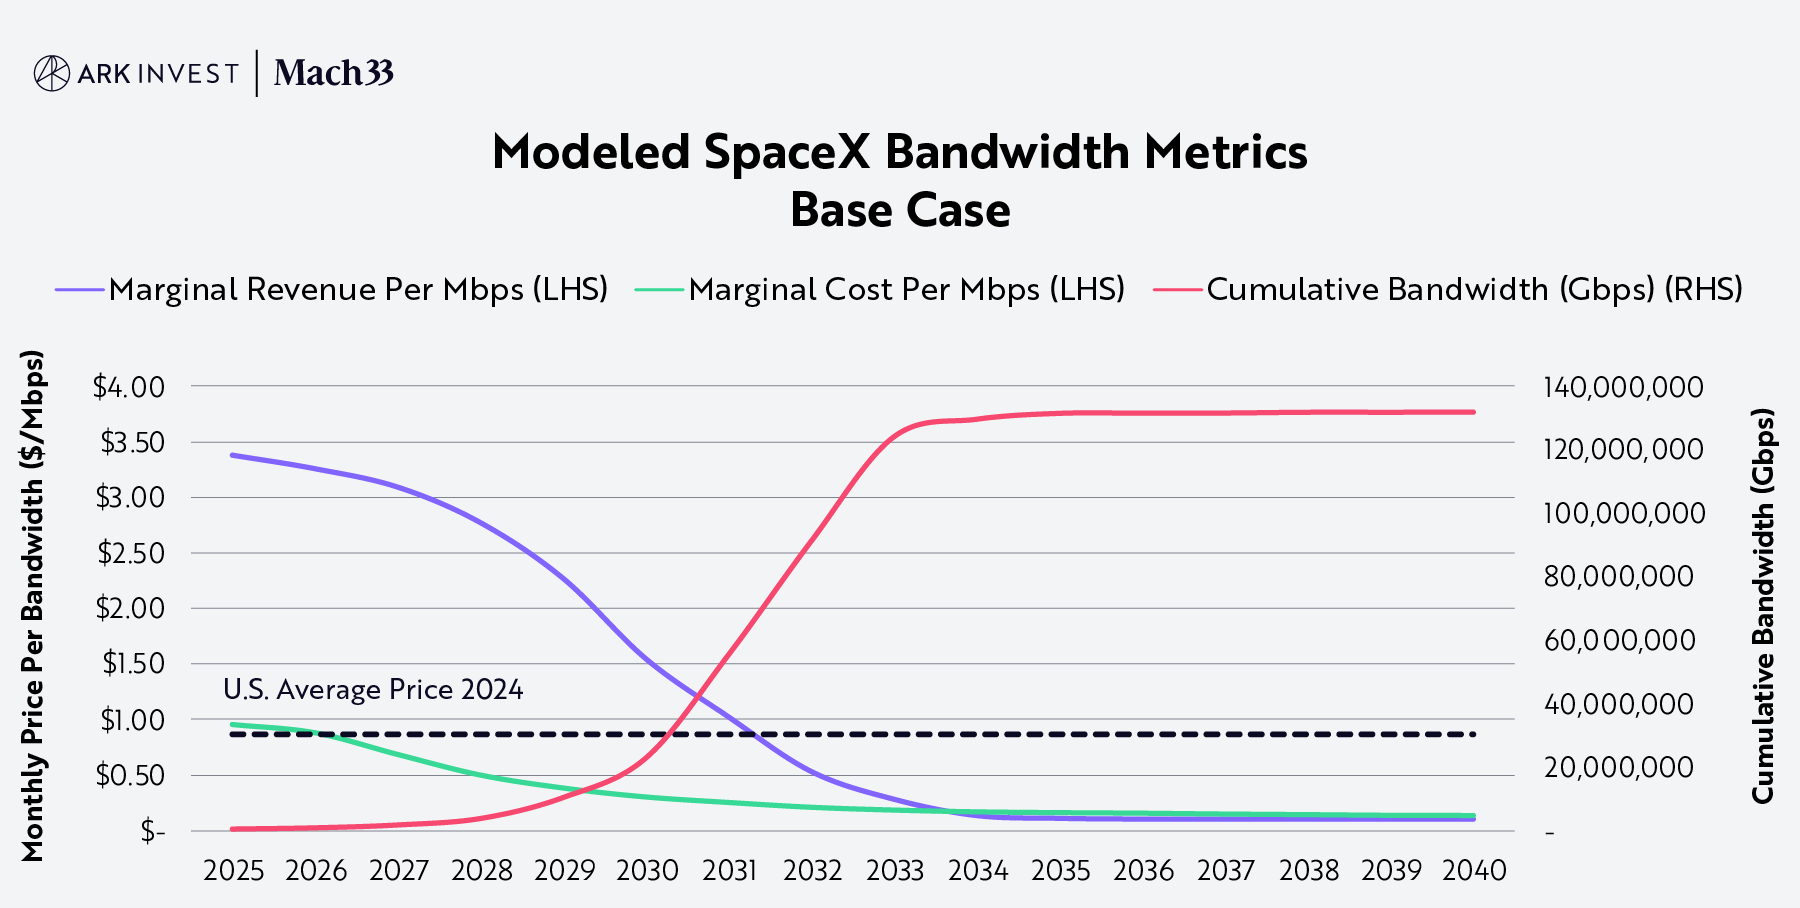
Note: The US average price is provided for context, the marginal revenue per Mbps per month (purple line), is a global number leveraging our top-down model. Source: ARK Investment Management LLC and Mach33, 2025. This analysis draws on a range of external data sources as of May 29, 2025, which may be provided upon request. For informational purposes only and should not be considered investment advice or a recommendation to buy, sell, or hold any particular security. Forecasts are inherently limited and cannot be relied upon as a basis for making an investment decision and are built on our modeling that reflects our biases and long-term positive view of the company.
Once it completes Starlink’s constellation—in ~2035, according to our base case—ARK’s research suggests that SpaceX could generate ~$300 billion in annual revenue, accounting for ~15% of total spending on global communications, as shown below.
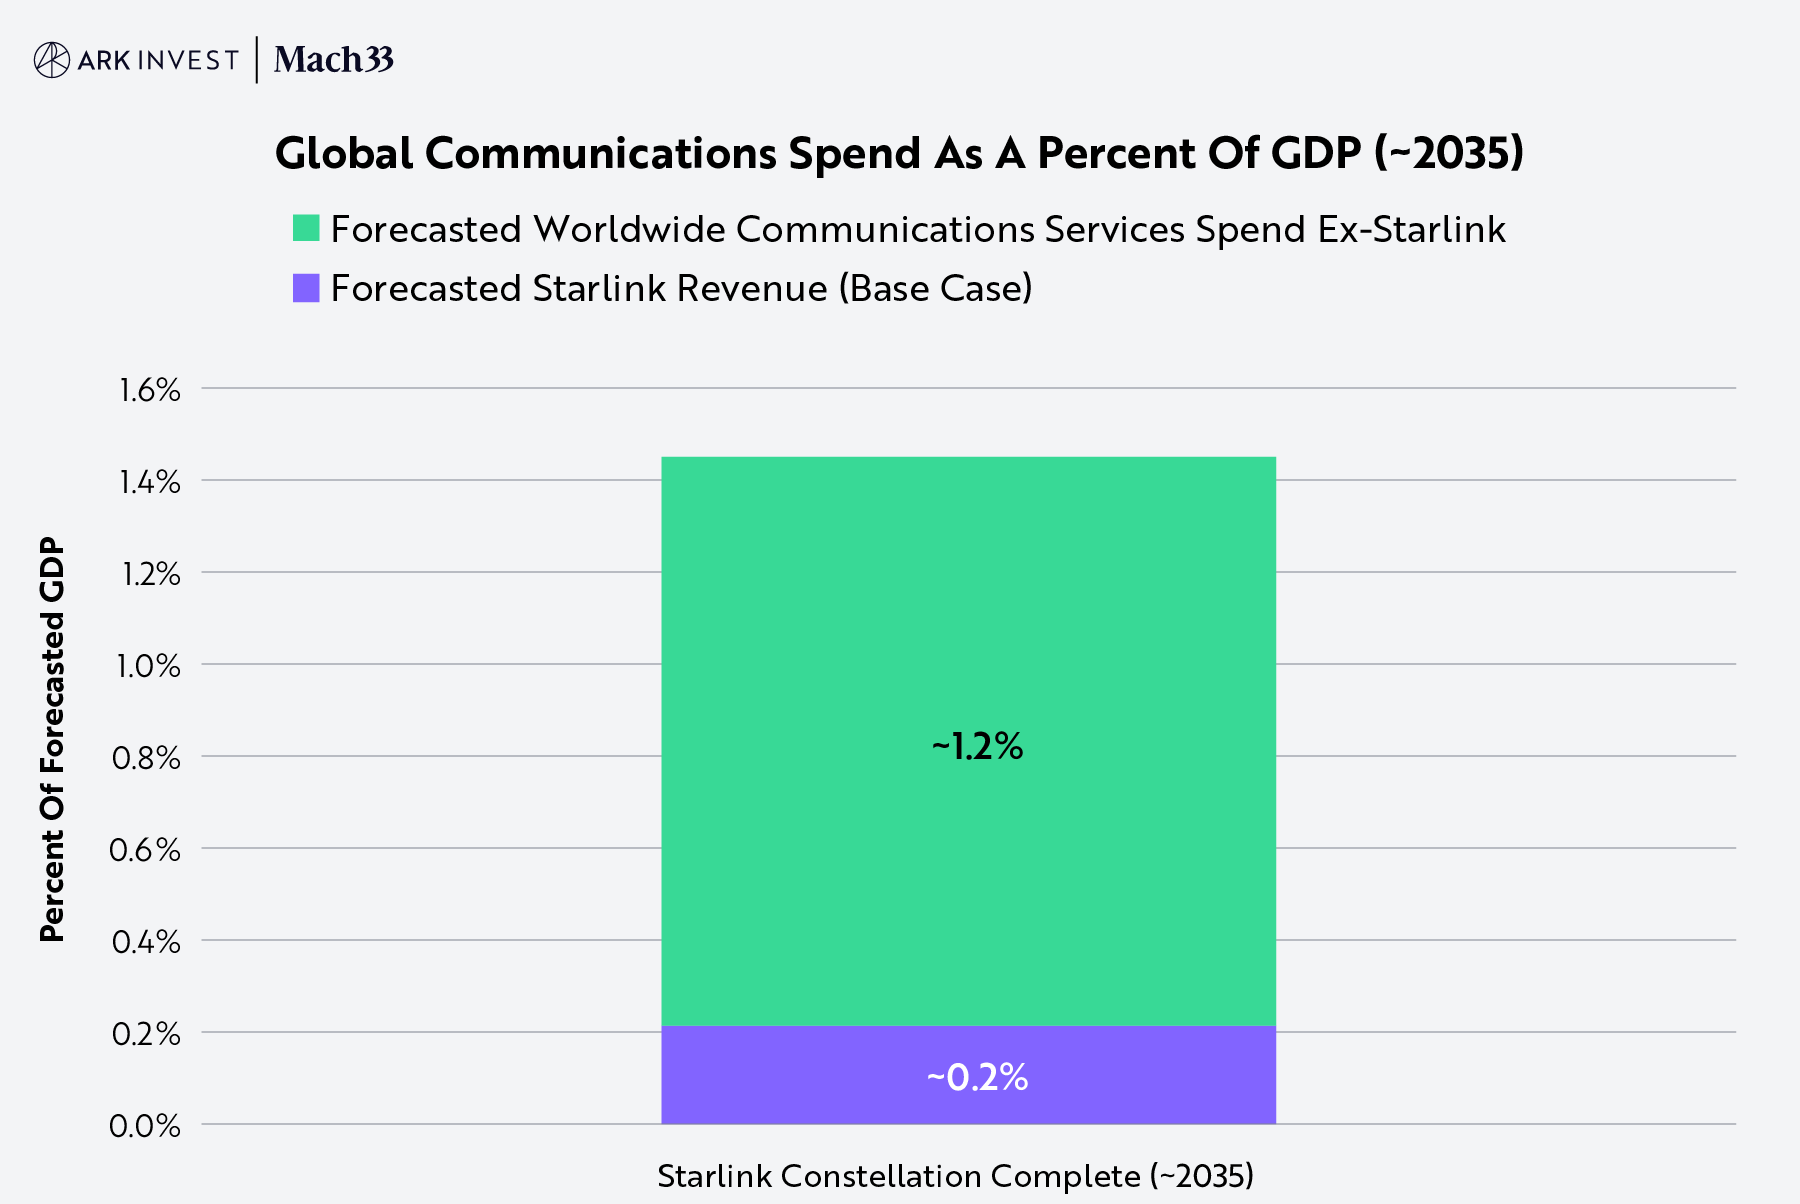
Source: ARK Investment Management LLC and Mach33, 2025, based on data from the World Bank and Gartner as of May 29, 2025.5 For informational purposes only and should not be considered investment advice or a recommendation to buy, sell, or hold any particular security. Forecasts are inherently limited and cannot be relied upon as a basis for making an investment decision and are built on our modeling that reflects our biases and long-term positive view of the company.
A closer look at marginal costs in the Monte Carlo simulation reveals that, as the reusability of Starship improves, the satellites’ share of total marginal cost increases from ~30% to ~90% over time, as shown below.
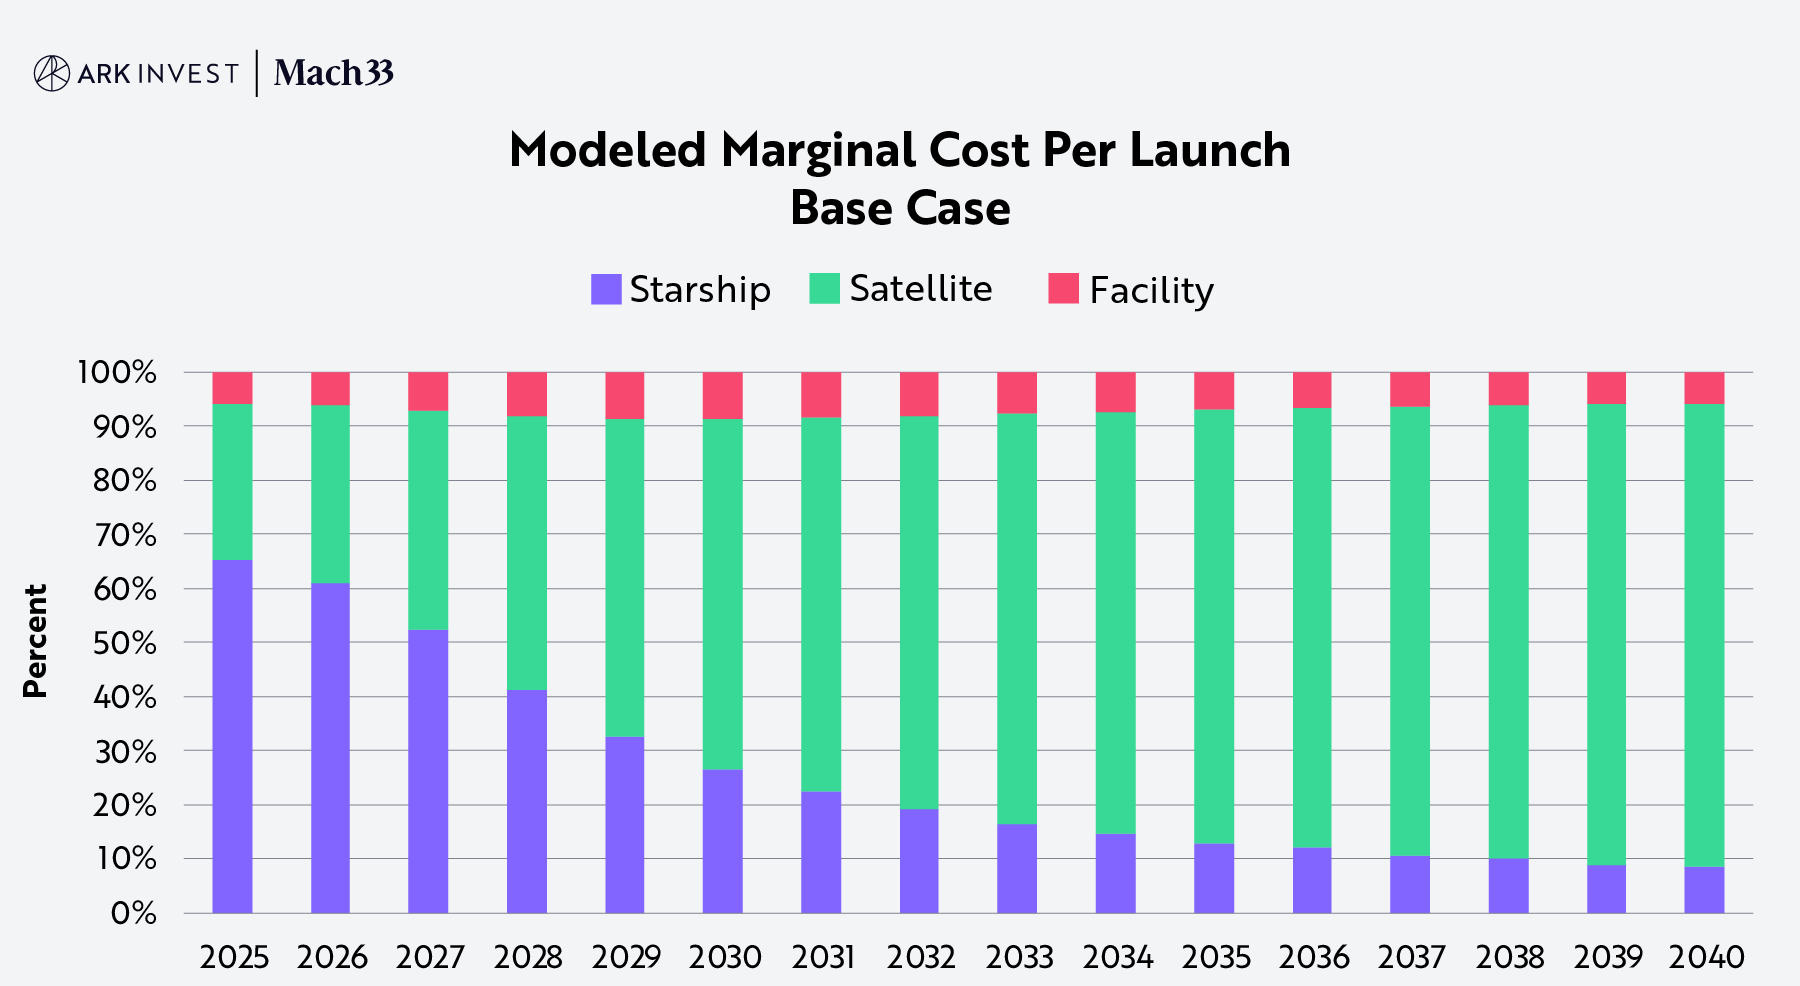
Source: ARK Investment Management LLC and Mach33, 2025. This analysis draws on a range of external data sources as of May 29, 2025, which may be provided upon request. For informational purposes only and should not be considered investment advice or a recommendation to buy, sell, or hold any particular security. Forecasts are inherently limited and cannot be relied upon as a basis for making an investment decision and are built on our modeling that reflects our biases and long-term positive view of the company.
Consequently, satellite performance as measured by Gbps/kg becomes the most sensitive input in the model, influencing both revenue generation and capital expenditures. Satellite performance also is critical to both the efficiency and cost of bandwidth deployment, and key to the speed at which SpaceX completes the Starlink constellation and shifts its capital priority toward goals for Mars.
Satellite Performance
From V1 to V2 Mini Optimized, Starlink’s satellite performance has followed a Wright’s Law6 learning curve. SpaceX has published a Federal Communications Commission (FCC) filing7 for its next-generation satellite with a mass of ~2,000kg and, in a separate disclosure for future satellites, 1Tbps in bandwidth.8 If those specifications were to apply to the same satellite, the leap in performance would be massive, as shown by the red and yellow points in the chart below. Our research suggests, however, that the two disclosures refer to different satellites. If so, the 1Tbps satellite would align with Wright’s Law, as shown by the green dot in the chart below.
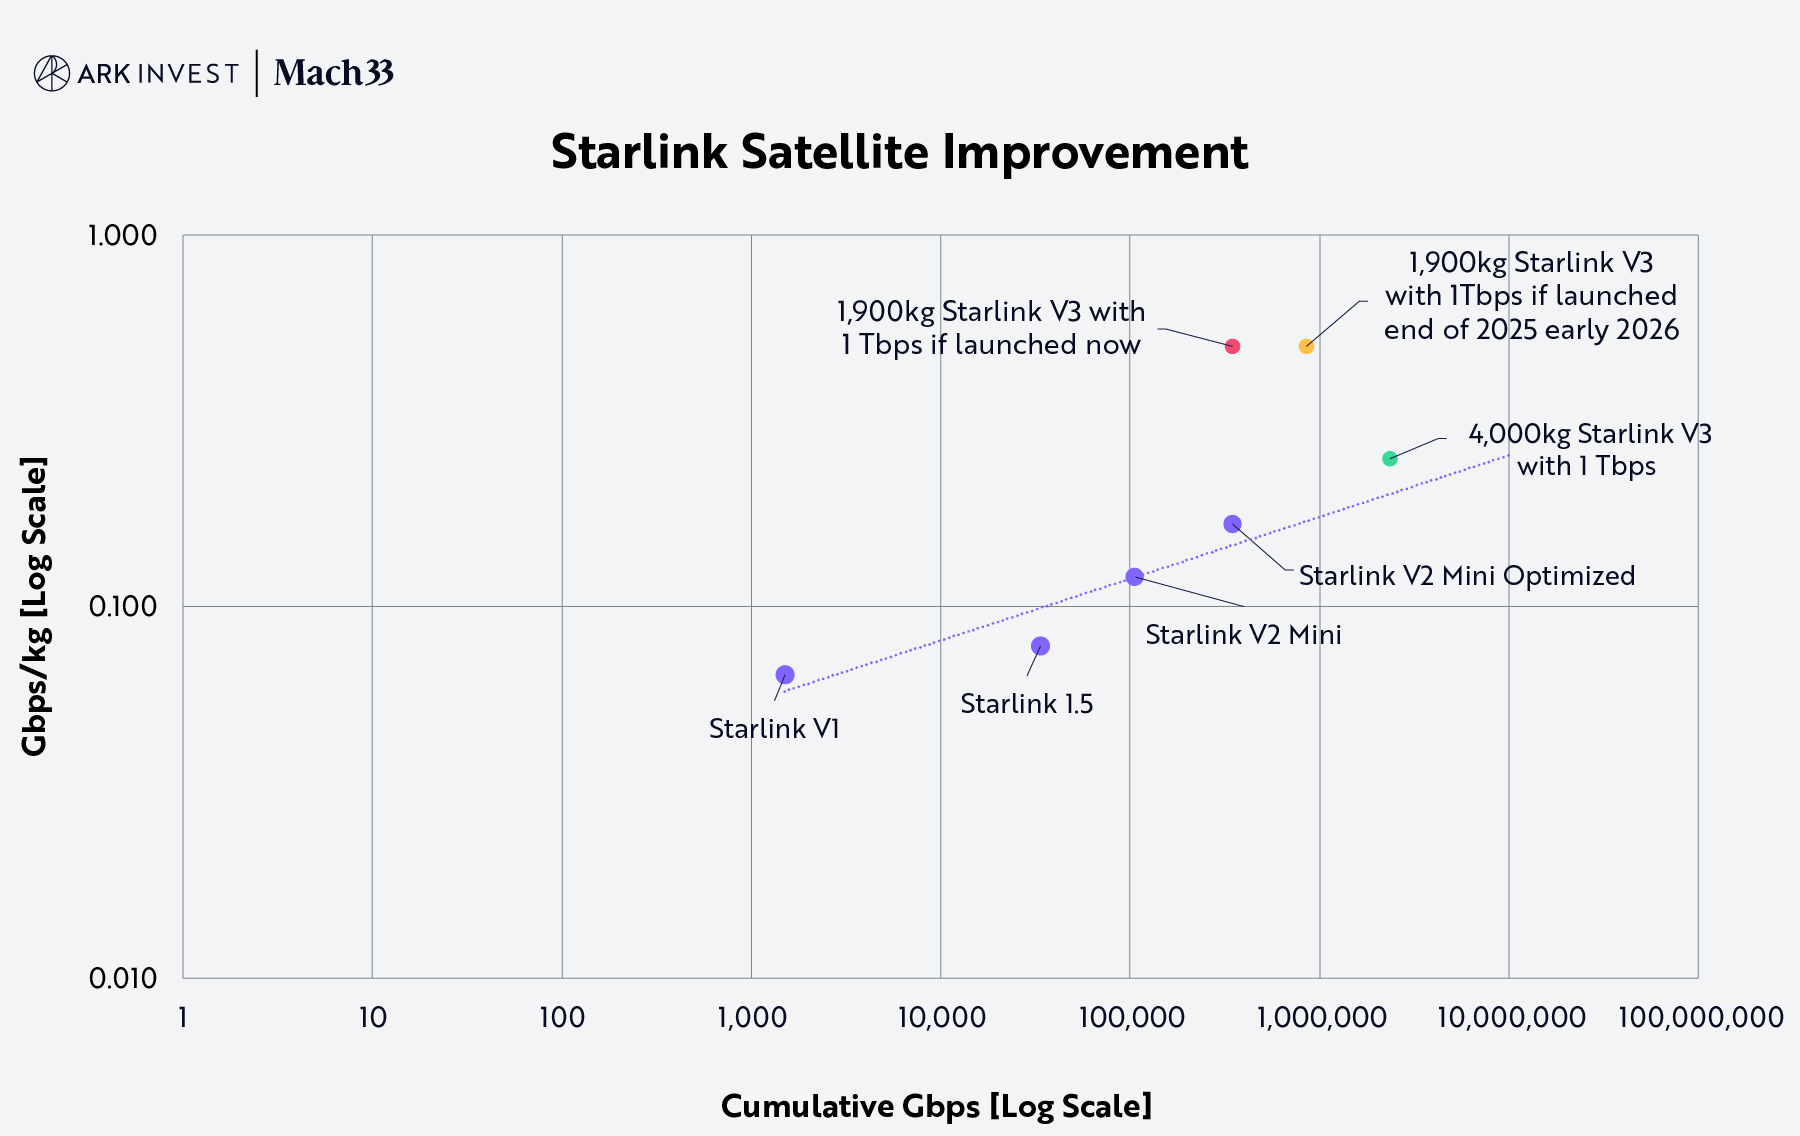
Source: ARK Investment Management LLC, 2025, based on data from SpaceX as of May 29, 2025.9 For informational purposes only and should not be considered investment advice or a recommendation to buy, sell, or hold any particular security. Forecasts are inherently limited and cannot be relied upon.
Starship And Wright's Law
Starship is central to multiplanetary life. Despite high upfront capital costs, Starship’s turnaround time and reusability are critical to its operational impact. As Starship becomes increasingly reusable, fewer vehicles and more frequent launch cycles should deliver the same upmass. Based on Falcon 9 data, Wright’s Law suggests that, for every cumulative doubling of the upmass to orbit, Starship’s turnaround time will decline at a constant ~27% rate, as shown below.
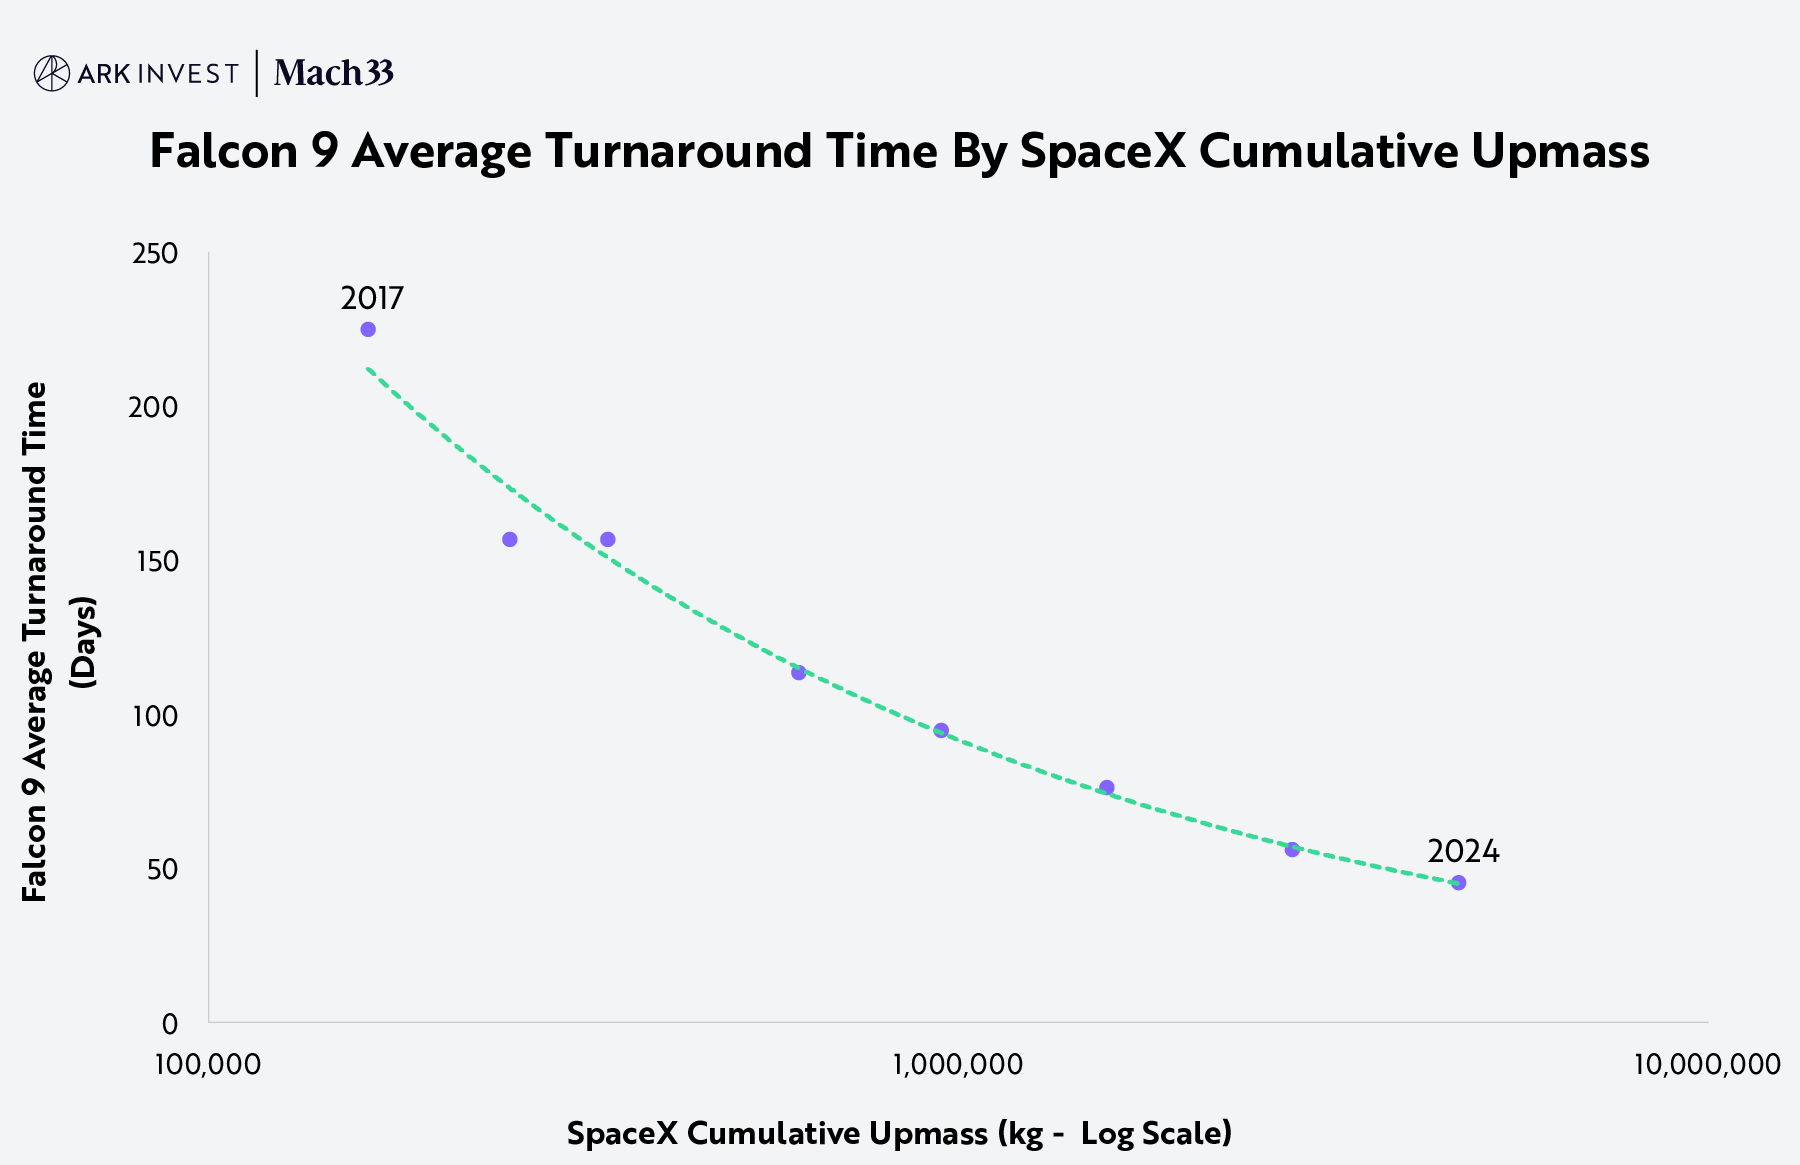
Source: ARK Investment Management LLC, 2025, based on data from SpaceX as of May 29, 2025. For informational purposes only and should not be considered investment advice or a recommendation to buy, sell, or hold any particular security.
In our view, minimizing its rocket turnaround time and increasing its reusability will be essential to sustaining the economic viability of SpaceX’s constellation and advancing its ambitions for Mars. Accordingly, our model shows rocket reusability improving in tandem with cumulative upmass, as shown below.
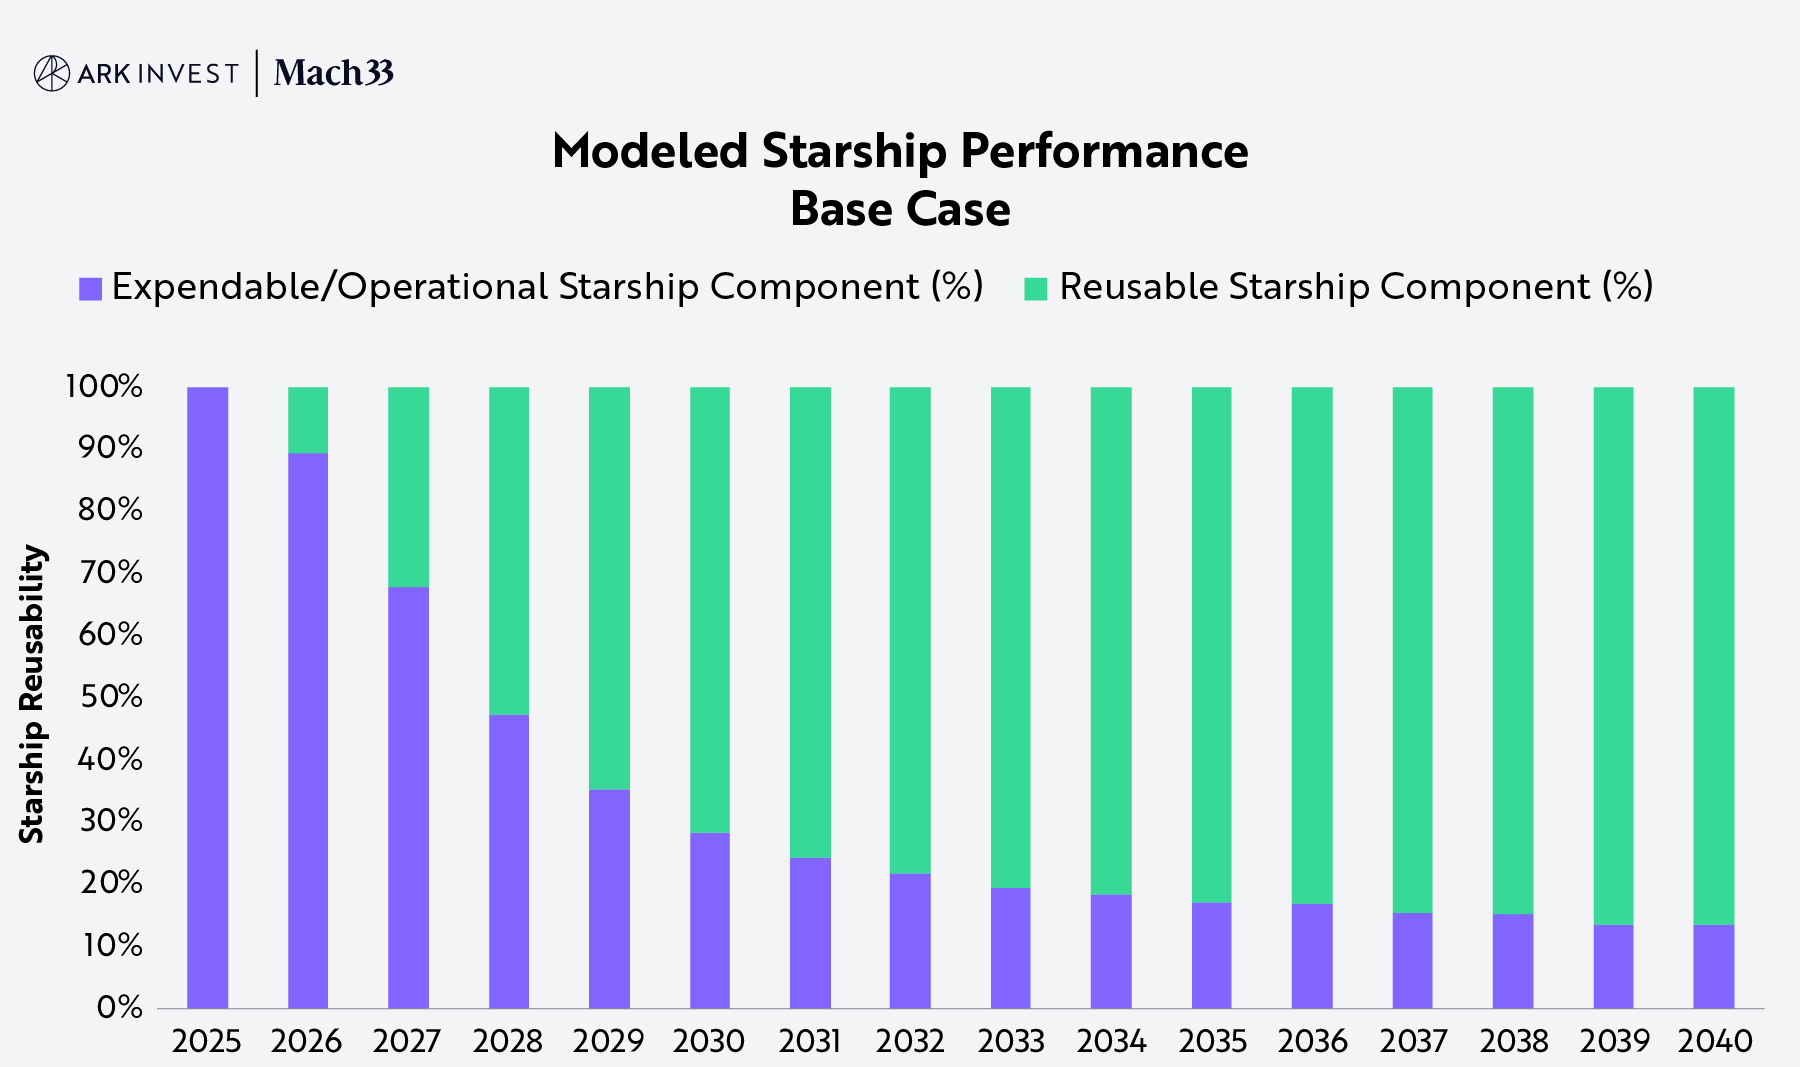
Note: As modeled, the reusable starship component will never be 100%, even if rapid reusability is achieved, as there will always be variable costs associated with a launch, e.g. fuel. Source: ARK Investment Management LLC and Mach33, 2025. This analysis draws on a range of external data sources as of May 29, 2025, which may be provided upon request. For informational purposes only and should not be considered investment advice or a recommendation to buy, sell, or hold any particular security. Forecasts are inherently limited and cannot be relied upon as a basis for making an investment decision and are built on our modeling that reflects our biases and long-term positive view of the company.
Mars Game Plan
Musk founded SpaceX with the goal of making life multiplanetary, specifically enabling humans to occupy Mars with the help of his other companies.10 In our view, Elon has been engineering Optimus robots and Boring Company machines to build infrastructure for challenging extraterrestrial environments to support the colonization of Mars.11
According to our research, Mars will account for a growing portion of SpaceX’s enterprise value over time, as shown below. That said, while the capital improvements associated with Mars will accrue to SpaceX’s balance sheet, the related cash flow will be much more speculative than that associated with Starlink.
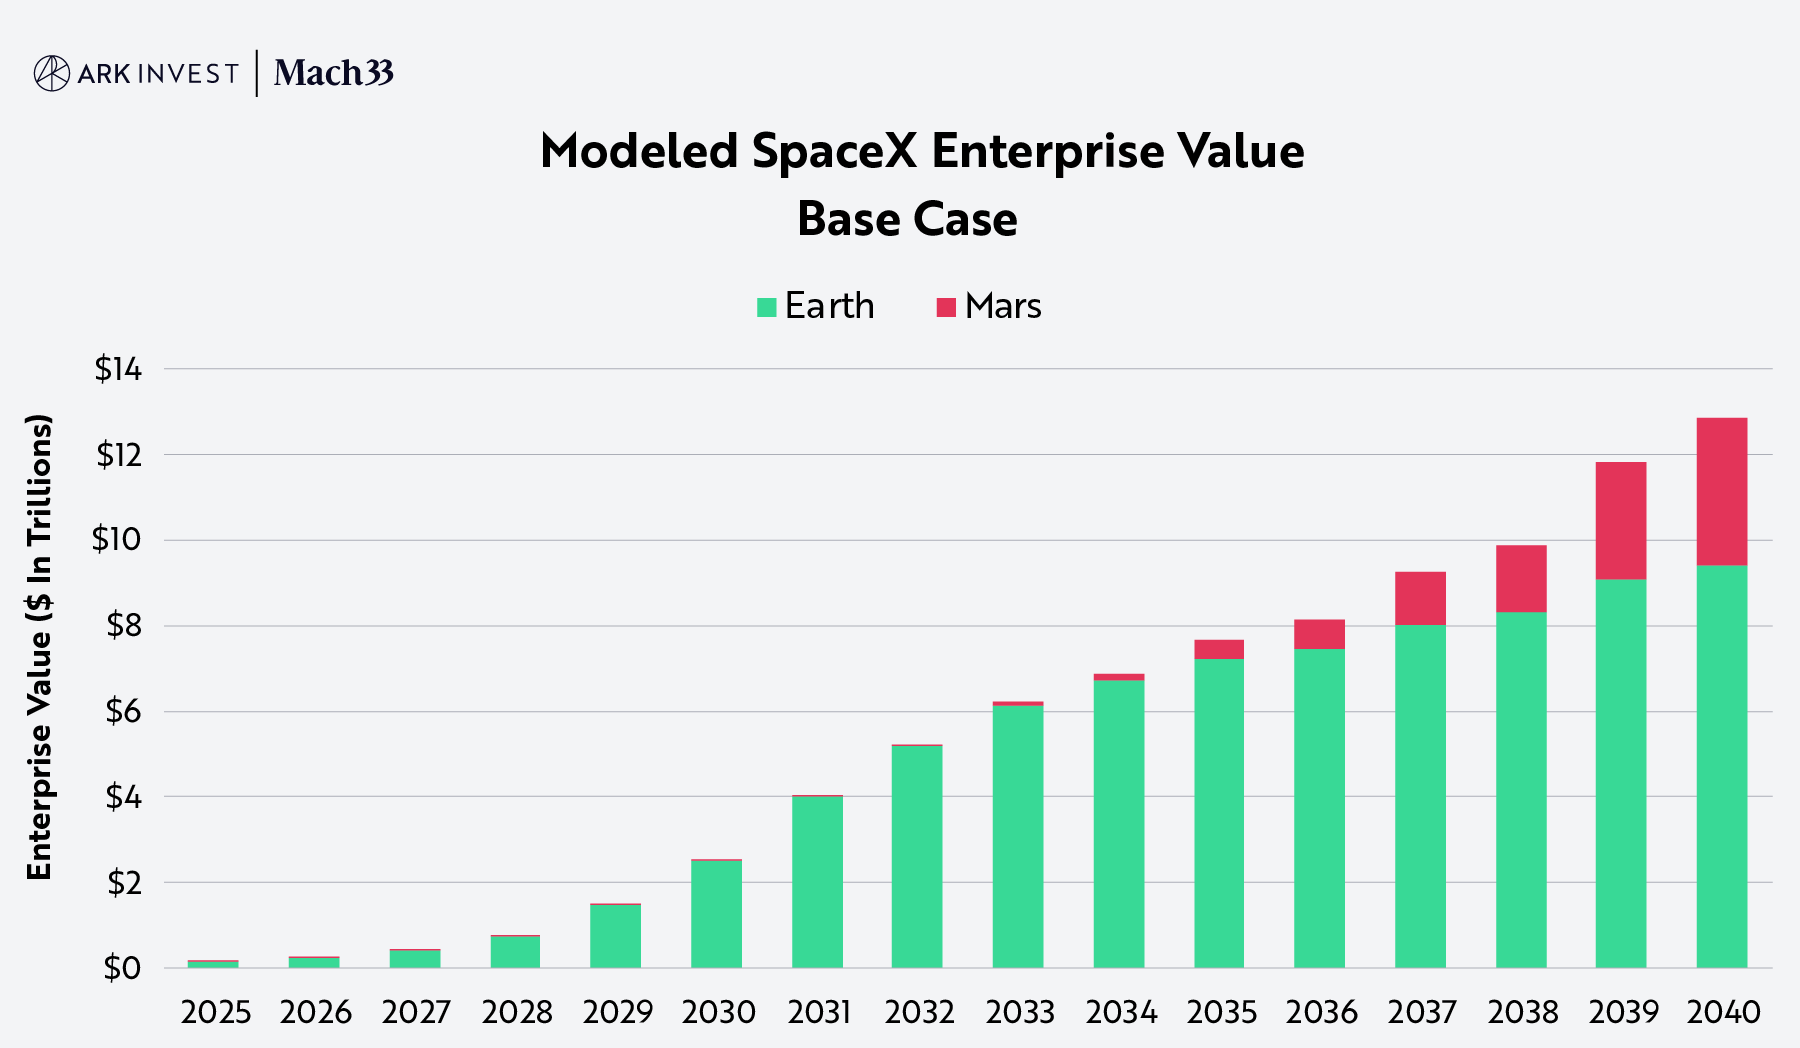
Source: ARK Investment Management LLC and Mach33, 2025. This analysis draws on a range of external data sources as of May 29, 2025, which may be provided upon request. For informational purposes only and should not be considered investment advice or a recommendation to buy, sell, or hold any particular security. Forecasts are inherently limited and cannot be relied upon as a basis for making an investment decision and are built on our modeling that reflects our biases and long-term positive view of the company.
Accordingly, our model assumes that SpaceX will devote only a small portion of its budget to Mars until the Starlink constellation is complete. Once it achieves that milestone, SpaceX is likely to shift its Starlink resources to Mars, as shown below. Given the scale and long-term goal of colonizing Mars, investors are unlikely to earn much of a return on capital for a significant period of time. While activities on Mars could lower the costs of servicing the satellite market on earth and pave the way for mining asteroids, those opportunities are beyond the scope of this forecast.
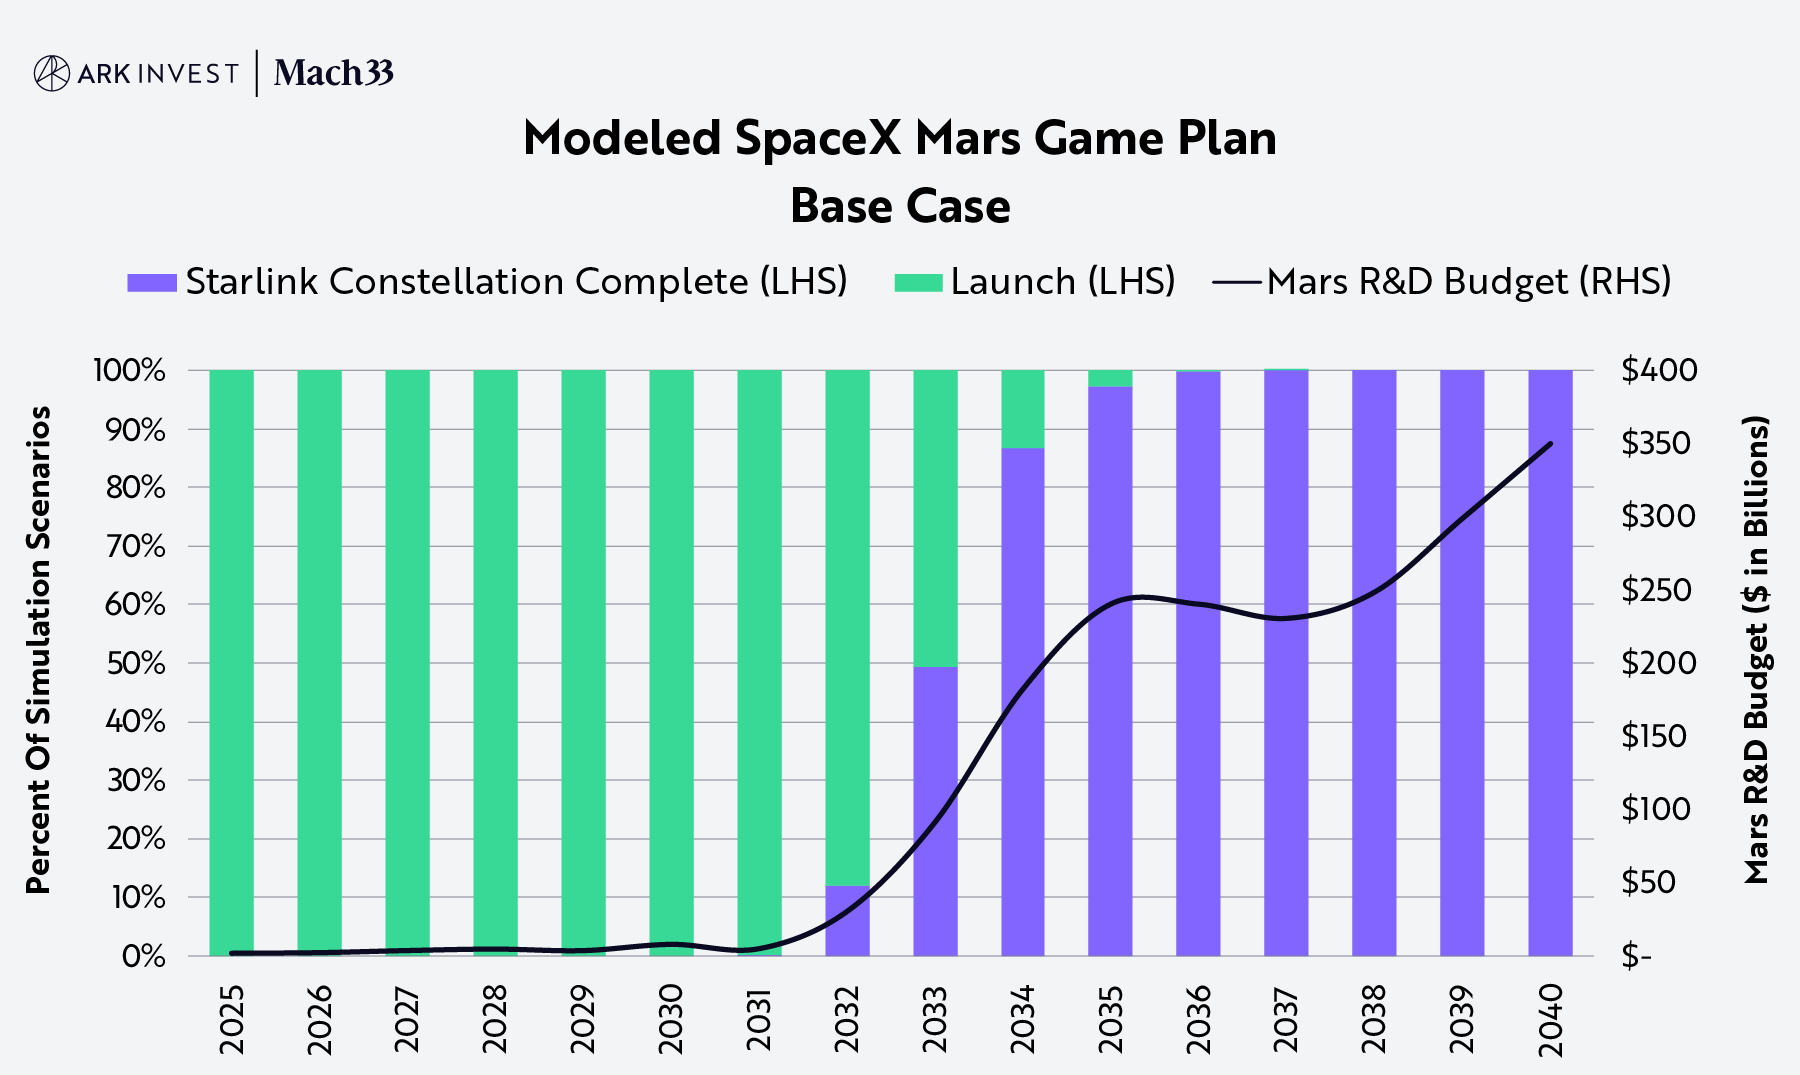
Source: ARK Investment Management LLC and Mach33, 2025. This analysis draws on a range of external data sources as of May 29, 2025, which may be provided upon request. For informational purposes only and should not be considered investment advice or a recommendation to buy, sell, or hold any particular security. Forecasts are inherently limited and cannot be relied upon as a basis for making an investment decision and are built on our modeling that reflects our biases and long-term positive view of the company.
Our Monte Carlo simulation assumes that Starships will incorporate a mix of Mars-adapted Optimus Robots (Optimi), the fleet growing to millions over time, as shown below. As modeled, the Optimi will build the infrastructure to support a permanent colony, their productivity improving over time. The payload to support early human habitation could be quite complex. Our collaborator, Mach33, has analyzed the potential cost of an early Mars payload, available here. In early days, human payloads on Mars are unlikely to contribute meaningfully to SpaceX’s book value.
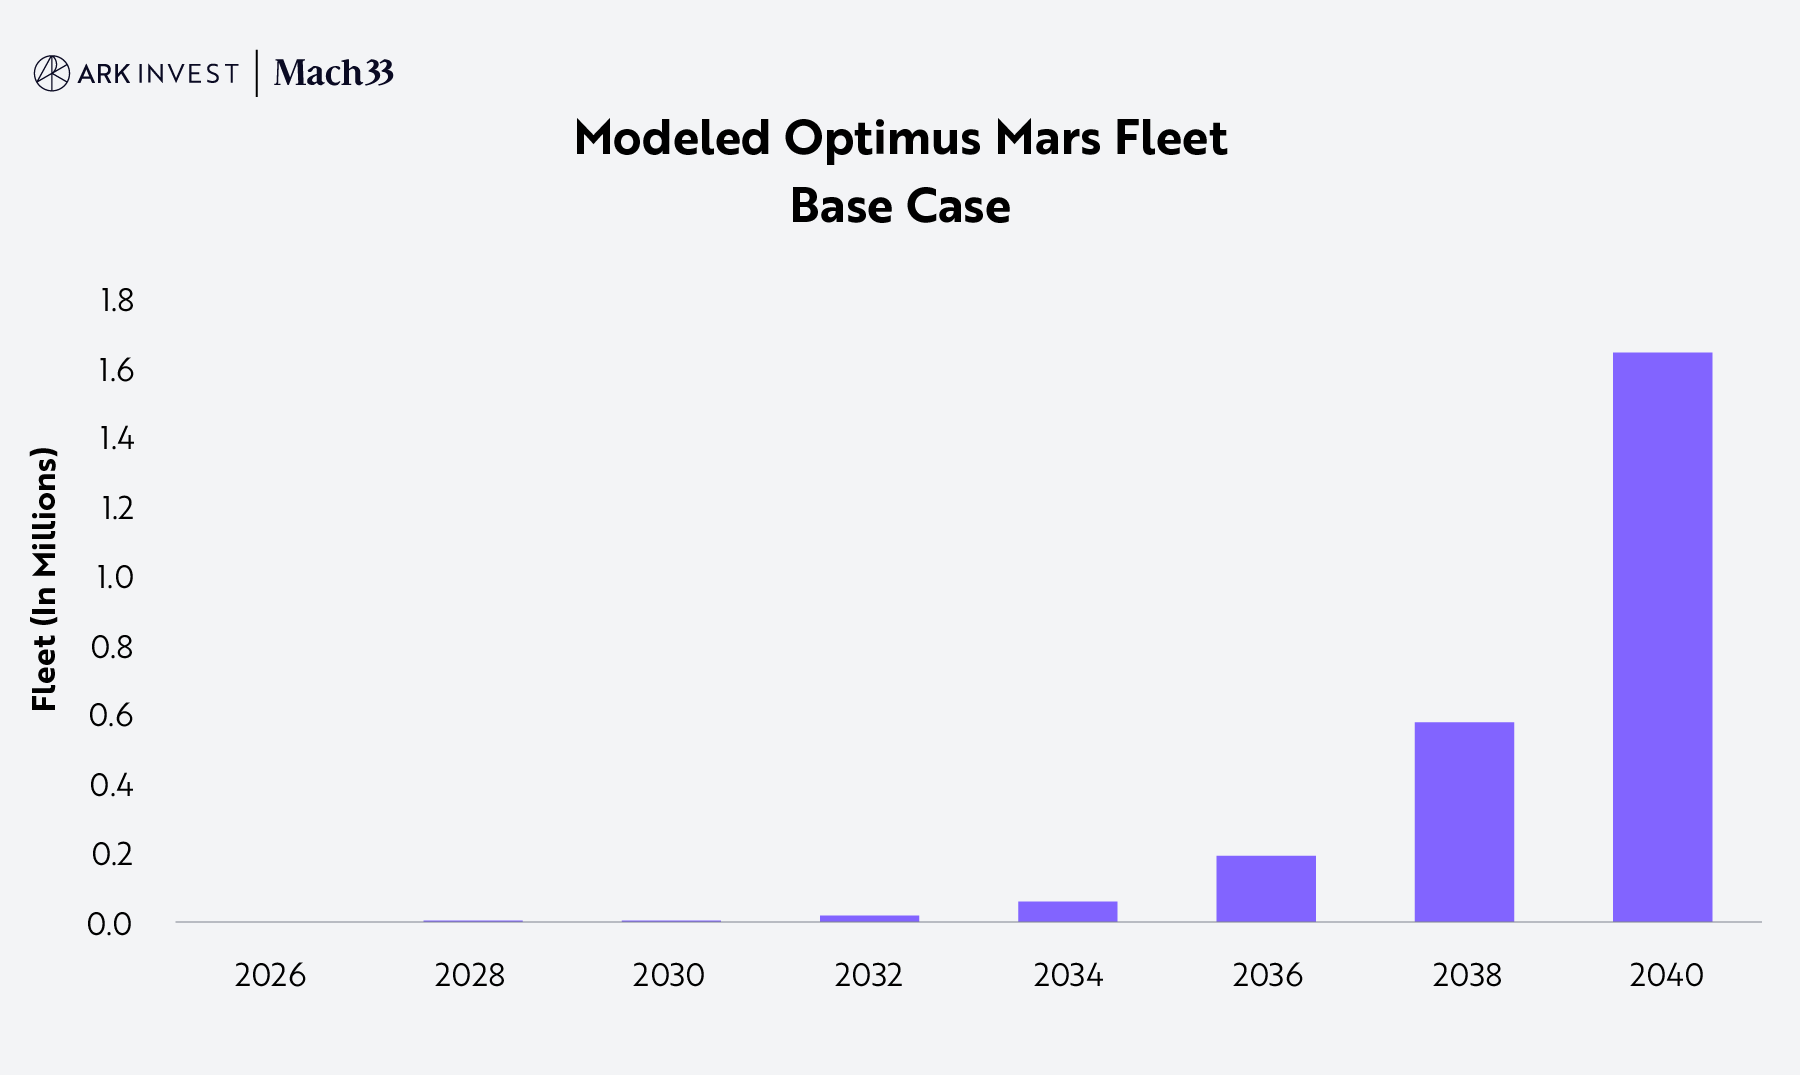
Source: ARK Investment Management LLC and Mach33, 2025. This analysis draws on a range of external data sources as of May 29, 2025, which may be provided upon request. For informational purposes only and should not be considered investment advice or a recommendation to buy, sell, or hold any particular security. Forecasts are inherently limited and cannot be relied upon as a basis for making an investment decision and are built on our modeling that reflects our biases and long-term positive view of the company.
Risks And Limitations Of The Model And Our Assumptions
ARK’s 17 key independent variables cover scenarios that we believe are plausible outcomes for SpaceX over the next several years. An unexpected event, such as Elon Musk’s sudden departure from the company, or a natural disaster or pandemic, could throw these outcomes off considerably. Moreover, space is an inherently challenging domain with significant execution risk. If Starship fails to achieve rapid reusability, it could impact the value we project for the company materially. Also, there is no guarantee that Optimus will be capable of supporting infrastructure development within the modeled timeline, and, given the timing constraints of interplanetary launch windows, delays could lead to significant schedule slippage. Finally, increased competition could reduce the total addressable market for broadband, while variability in government spending could impact revenue potential from Starshield.12
Conclusion
For 2030, our SpaceX enterprise value target is ~$2.5 trillion, ~7X above its last funding round in December 2024. Our bear and bull cases value SpaceX at ~$1.7 and ~$3.1 trillion, respectively, in 2030. Having published our simulation model on GitHub, we invite readers to explore and test our assumptions and/or create visualizations from the simulations.
Disclosure
The forecasts and price estimates herein are subject to revision by ARK Invest (“ARK”) and provided solely as a guide to current expectations. Forecasts regarding broad markets and individual issuers are not, and are not intended to be, representative of any ARK-managed investment product or the characteristics of any ARK portfolio.
FORECASTS ARE HYPOTHETICAL AND HIGHLY SPECULATIVE, AND PRESENT MANY RISKS AND LIMITATIONS. While ARK believes that there is a sound basis for the forecasts presented, they are provided for illustrative purposes only and no representations are made as to their accuracy.
The recipient is urged to use extreme caution when considering the forecasts, as they are inherently subjective and reflect ARK’s inherent bias toward positive expected results. Any positive results should be viewed as a measure of the relative risk of such companies, with higher forecasts generally reflecting greater risk. There is no guarantee that any results will align with the forecasts, and they might not be predictive. Some or all results may be substantially lower than projected results.
The forecast has not been achieved by the company, and like all modeled, projected, or hypothetical information, it is important to note that there are multiple versions of a model, and ARK has a conflict of interest in that we have an incentive to show you the best performing results. These forecasts rely on models, which have several inherent limitations, including: 1) reliance on a variety of data obtained from sources that are believed to be reliable, but might be incorrect, inaccurate or incomplete and ARK does not guarantee the accuracy or completeness of any information obtained from any third party, 2) potential inclusion of inherent model creation biases, data discrepancies and/or calculation errors that could cause actual results to differ materially from those projected, and 3) NO reflection of the impact that material economic and market factors might have had and do not involve market risk. The forecasts rely on assumptions, forecasts, estimates, modeling, algorithms and other data input by ARK, some of which relies on third-parties, that could be or prove over time to be incorrect, inaccurate or incomplete.
The forecasts are based on a variety of criteria and assumptions, which might vary substantially, and involve significant elements of subjective judgment and analysis that reflect our own expectations and biases, which might prove invalid or change without notice. It is possible that other foreseeable events that were not taken into account could occur. The forecasts contained herein represent the application of the simulation models as currently in effect on the date first written above, and there can be no assurance that the models will remain the same in the future or that an application of the current models in the future will produce similar results because the relevant market and economic conditions that prevailed during the period will not necessarily occur. The results will not be updated as the models change, or any information upon which they rely changes. There are numerous other factors related to the markets in general or to the subject company specifically that cannot be fully accounted for in the preparation of forecasts, all of which can adversely affect actual results. For these reasons, forecasted results will differ, and could differ significantly from actual results. FORECASTS ARE PRESENTED FOR ILLUSTRATIVE PURPOSES ONLY.
ARK does not have investment banking, consulting, or similar direct relationships with the subject company.
The model underlying the research presented herein is the result of a research collaboration between ARK and Mach33. Neither party shall be held liable for any loss, damage, or consequences arising from any information presented or actions taken by the other party beyond the content of the model. Please refer to the model on GitHub for additional information.