.png)

I just got my first full stack Gleam app working! On my machine only but still!
One of the positive aspects of working in Gleam is that the community is very helpful and friendly, and the documentation is really helpful. But, nothing is perfect! Here are some tools and techniques in the mighty Gleam ecosystem that helped me. Maybe they can help you!
Print debugging
If you are new to Gleam, you can debug Gleam pretty happily using print statements, so that's what I'll highlight here. Gleam has a versatile and well-supported printf equivalent that is simply echo. You can echo any String type^2 and Gleam will do its darnedest to make a String representation of that type. Gleam builds Strings using the <> operator, so you can make pretty comple x debug statements.
We were able to concatenate several Strings, including one that we generated from a built-in to_string function. Also extremely helpful, echo outputs the line number where it was invoked, which I find useful for debugging.
As I wrote earlier, echo will try to produce a String of non-String types, but because of Gleam's strong typing, other logging solutions may not. If a logging function takes a String as an argument, you better believe it means it. If you don't have a go-to to_string function for your type, you can use the Joe-of-all-trades string.inspect function. It will do its darnedest to get you a String representation of any type. This is mostly helpful for debugging; production code should have dedicated ways to produce String representations.
pub fn main() { let cool_guy = joe() |> CoolType // imagine that this function is info(s: String) log.info(cool_guy |> string.inspect) } // src/scratchpad.gleam:6 // "CoolType(\"Joe\")"string.inspect has some caveats on Hex Docs to read up on, esp. this part:
Using string.inspectThis may be occasionally useful for quick-and-dirty printing of values in scripts. For error reporting and other uses prefer constructing strings by pattern matching on the values.
Read the entry on Hex for more usage guidelines.
Echo Ain't Enough
echo is almost always powerful enough to use for quick debugging operations, but if your project grows and you want something more robust, there are a number of Gleam packages to help you.
First, two very cool & helpful Gleam package sites: Gleam Package Index & Gloogle. The first allows you to search for packages, the second offers more granular search by looking through functions, types, and other package content.
Logging already has 10 packages on the Package Index! Yowza!
Some of these packages are targeted to specific logging and telemetry tasks, but let's talk about a few general ones.
Logging is a Gleam wrapper for the Erlang logger and does most of what you need. The Hex docs site helpfully links to the repository (all of Gleam is open source), where you'll see this:
You will start seeing that avatar everywhere if you look into many of these packages, as that is the avatar of Louis Pilfold, v. v. nice guy and inventor of Gleam! I think of that avatar as a stamp of quality.
But if you need a bigger knife, I've had success using glight (you'll notice many Gleam package names are puns or just gl merged on to words as if it were a prefix -- I believe this is because the name "Gleam" does just that for the BEAM, the Erlang virtual machine it runs on).
glight is a little more verbose than other logging libraries but its structured output is sooo helpful. Also Gleam is like a babby language just hatched but somehow many of the tools have mature versioning, and at the time of writing glight is already up to v2.11. Somehow.
I have rotten vision, and I find glight much easier to read than the other logging libraries. Once set up, you can output quickly readable code in your console. First, to add glight to your project, everything is out-of-the-box in Gleam. Just go to your top-level project directory and type gleam add glight and it will be available in your project instantly. This is how you add any package to your project, and down the line you can remove them if necessary by simply running gleam remove glight. In fact, while working in my scratchpad project, I encountered some build errors. I ran gleam clean and gleam fix but the real fix turned out to be gleam deps update. Typing gleam --help in your terminal shows a bonkers number of tools already built into Gleam, some of which can be really helpful in debugging.
pub fn main() { configure_logger() } pub fn configure_logger() { glight.configure([glight.Console, glight.File("server.log")]) // 1 glight.set_log_level(glight.Debug) // 2 glight.set_is_color(True) // 3 // optional, defaults to "time" glight.set_json_time_key("ts") // 4 // optional, defaults to "msg" glight.set_json_msg_key("message") // optional, defaults to "level" glight.set_json_level_key("lvl") }The code above demonstrates some of glight's powerful config! These are the configurations shared in the README example. First, you configure glight to log to destinations (1). Here we set it up to log to our console and a persisted file glight will create for us called server.log. It's easy enough to add additional files if we need targeted debugging sessions we want to throw away.
glight.configure([ glight.Console, glight.File("server.log"), // TODO: remove this DEBUG sesh glight.File("debug.sesh"), ])We also (2) set our log level (Debug, default is Info) and (3) whether or not we want color. The other options (4) are not necessary, but one trick I use might help you out in a debugging session.
glight.set_json_msg_key("message") sets the key in logging output json to message, but long archives of logging messages tend to run together for my eyes, so I put an emoji in the key to attract my eyes to the output.
glight.set_json_msg_key("🔥 message") // I usually use the fire emoji 🤷♂️Now we can write a helpful log statement composed of key-value pairs and a message title.
glight.logger() |> glight.with("cool_guy", cool_guy |> string.inspect) |> glight.info("🧑🏻🏫 Cool Guy Initialization")When we gleam run this guy, we get a very friendly console message:
Compiled in 0.22s Running scratchpad.main 2025-09-20T08:30:05.620210-04:00 [INFO] 🧑🏻🏫 Cool Guy Initialization | cool_guy: CoolType("Joe")That structure really helps me clarify my thinking when debugging because I can see quickly what is happening. It is clear where the message starts, but I have the noise of the timestamp and log level if I need. Also, because we specified two files for output alongside the Console, we have server.log and debug.sesh with this content:
{"cool_guy":"CoolType(\"Joe\")","lvl":"info","ts":"2025-09-20T08:24:11.711836-04:00","🔥 message":"🧑🏻🏫 Cool Guy Initialization"}Oh boy, this will help me look over a bunch of messages easily! Note that each log statement requires keys to be unique, so if another cool guy joins the party, give him a unique key.
The logs will continue to accrue until you do something to the files, so make sure to .gitignore them if you don't want to share them or your logs contain sensitive content.
Two more libraries I will add that can be helpful: for that secret situation noted above, you can hide content from the logger by using redact (available here) and you can make your console output even more readable by using pprint, which outputs structured Strings of all your messy code (here).
And if none of these suits your fancy? Write your own! Gleam has a tool to publish your tool to Hex. Or contribute to open source and collaborate with the lovely community.
Code Actions
As I said, Gleam ships with 1 million tools [1] that are all very helpful and well thought out. One is Code Actions, little actions the LSP provides your IDE to do common coding tasks quickly.
There are a ton of these, but two I'll point out here:
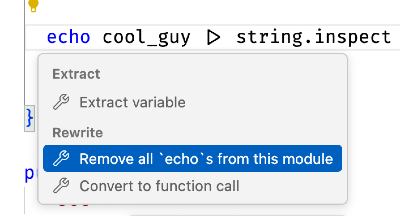
If you trigger the code action menu (Cmd + . on my Mac in VS Code) while your cursor is in a place where a code action could occur, you will get options. A really helpful one for debugging is the option to remove all echo s from the current module! I use this one a lot. 😅
Also, in the code above, I'm using a pipe to pass an argument to a function. If you get confused about some long string of |> code, you can trigger a code action from a line of piped code and get this helpful bud:
This might make more sense to you if you aren't familiar with the railroad-style development Gleam makes space for. And don't worry, there's another code action to revert this to pipes when you learn to love them.
There are a bunch of these and the lovely ✨Gleam community is always writing more. Open source contribution idea: a code action to echo a variable from the line following!
Browse all other code actions on the official site .
More help
You can seek more help from the Gleam community on Discord or the official Gleam site. If you would like more advanced debugging help, check out this article. The command gleam shell will also start an Erlang shell session for you in terminal; read more about this here.
- approx. ↩︎
- An earlier version of this article incorrectly stated that echo required you to feed it a String, which is not true. Thank you to user Glears on the Gleam discord for pointing out my mistake.