I do a fair number of benchmarks, not only to validate patches, but also to find interesting (suspicious) stuff to improve. It’s an important part of my development workflow. And it’s fun ;-) But we’re dealing with complex systems (hardware, OS, DB, application), and that brings challenges. Every now and then I run into something that I don’t quite understand.
Consider a read-only pgbench, the simplest workload there is, with a single SELECT doing lookup by PK. If you do this with a small data set on any machine, the expectation is near linear scaling up to the number of cores. It’s not perfect, CPUs have frequency scaling and power management, but it should be close.
Some time ago I tried running this on a big machine with 176 cores (352 threads), using scale 50 (about 750MB, so tiny - it actually fits into L3 on the EPYC 9V33X CPU). And I got the following chart for throughput with different client counts:
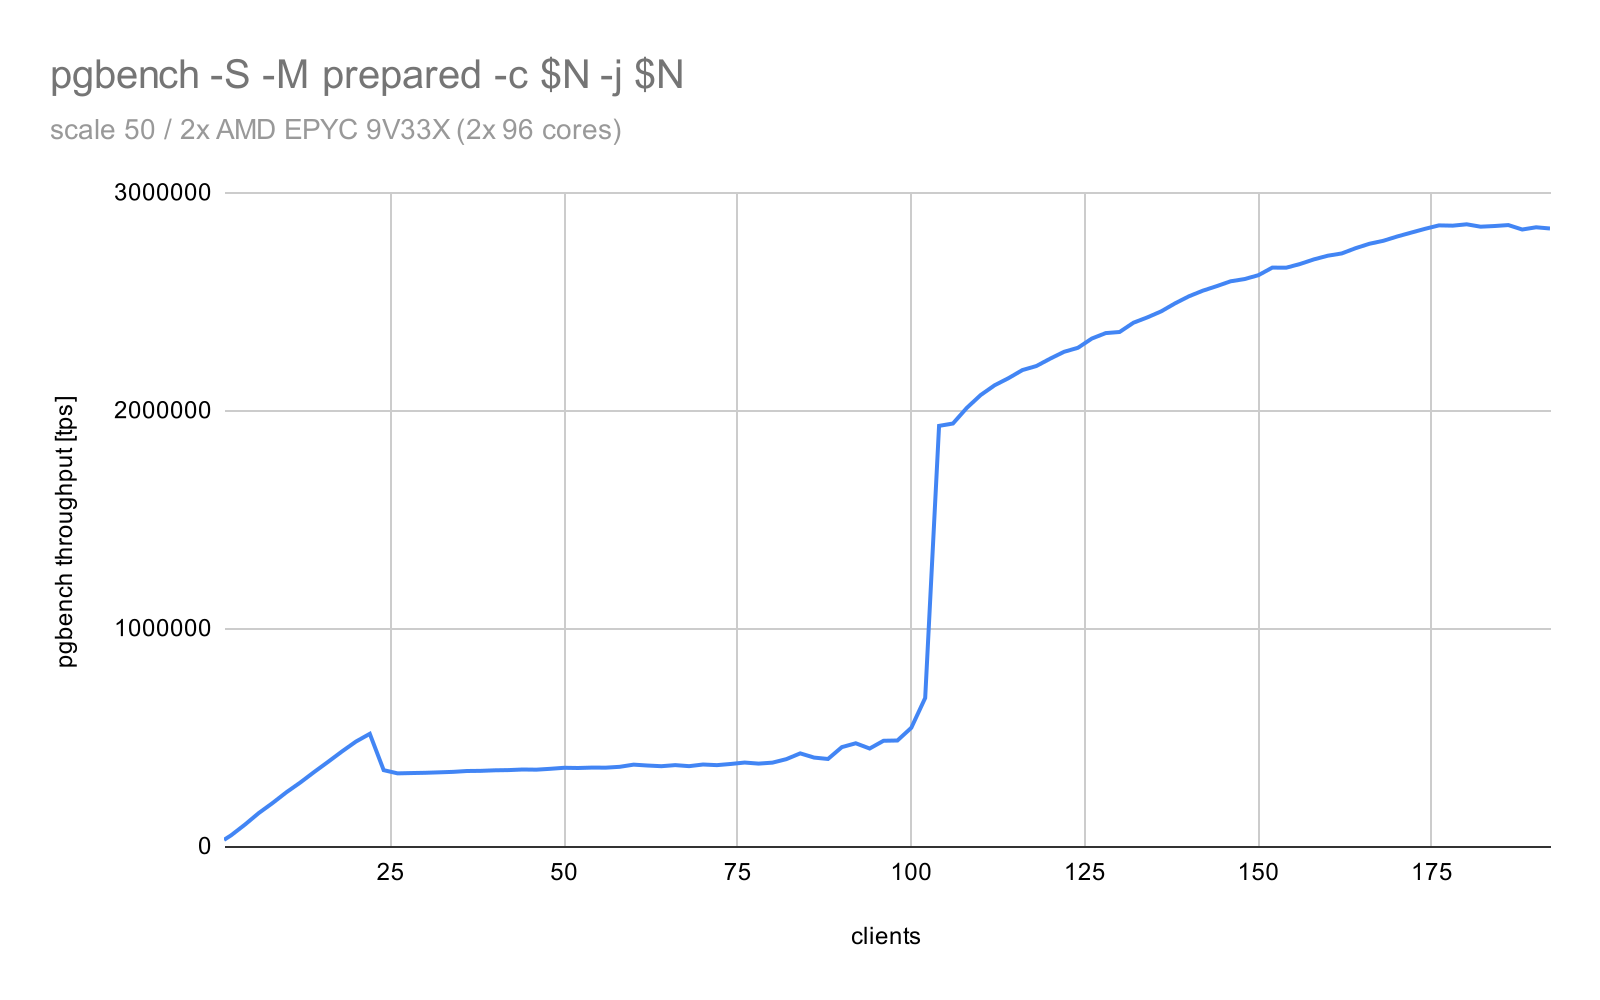
This is pretty awful. I still don’t think I entirely understand why this happens, or how to improve the behavior. But let me explain what I know so far, what I think may be happening, and perhaps someone will correct me or have an idea how to fix it.
If you look at the chart, everything goes fine up to ~22 clients, with about 24k tps / client. We get ~500k tps with 22 clients, then something goes wrong, and the total throughput drops to ~350k tps. And it stays there until ~100 clients. This means the per-client throughput drops to ~5k tps. And then at ~100 clients the issue magically disappears, and we’re back at ~20k tps per client.
I’ve been investigating this for a while, and I still don’t know what’s causing this. Or what to do about it. I have some guesses, of course, but it’s hard to know for sure.
Let’s talk about the various causes I considered, why I think some of them are unlikely. And perhaps show some additional weird stuff I ran into during the investigation.
What’s NOT causing this (probably)
locking
The first thing I considered is some sort of locking issue, but it does not seem like one, for a couple of reasons.
The read-only pgbench doesn’t really need any exclusive locks, it just reads data, so a shared lock is enough.
Locking issues don’t magically disappear like this with more clients. You start having them, and then they keep getting worse as the number of clients increases. Because the contention increases.
Locks also show in various places, depending on the type of the lock. I inspected places like wait events in pg_stat_activity, perf, and I found no signs of lock causing this.
Note: There are locks that are hot, e.g. locks/pins on the root page of the BTREE index used by the query. But it’s not causing this issue (the experimental patch makes no material difference).
CPU resources (time / caches)
It also does not seem like contention for CPU time, or CPU resources. Yes, the on-CPU caches tend to be fairly small, and adding clients means each client gets smaller and smaller. That may affect the throughput, but it typically does not crash like this, it just grows slower.
And when I say that the CPU caches are fairly small, that’s compared to the total amount of memory. The 9V33X CPU is quite massive, each with more than 1GB L3 cache - that’s enough for the whole scale 50 database.
The sudden increase at ~100 clients contradicts this theory too (more clients = less resources, yet the throughput improves).
CPU power/thermal management
What about power management? More clients means more active cores, which means more heat. At some point the CPU may need to limit the frequencies, to keep the temperature under control. CPUs typically can’t run all cores at the full speed at once.
But that does not seem to be happening here - at least judging by system stats (the exposed counters are somewhat limited, unfortunately). And again - if this was the issue, why would it go away at ~100 clients? The system clearly can handle much higher throughput.
But I’ll get back to this in a little bit …
NUMA
I also don’t think it’s related to NUMA, for similar reasons. Postgres is not NUMA-aware, i.e. it ignores nodes when allocating memory, forking backends, etc. Which may cause issues, and we may need to improve that. But that should affect all client counts - there’s no reason for this to kick in at 23 and disappear at 100 clients.
It is true the system has 176 cores in 4 NUMA nodes, so 44 cores per node. Which seems to “align” with the 22 clients (22 pgbench threads + 22 backends). But I don’t think it can be relevant, because the busy cores seem to be picked at random (per top and htop output). The “random” pinning (presented later) also contradicts that - it picks cores randomly, and yet it’s affected. And for some of the runs the behavior changes at different places too, not at 22 clients).
What could be causing this?
Now that I’ve explained what I think is not causing the behavior, let’s go through a couple options that I think may be more likely, and show some more charts. I’m not claiming I’m sure about any of this, and for a couple options I even present data that may rule it out as a cause.
Take it more as a record of my thinking about the issue, and how my understanding of it changed throughout the investigation.
kernel task scheduler
At some point I started to suspect this might be related to how the kernel schedules processes to cores. Let me explain why I think this might be relevant.
After investigating the issue for a while and getting nowhere, I started to speculate that maybe if the two processes (backend and the pgbench thread controlling it) get placed on different cores, that may not be great.
Each side will get a message, do a little bit of work, and send a reply. Then the process on the other end needs to wake up, and do the same thing. Maybe if the processes end up on different cores, the wakeup is slow? Or maybe the core is “waiting” too much and it enters some sleep state? With one side waiting for the other, we’d get about 50% utilization on average.
I wasn’t sure how to best investigate this, but I realized I already have a patch that explicitly pins backends (and pgbench threads) to cores. I wrote it some time ago to reduce noise during microbenchmarking.
The patch allows two ways to pin processes/threads:
colocated - Each process pair (backend and its pgbench thread) gets pinned to the same CPU core. The cores are selected at random.
random - Each process/thread gets pinned to a random core, and the processes in a “pair” get assigned to a different cores (so that pairs don’t get colocated by chance).
I came to think of the strategies as “best case” and “worst case”. With the colocated strategy, it should be possible to get ~100% utilization for each core, and the kernel could also do additional optimizations (like pass data without copying). With “random” none of this should be possible, it always has to communicate between cores.
With the patch applied, I got the following chart for the strategies.
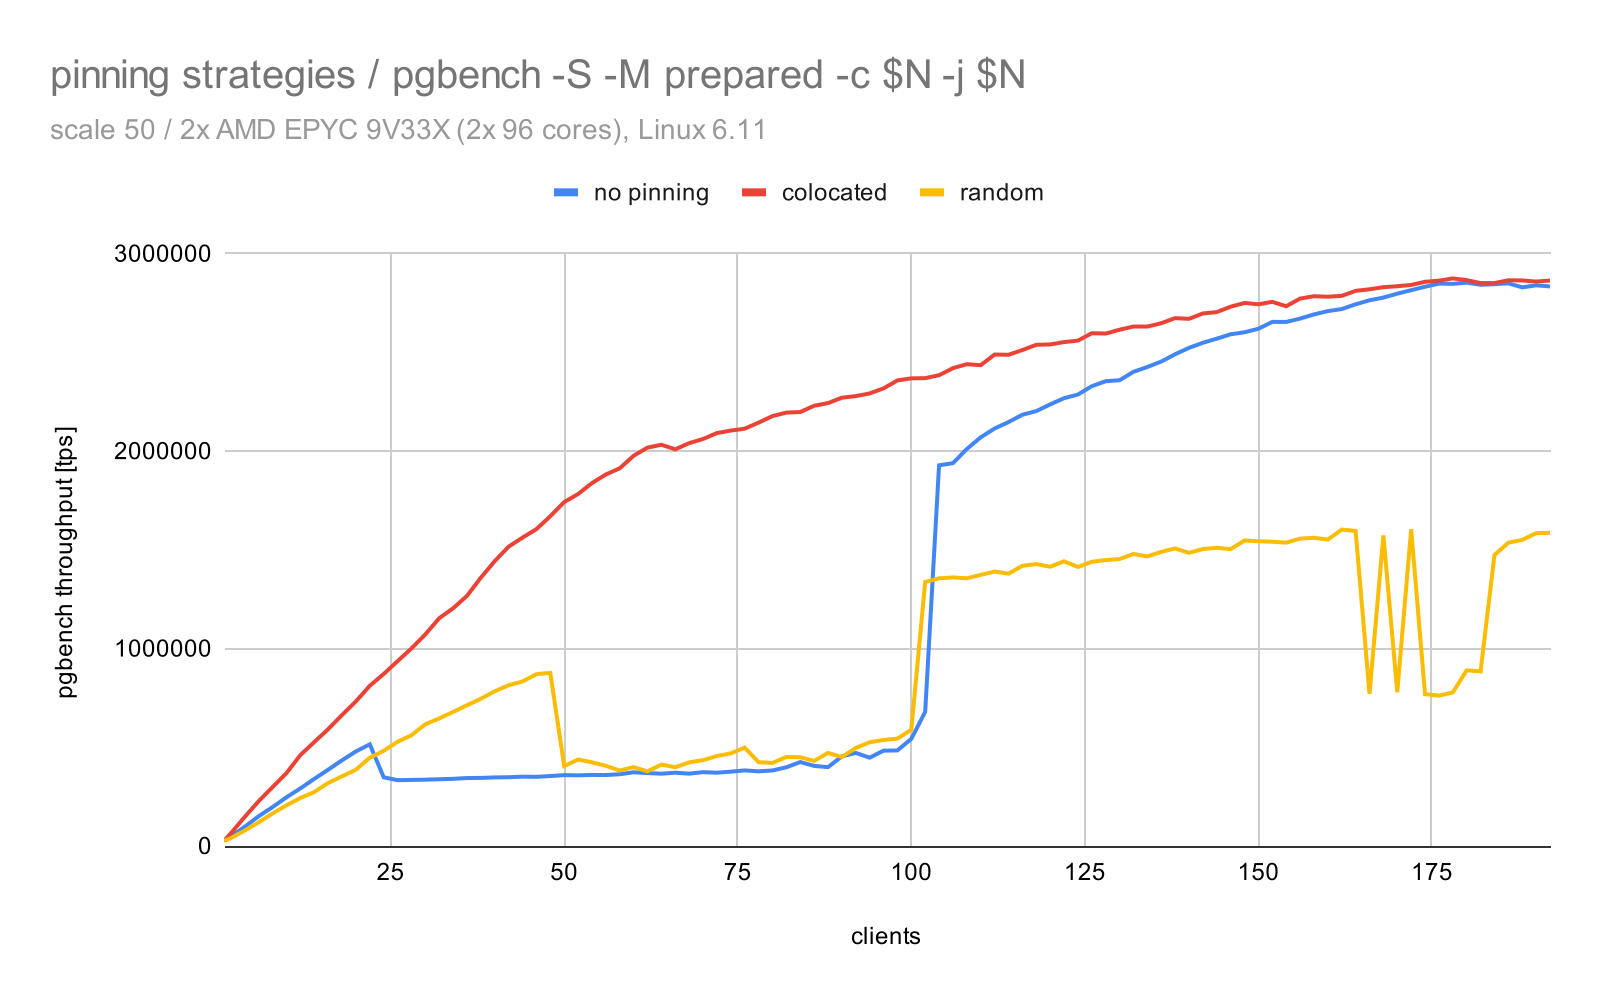
The “colocated” strategy (red line) seems to work great - the issue is gone, outperforms everything. The “random” has the issue, although it does shift it a little bit, it starts at ~45 clients (not ~22). The “no pinning” case starts as “random”, but then with 100+ clients gradually shifts to “colocated”.
This clearly shows that task placement matters. It may not be the root cause, but it definitely affects the behavior.
Note: I’m not suggesting this explicit pinning is a practical fix. Applications usually don’t run on the database server, which means we can’t actually “pin” that side of the connection anyway. More importantly, workloads may not be this regular/simple, so these pinning schemes would lead to unbalanced systems (some cores being over-used while others being idle). A more dynamic solution would be needed, similar to what the kernel scheduler does - and that’d be a lot of code and complexity. But it’s useful as a tool for experimenting.
scheduler stats
While discussing this with a couple colleagues, it was suggested this might be related to how the kernel switches between processes. I’m not that familiar with the low-level details, but it seems the processes may be woken up either because of a timer (from the “idle” thread), or using IPI by another process (the other side of the connection).
I got asked to run the test again and collect some additional counters using perf stat, namely these events:
- ipi::ipi_send_cpu - woken by another process
- timer::hrtimer_cancel - woken by idle thread
- timer::hrtimer_start - counterpart of hrtimer_cancel
- context-switches - number of context switches
- cpu-migrations - number of migrations to another core
Here’s a chart with this info (it omits the “hrtimer_cancel”, as it’s virtually the same value as the “hrtimer_start” counter):
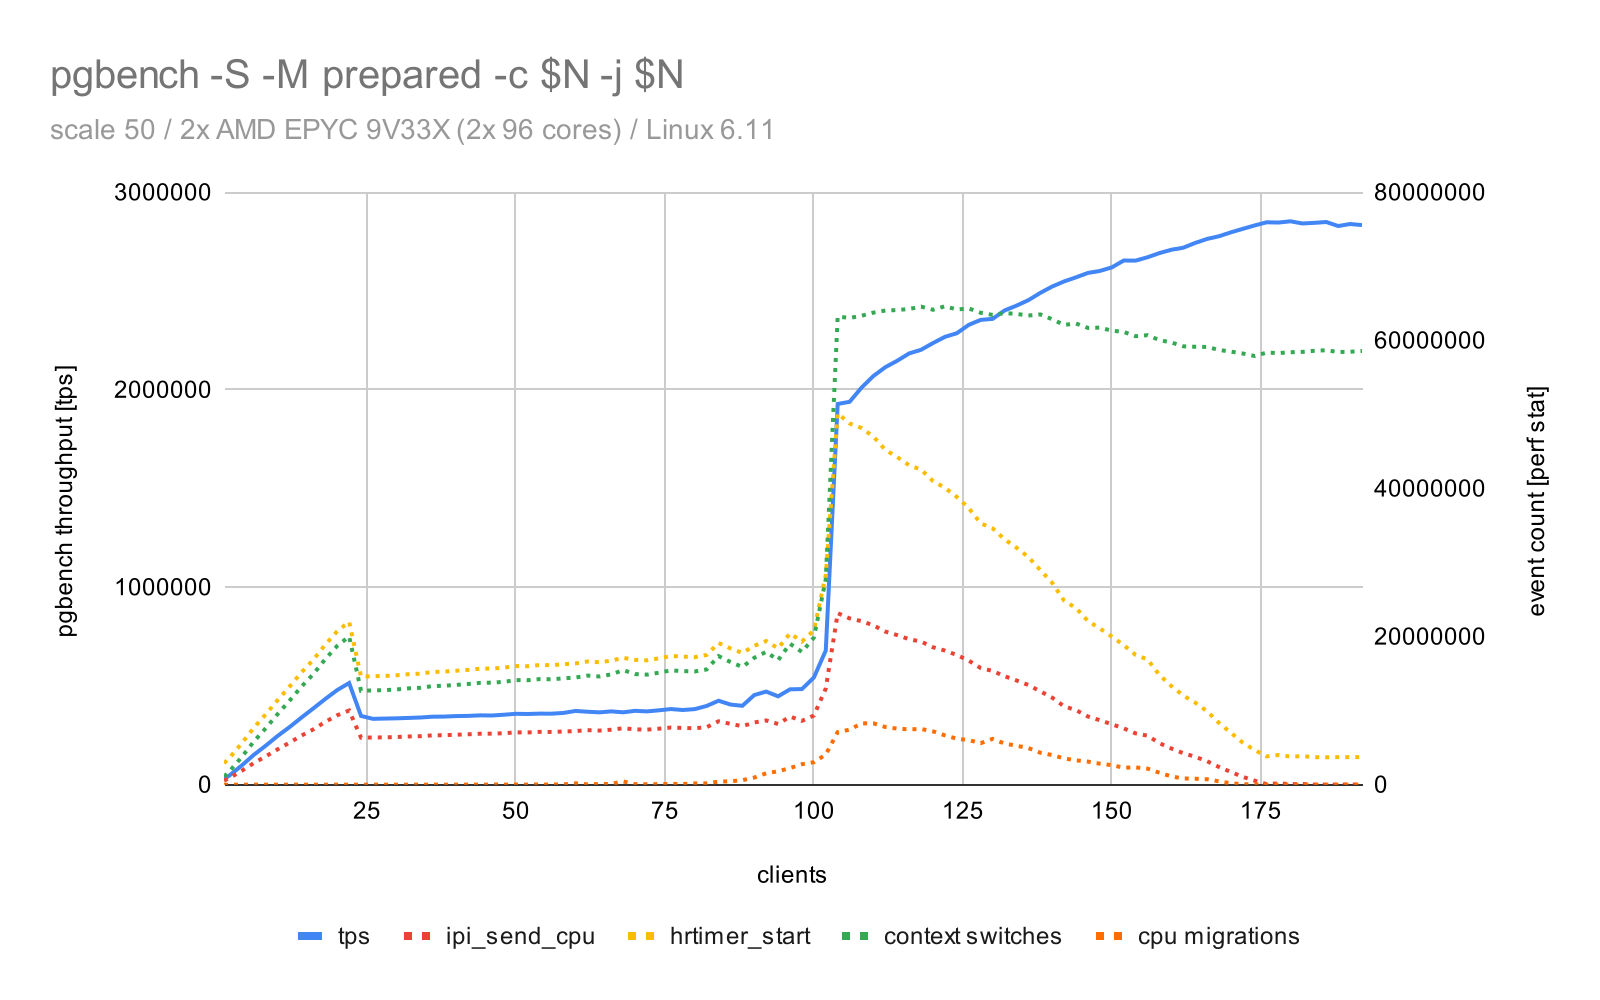
I don’t see anything particularly illuminating here. There’s definitely some correlation - the series spike at the same time. But I still don’t understand why the throughput drops at ~23 clients, or why it suddenly recovers at ~100 cores.
There’s no sudden change when the issue hits at ~22 clients. Yes, the values go down, but it’s proportional to the throughput, the ratios remain the same. Why does the throughput drop?
At 100+ clients, we see fewer and fewer hrtimer_start events, which means the cores are less idle. Which makes sense, because with 100 clients we actually need 100 backends and 100 threads, and the system has 176 cores. So we’re starting to run out of CPU time / cores. And the system is starting to migrate tasks between cores.
But that’s after the issue, which means the migrations or context switches are not causing it. This does not really explain why the throughput (and all the counters) spike like that at 100 clients. But the task scheduling seems to matter.
locking
I initially ruled out locking as a possible cause, as explained in an earlier section. But perhaps that was premature? Maybe there’s some strange effect, where adding more clients happens to “align” the execution in a way that reduces lock conflicts?
When I ruled out locking, I didn’t mean to say the workload does not have lock contention. There are locks that are very hot, e.g. locks/pins on the root page of the BTREE primary key used by the query. The queries are very cheap, and I’ve observed cases with ~10-20% on this. Andres already reported in 2023 this may not scale well, and Thomas Munro already shared an experimental patch to improve the _bt_getroot case.
And with that patch I get this:
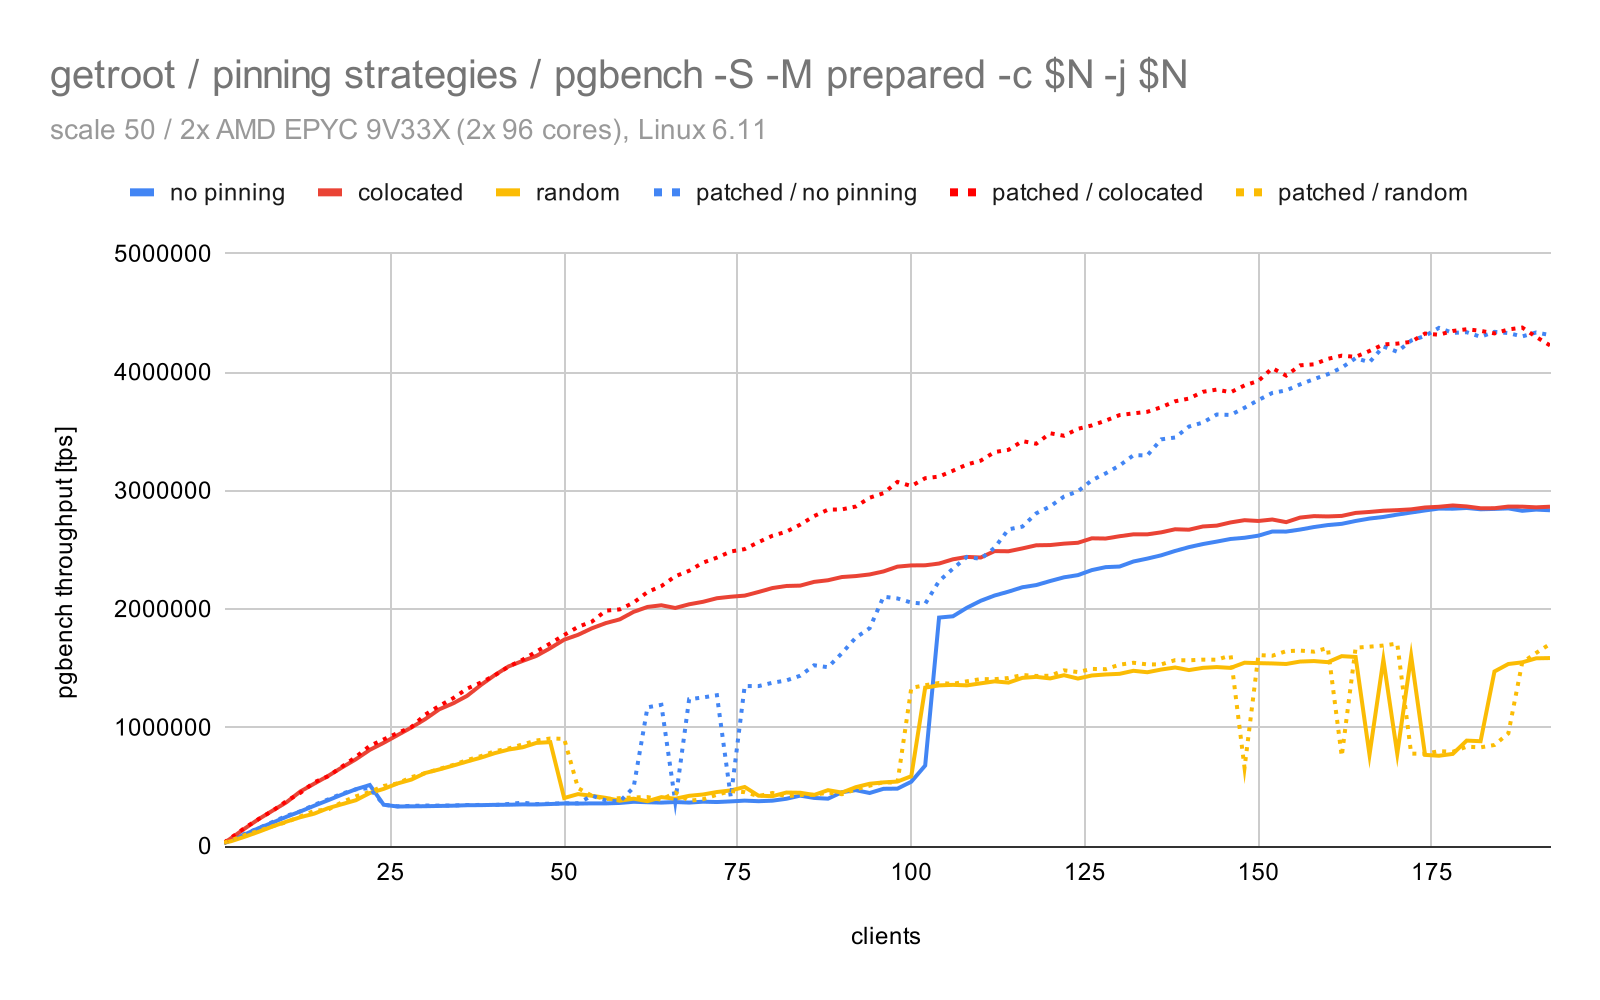
The patch clearly makes a difference, starting at ~60 clients. In the end we get about 30% improvement for the no-pinning/colocated cases. The “random” pinning strategy doesn’t seem affected at all, though.
It does not fix the issue, though. The drop is still there, although it’s interesting the point when the “no pinning” case bounces back shifts. It used to be ~100 clients, now it happens at ~60 already. It’s also interesting that this aligns with the point where the patch starts to benefit for the “colocated” results. It might be just a coincidence, of course.
The chart also shows some “flipping” where the throughput increases, only to drop with more clients. There’s a bit of variability between runs, particularly between 60-75 clients, and the chart does not look as “clean” as before.
I still think locking is not causing the issue.
kernel 6.15
I started wondering how tied this is to the system configuration. Maybe if it happens only for some configurations, that will tell us something? For example could this be specific to a particular kernel version? Or maybe what if it’s affecting Linux but not FreeBSD?
All the data presented so far were from kernel 6.11, because that’s the default in Ubuntu 24.04. I tried building a custom kernel 6.15 (current mainline), with a config based on the 6.11.
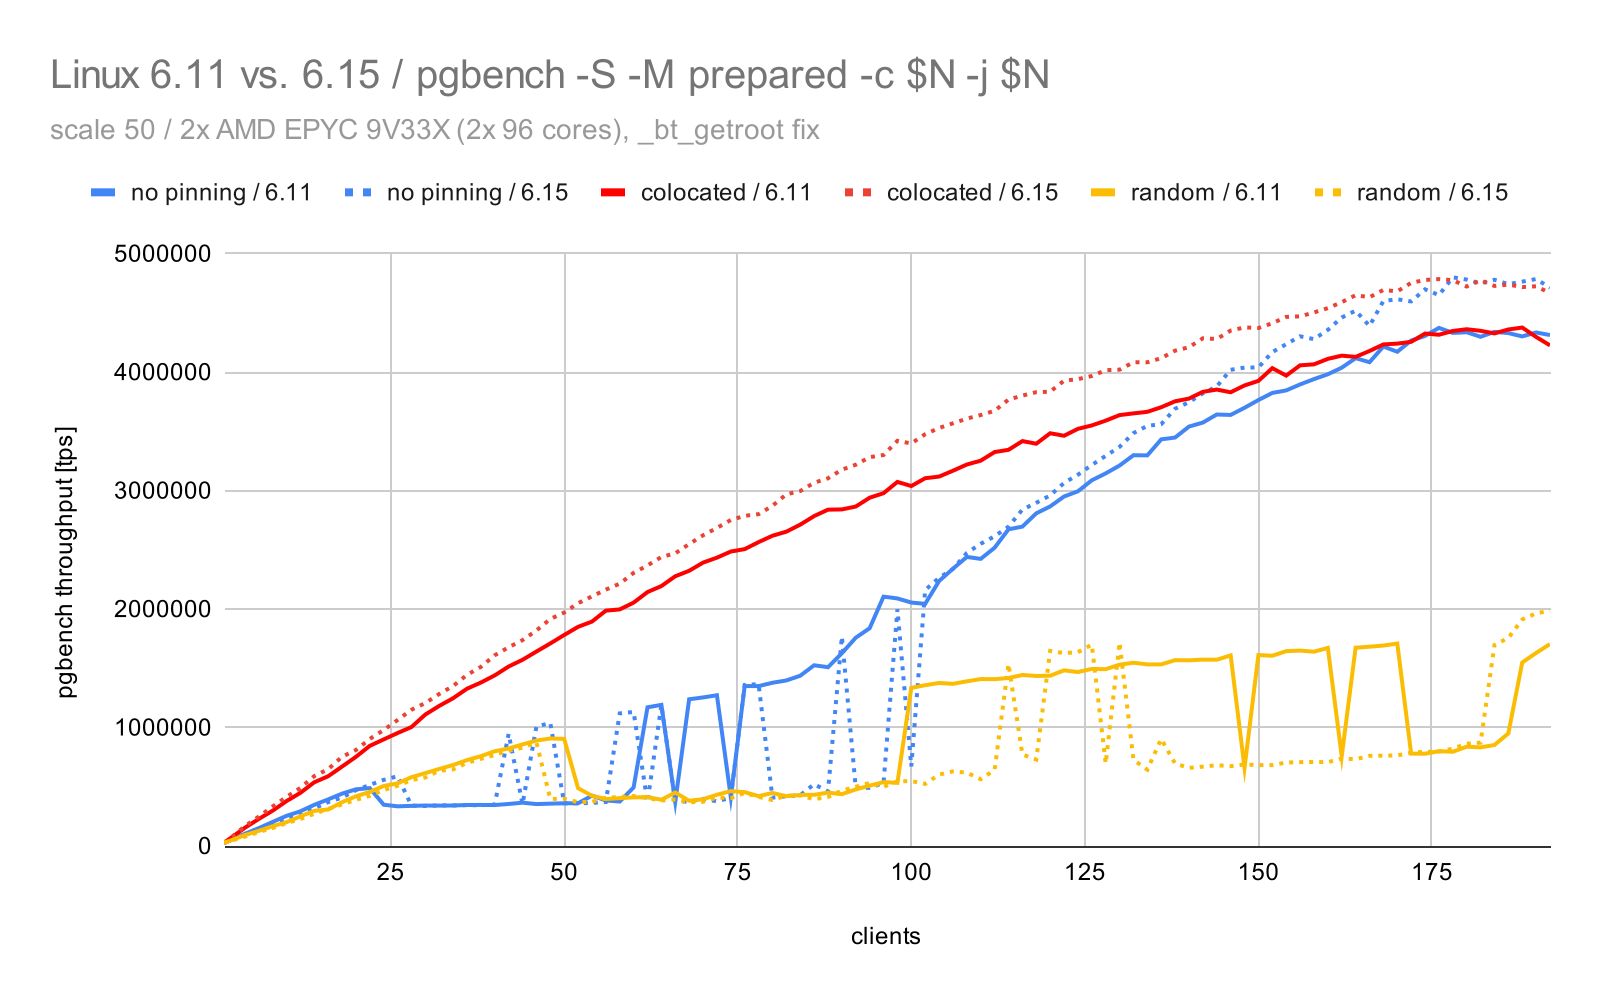
The 6.15 kernel helps a bit, adding ~10% compared to 6.11. But the overall behavior does not change. So either it’s not a kernel issue, or it’s affecting both versions.
Note: Speaking of kernel, I tried fiddling with a couple settings that are known to cause issues. In particular, I mean NUMA balancing (kernel.numa_balancing), sched_autogroup (kernel.sched_autogroup_enabled) and transparent huge pages (various bits). I disabled all of that, but it made no difference, so I won’t get into the details.
FreeBSD
Then I realized I can easily provision the same hardware with FreeBSD 14.1. So I did that, ran the same test, and I got this:
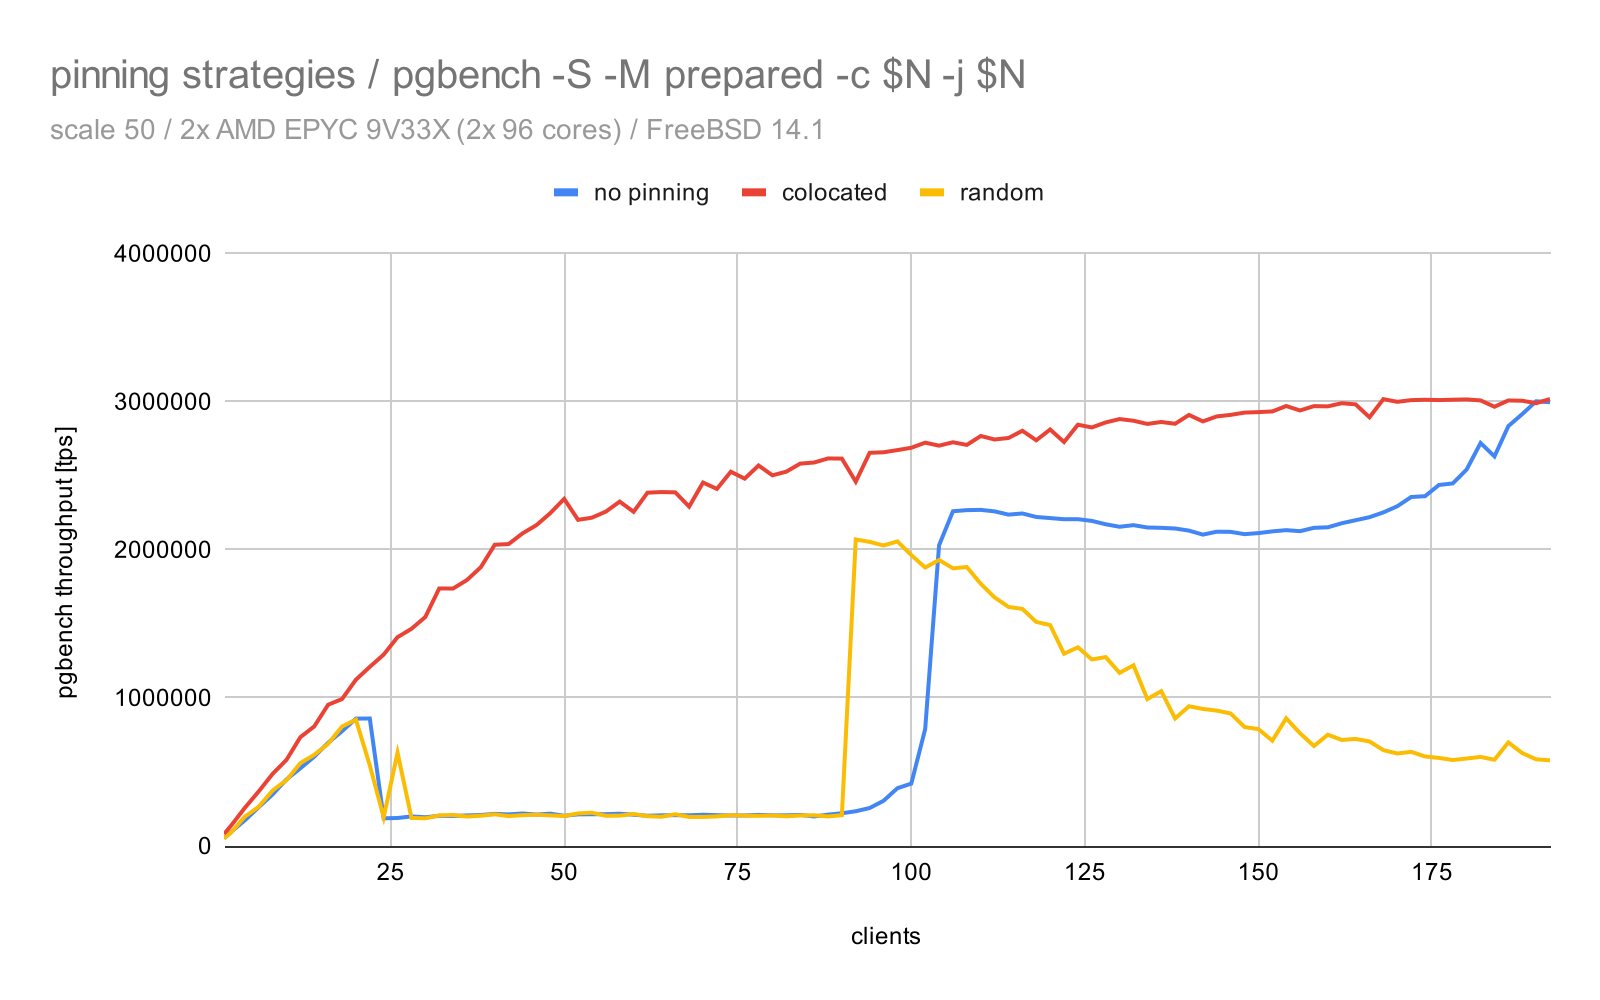
Note: I actually did this test before trying the _bt_getroot patch, so if you want to compare this to Linux, use the chart from the kernel task scheduler section. FreeBSD seems actually a little bit faster than Linux.
There are some differences (especially for the “random” pinning), but the issue is there. This does not seem to be Linux-specific, it’s a generic behavior.
TCP/IP (non-localhost)
Another thing I tried is switching to a TCP/IP (instead of the unix sockets used by default), with a non-local interface. The theory is this should make some optimizations impossible, and I got this:
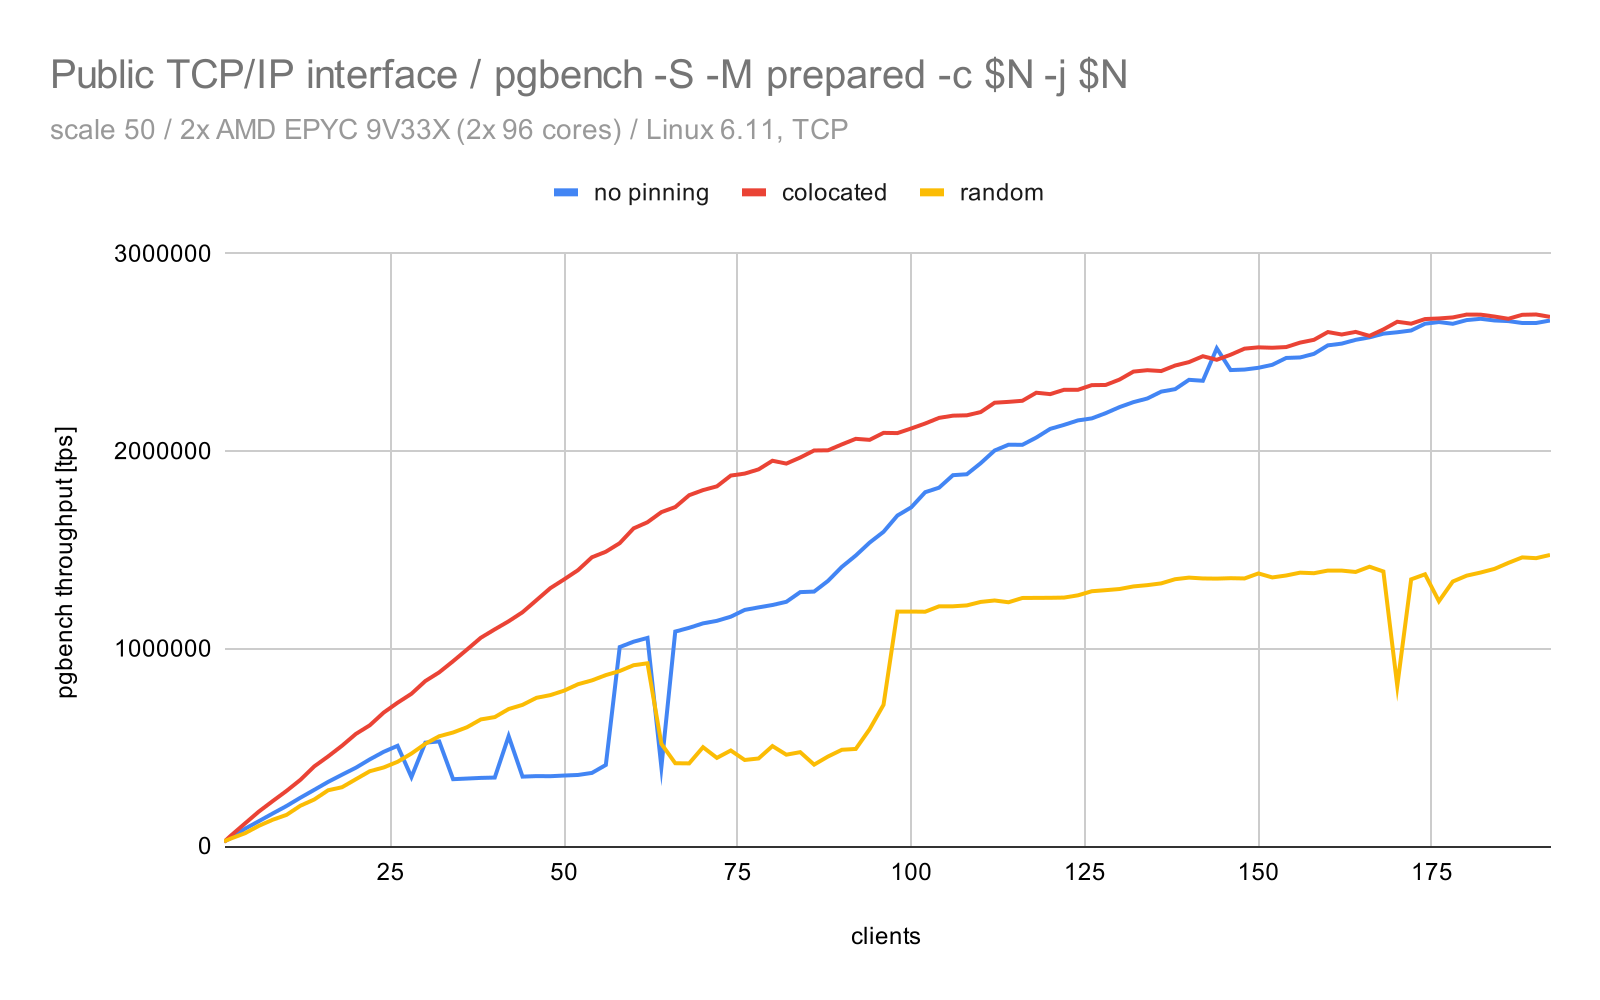
The behavior is still there, but it’s less significant, and it shifts a little. The “no pinning” and “random” cases are no longer aligned. The throughput changes only a little (maybe 5-10%) compared to unix sockets, so maybe the issue is not “tied” to the client count that much?
Not sure what to learn from this.
keeping the system busy …
At some point I realized it matters how busy the system is while running the benchmark, but in a rather surprising way. It’s understandable that if you start doing something expensive on the system you’re testing, it may affect the measurements. At least that’s my intuition.
But that’s not what I’m observing! Let’s run the read-only pgbench with 50 clients for 30 seconds, with progress every second:
and while the pgbench is running (after ~10 seconds), let’s run stress (again for ~10 seconds):
The schedtool -D means it’s running with SCHED_IDLEPRIO priority, which the documentation explains like this:
SCHED_IDLEPRIO is similar to SCHED_BATCH, but was explicitly designed to consume only the time the CPU is idle
And with this, I’m observing this behavior:
So initially, the throughput is ~400k tps, which means only ~8k tps per client. Then when the stress starts running, the throughput spikes to 1.3M tps (26k tps / client). And then when stress completes, it drops again, but only to 1M tps (~20k tps / client).
For me, this seems quite unexpected. It suggests allowing the cores to get idle significantly hurts the throughput.
This very much seems like some heuristics in the CPU, making the wrong decision in some cases. Say, powering down cores that seem too idle, or something like that. But there’s the fact that initially it works fine, up to ~22 clients. I don’t think the core utilization suddenly changes at 22 clients, yet the behavior is different.
pipelining
The idle time observations made me wonder if the queries with scale 50 are so short (compared to the communication overhead) that the process is not active enough to keep the core “active”. If this is the case, how expensive do the queries need to be for this to not happen?
A good way to make the backends busier is sending them multiple queries at once, with a pipelining (without waiting for the preceding query to respond). Something like this:
Here’s a chart for cases with a 1 and 5 queries in the pipeline:
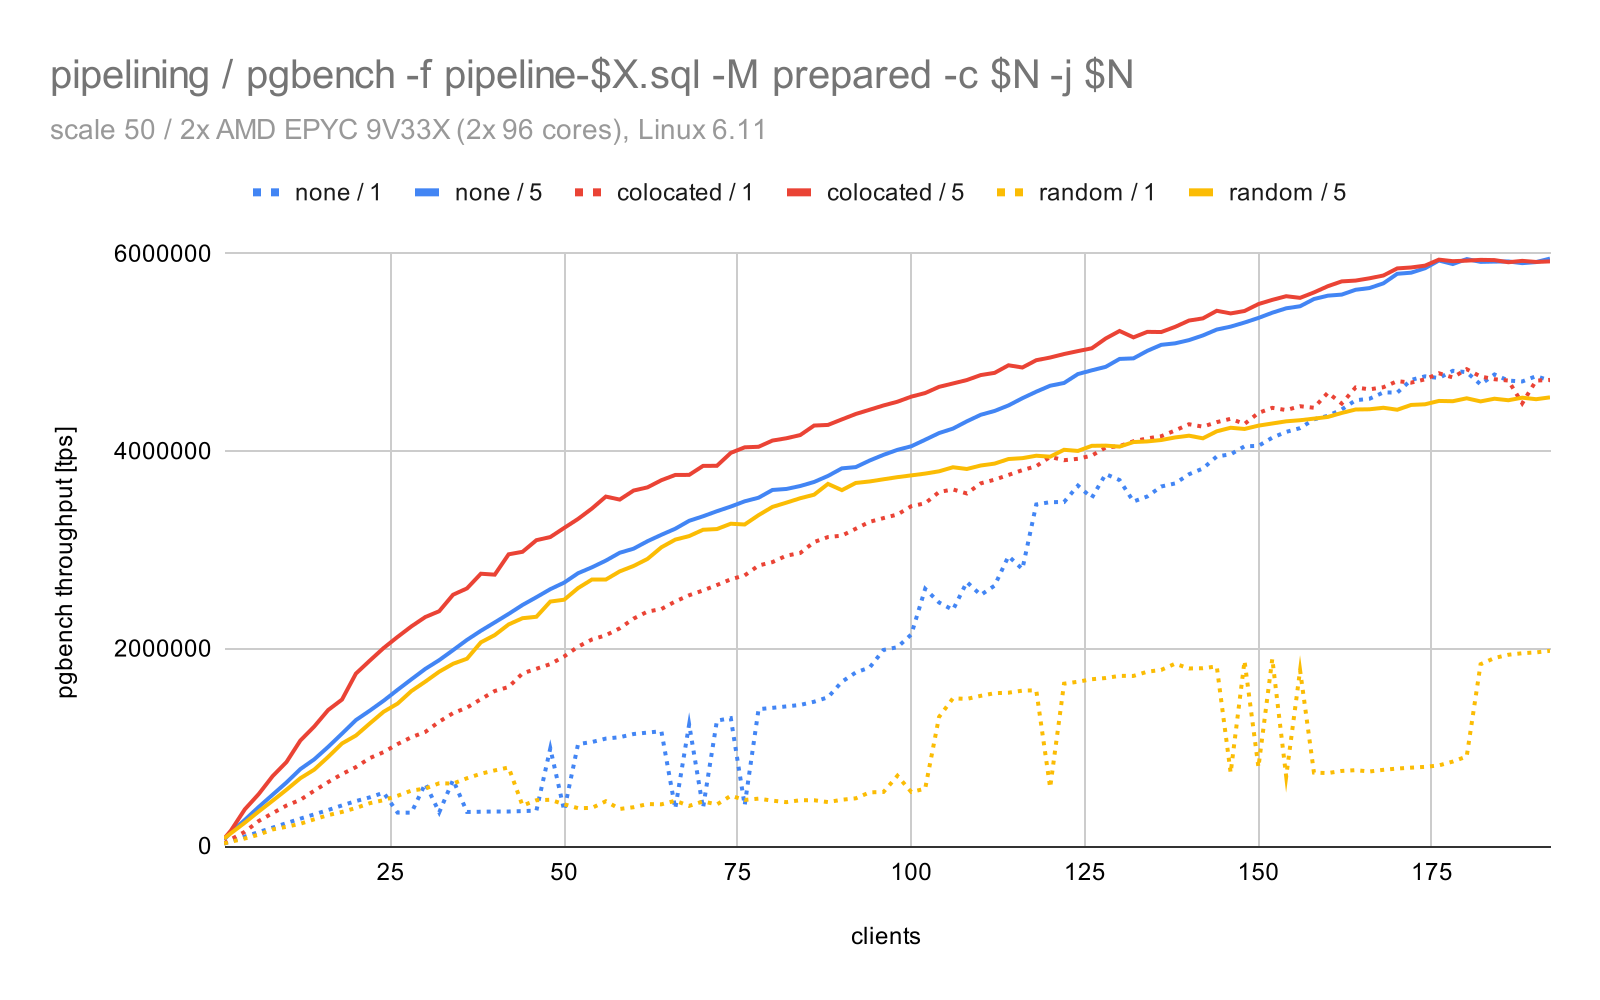
The results for 5 queries are multiplied by 5, to make them comparable to single-query pipelines. It’s not quite fair, due to a lower communication overhead, but what matters are the trends.
The pipeline with just 5 queries is apparently expensive enough to not let the core go idle for too long, and the issue disappears. The curves even have the expected shape, with throughput initially increasing faster.
Some differences between the pinning strategies remain, but it’s much milder than before. Perhasp 25% with 176 clients, and the “no pinning” case converging to “colocated”. Which is quite nice.
This is great. It means you won’t have this issue in practice unless (a) your workload is such tiny queries and (b) you have the “right” number of clients to fall into the “low throughput” window.
Other systems
While investigating the issue, I naturally asked - how hardware specific is this behavior? I have switched between multiple 176-core boxes, and all of those behaved the same, so I knew it’s not specific to that one unique machine.
But what about some other systems? I decided to run the same benchmark on two machines - another EPYC with only a single socket / 96 cores, and a 2-socket Xeon (44/88 cores) I happen to have at home.
EPYC 9V74
The first system is another EPYC machine, with EPYC 9V74 (96 cores) in a single socket. The results with the perf stat counters look like this:
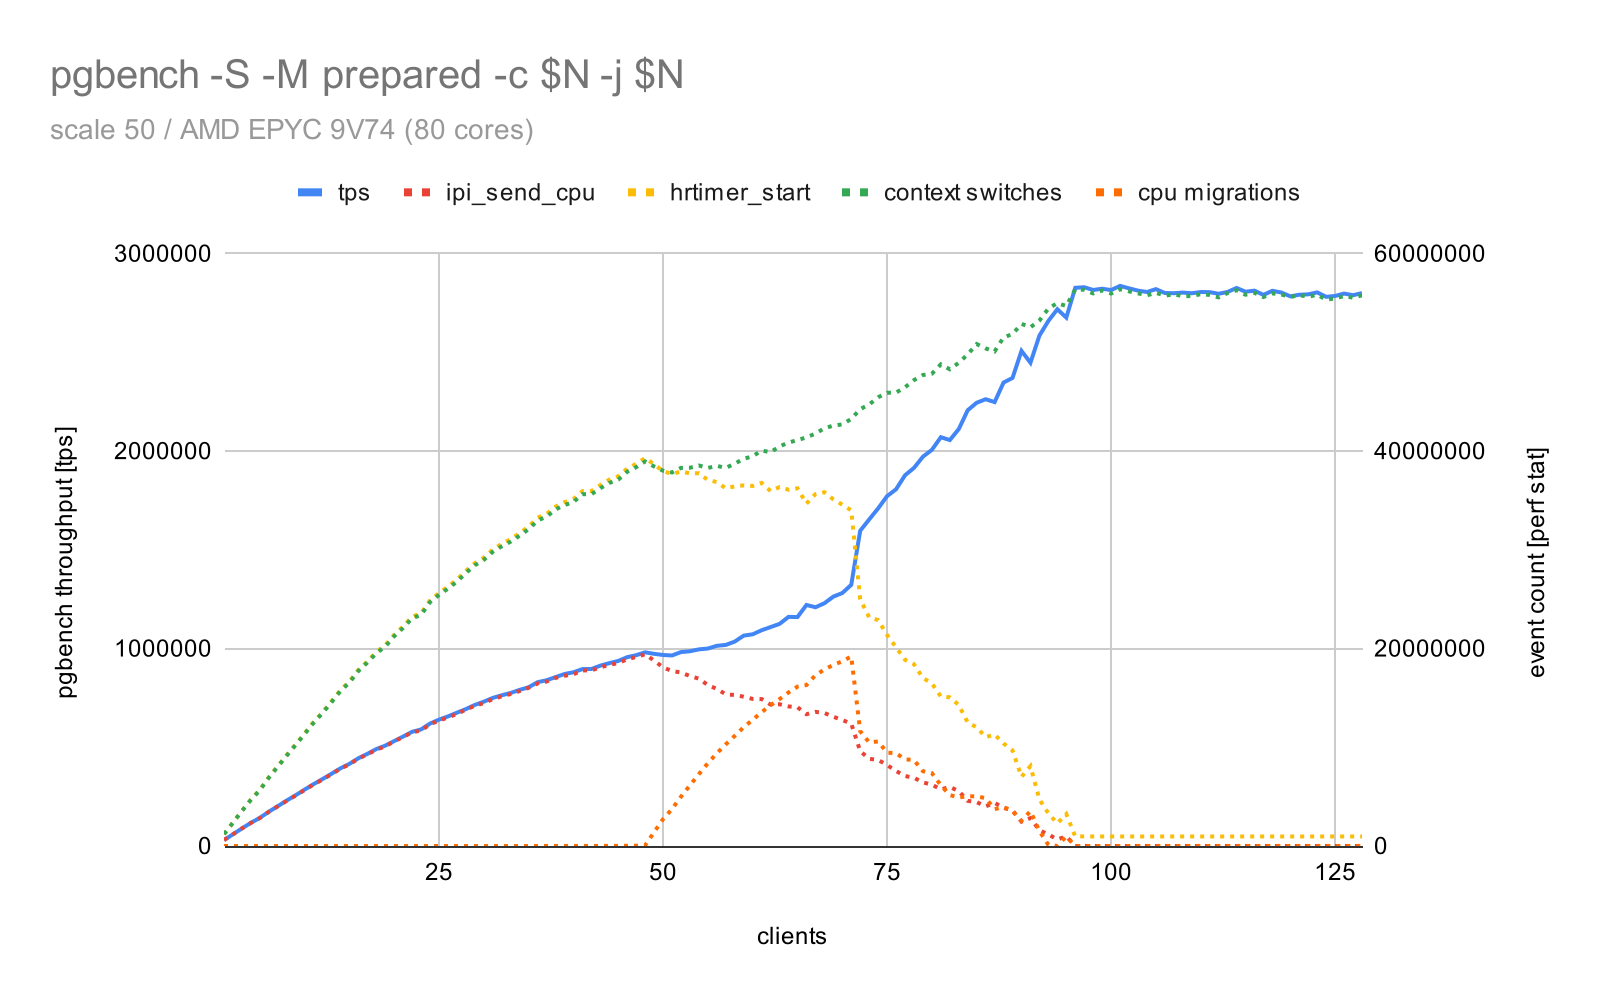
There is no “drop” in throughput like on the bigger box, but the first half clearly scales slower, it almost levels off at ~50 clients, and then at ~72 clients it suddenly decides to go much faster. I’m not sure if this is the same issue or not.
For completeness, here’s the chart with different pinning strategies:
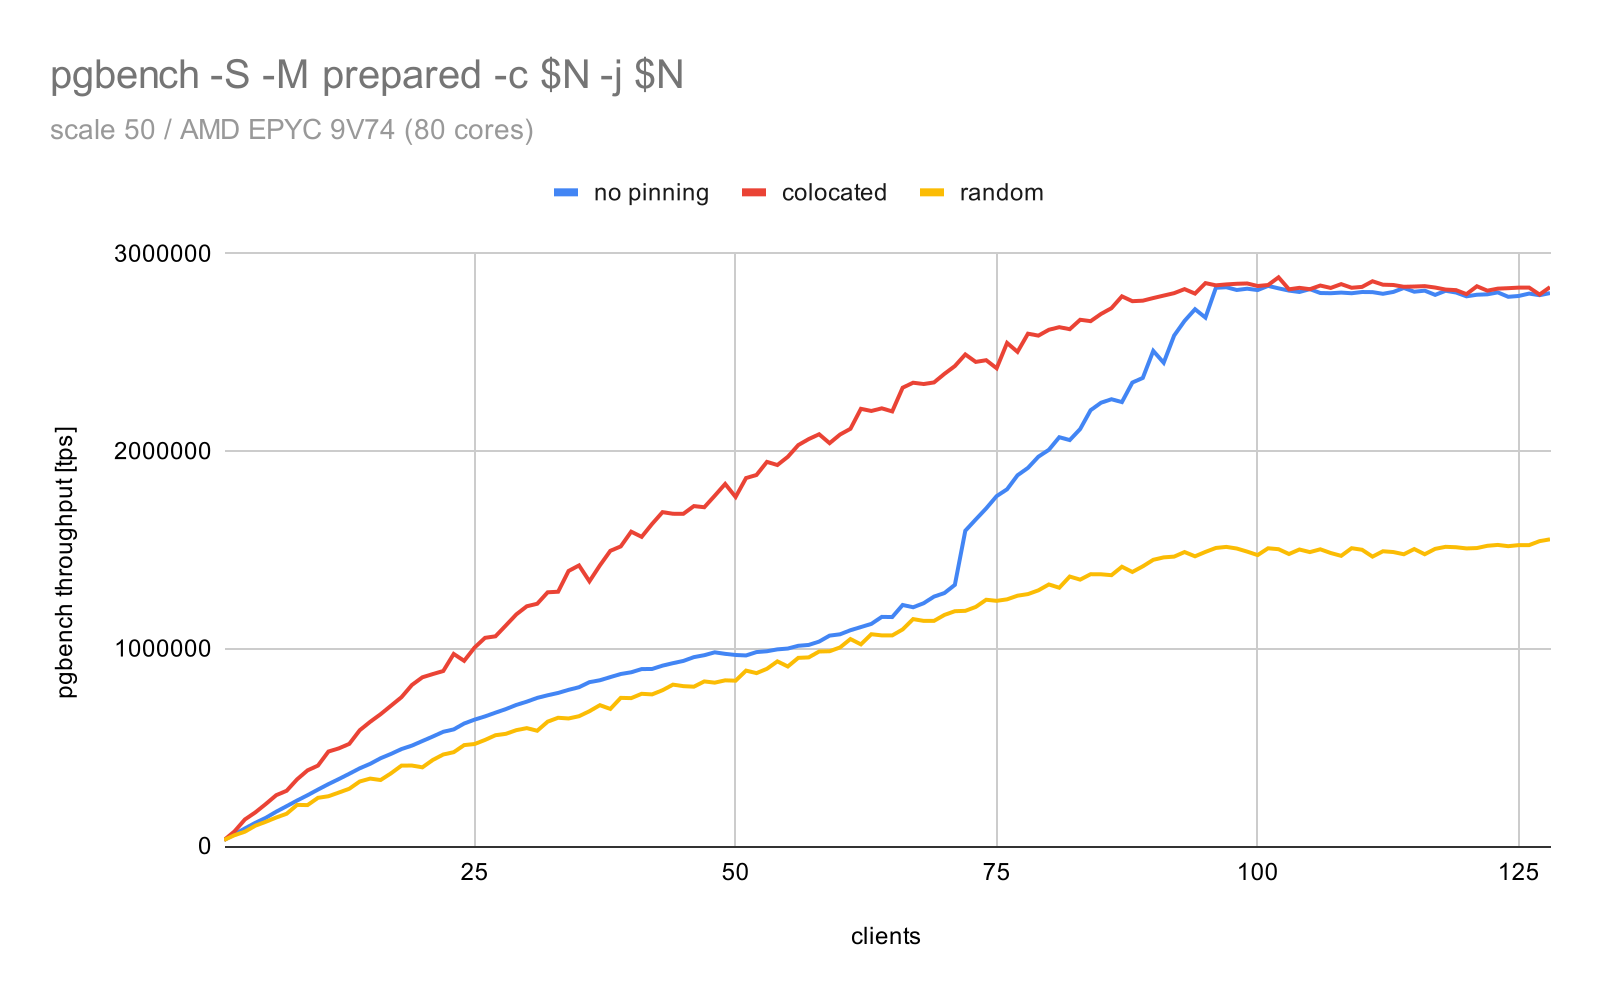
The throughput initially follows the “random” strategy, and then it slowly morphs to the “colocated” one. If this is not the same issue, this certainly seems very similar.
Xeon E5-2699v4
The second system is my old test machine from ~2016, with 2x E5-2699v4, with 44 cores / 88 threads. Not only is it Intel, but it’s also a much older design, from before everyone switched to chiplets. So it often behaves quite differently in various ways.
Here’s the chart with perf stat counters (there’s no ipi_send_cpu because the 6.1 kernel does not seem to have that event):
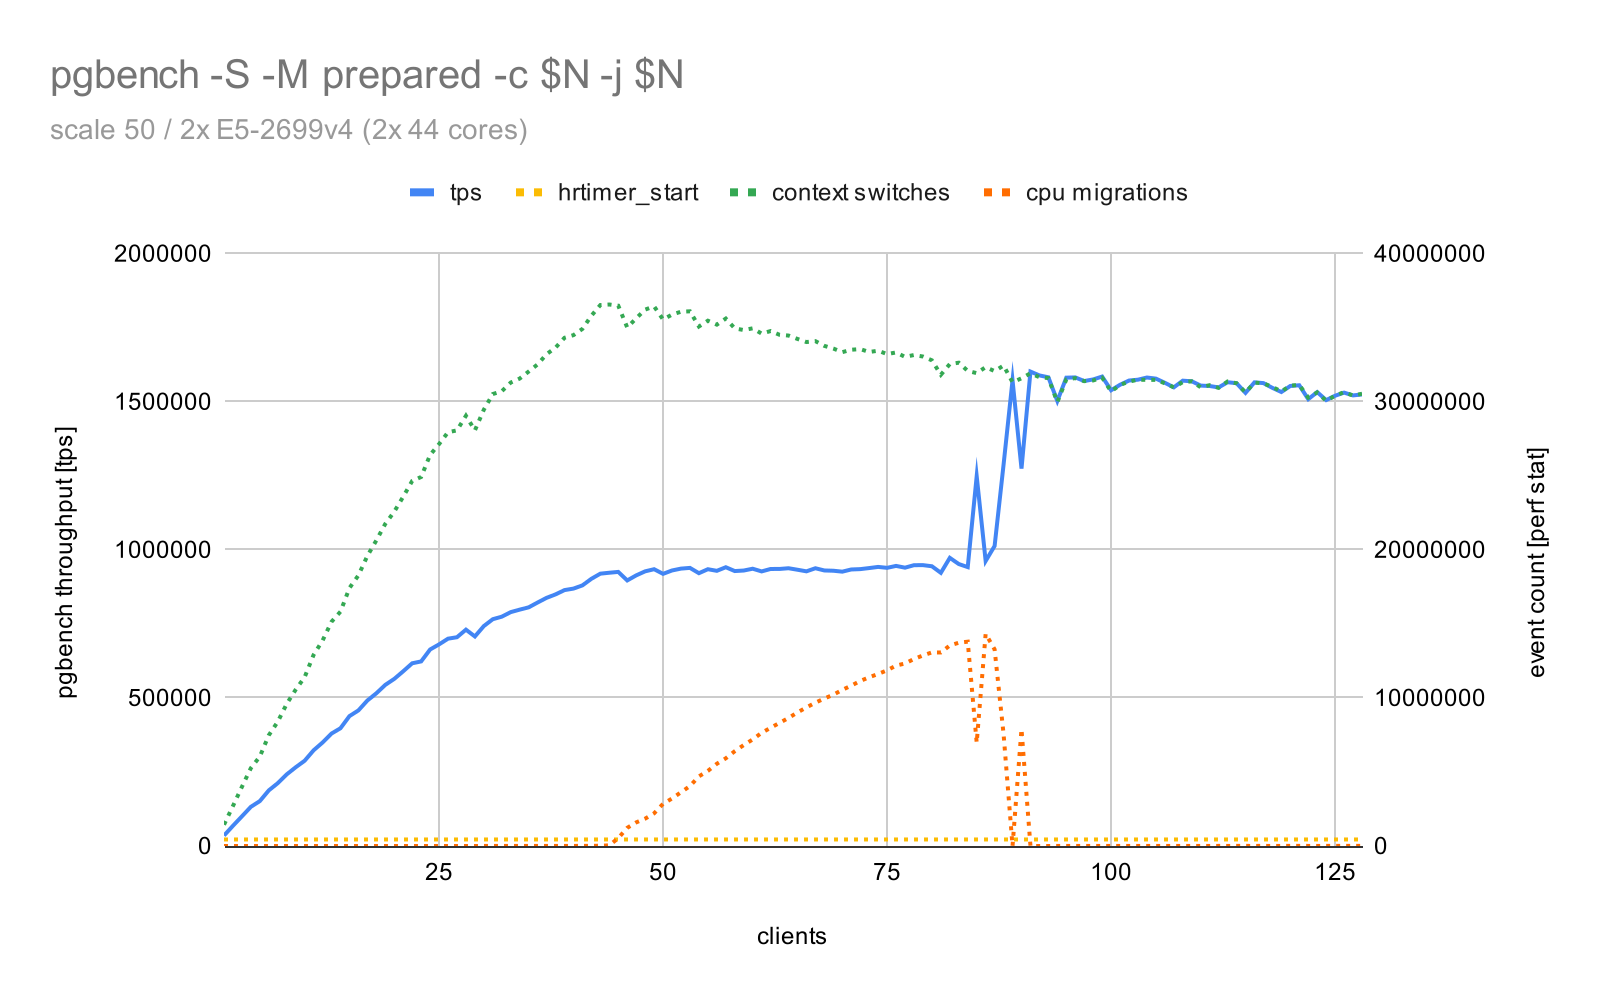
But even without ipi_send_cpu the behavior seems quite different from both EPYC systems.
I can understand that the throughput stops growing after ~40 clients, as the system only has 44 physical cores and HT does count as another full core. I’d expect at least some slow growth, but it just levels off and does not grow at all between 50 and 80 clients. But then the really weird thing happens, and at 88 clients the throughput suddenly increases by ~50%.
The transition between pinning strategies seems very similar:
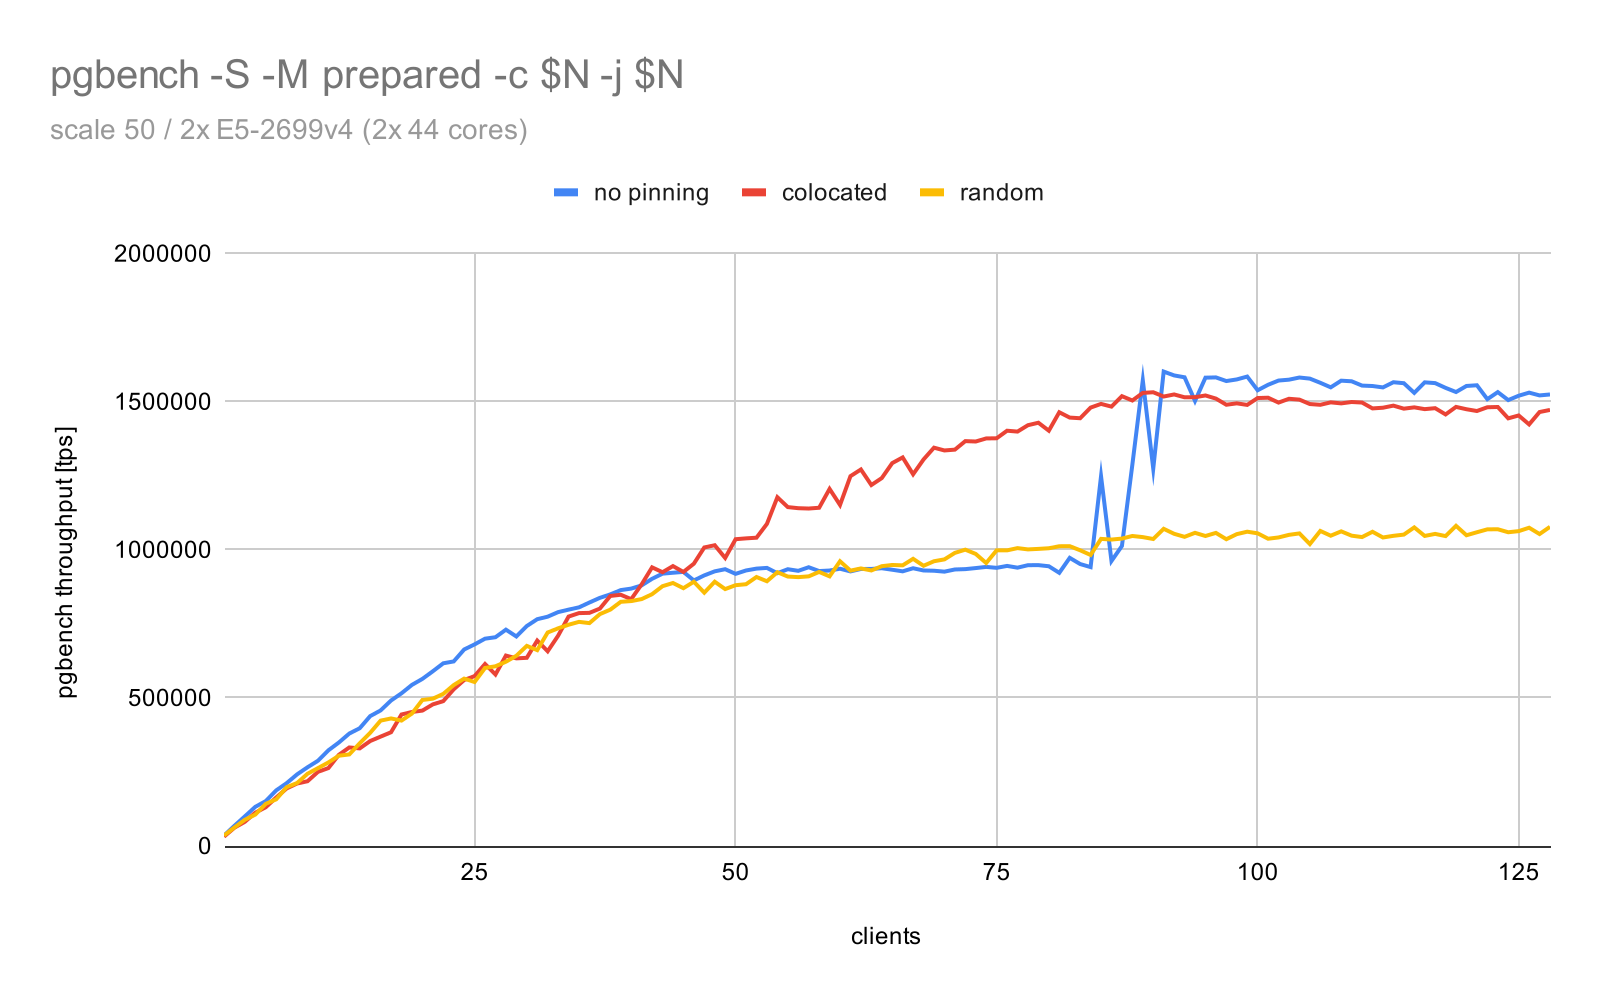
Could this be the same issue? Perhaps. But this is the only of the three machines where I have access to CPU governor, idle states etc. And the behavior does not change even if I disable idle states by
and that didn’t make a difference. So who knows.
Summary
This is all the details I have so far, and that I think may be relevant. If you need some additional data, let me know. I may already have them, or I’ll rerun the test to get it. Or perhaps you have an idea what to tweak?
I realize I haven’t properly explained why this particular issue bugs me this much. I do a fair bit of benchmarking and testing, either on my patches or patches from others, and this kind of behavior makes my life so much harder.
Imagine you optimize a piece of code, making it much cheaper. Everything looks great, all tests pass, CI is green. And then you run a benchmark, and the throughput drops by 50% compared to the non-optimized code. Simply because now the CPU gets “too idle”, and it takes a nap.
Or maybe you missed a performance issue while writing a patch? But it happens to be so expensive the cores no longer look quite idle, and the benchmark results got much better.
It may not be that bad, of course. The issue seems fairly narrow, and unlikely to affect actual production workloads. Most databases on such large boxes will process more expensive queries on larger amounts of data. Still, it’s surprising and annoying.
It’d be nice to know for sure what’s causing this. Then we could learn from that, and look for fixes or mitigations.
Do you have feedback on this post? Please reach out by e-mail to [email protected].
.png)


