content, reviewed by leading industry experts and seasoned editors. Ad Disclosure
On-chain data shows the Transfer Volume on the Bitcoin network has plunged since late May, a sign that trading activity has cooled off.
Bitcoin Total Transfer Volume Has Been Sharply Going Down
In its latest weekly report, the on-chain analytics firm Glassnode has discussed about how some volume metrics related to Bitcoin have recently changed. The first indicator shared by Glassnode is the Total Transfer Volume, which measures the total amount of BTC becoming involved in transactions on the blockchain.
Below is a chart for the metric that shows the trend in its value over the last couple of years.

As displayed in the graph, the Bitcoin Total Transfer Volume shot up to a high of $76 billion in late May, suggesting investors increased activity as the asset’s rally to the new all-time high (ATH) took place.
This trend isn’t anything unusual, as sharp price action tends to attract attention from the investors. In fact, it’s this fresh interest that helps keep such moves going.
Since the peak in late May, however, the indicator has been rapidly going down, a potential indication that the holders have been moving attention away from the cryptocurrency. At the lowest part of this drawdown, the metric reached $52 billion, around 32% down compared to the top.
From the chart, it’s apparent that this isn’t the first time that the Total Transfer Volume has seen this pattern of a large spike followed by a cooldown this cycle. After both the previous instances, Bitcoin saw consolidation/decline. Considering this trend, it’s possible that the latest slowdown in the asset’s price may also partially be down to the drop in the Total Transfer Volume.
As mentioned before, the Total Transfer Volume measures transfer activity occurring in any section of the network. Two particular parts of the sector, however, are where economic activity tends to congregate: spot and futures markets.
First, here is a chart that shows the trend in the volume specifically for the former:

Interestingly, while the last two rallies of the cycle saw a spike in Spot Volume, the latest Bitcoin run hasn’t seen any uptick. “This divergence further underscores the lack of speculative intensity, highlighting the market’s hesitancy and reinforcing the consolidation narrative,” notes the analytics firm.
Though, while spot activity has been missing from the rally, participants over at the futures market have still been engaged.

“This sustained speculative interest suggests that leverage-driven positioning was more influential in recent price dynamics,” says Glassnode. In the recent term, however, the Futures Volume has also been down, in line with the cooldown happening in the wider Bitcoin sector.
BTC Price
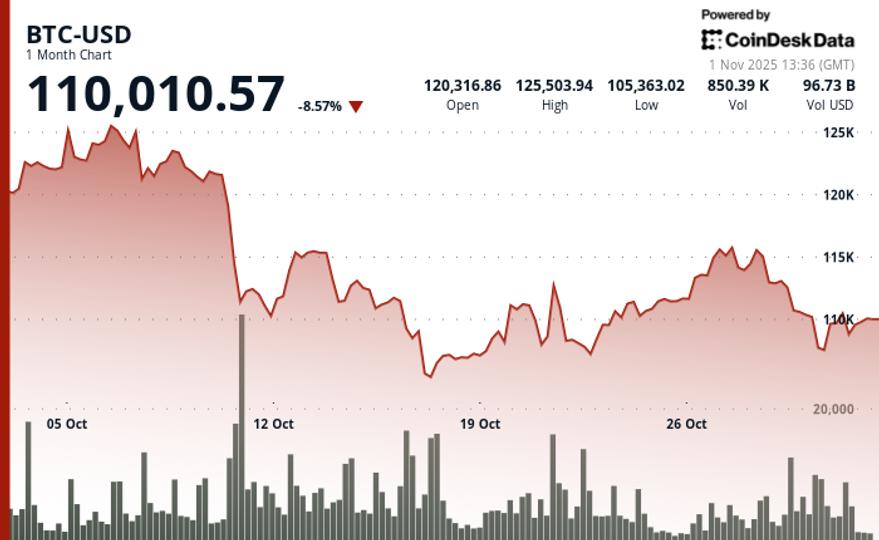
At the time of writing, Bitcoin is trading around $107,000, up more than 4% in the last week.
Featured image from Dall-E, Glassnode.com, charts from TradingView.com

Editorial Process for bitcoinist is centered on delivering thoroughly researched, accurate, and unbiased content. We uphold strict sourcing standards, and each page undergoes diligent review by our team of top technology experts and seasoned editors. This process ensures the integrity, relevance, and value of our content for our readers.
.png)


