.png)

Main
Glioblastoma (GBM), the most aggressive malignant primary tumor in the central nervous system, has recently been described as a systemic disease that affects primary and secondary immune organs, mainly through inducing thymic and splenic involution, recruiting myeloid cells and sequestering T cells in the femoral bone marrow (BM)1,2,3. The skull marrow (SM) has recently been characterized as a myeloid reservoir that supplies the brain with monocytes and neutrophils following induction of experimental autoimmune encephalomyelitis, stroke and other brain injuries4,5,6. Evidence for this immune influx and bidirectional cerebrospinal fluid communication between SM and the dura/brain surface was strengthened by the discovery of ossified vascularized channels, less than 100 µm in diameter, connecting the skull to the dura7. However, the nature and extent that GBM alters the SM homeostatic environment, and impacts its immune niche, has not been well studied.
Here we demonstrate that GBM activates bone erosion in the calvarium and increases the number and diameter of skull channels. The impact on the calvarium was specific to brain tumors, not being induced by other brain lesions such as stroke, mechanical injury or systemic cancers. Our findings were confirmed in humans and were not correlated with tumor size or location. We report differential changes in the immune landscape of SM and BM at a single-cell transcriptomics level (single-cell RNA sequencing (scRNA-seq)) and with proteomics using high-throughput flow cytometry. In the SM niche, we show that GBM induces a myelopoiesis bias dominated by expansion of all neutrophil subsets and deterioration of most B cell subsets. Comparing the immune landscape and pathway analysis of GBM on SM versus BM suggests that these two immune organs respond differently to brain tumors. Importantly, therapeutic targeting of bone remodeling, with two Food and Drug Administration (FDA)-approved drugs that block osteoclast (OC) activity in bone disease, enhanced tumor progression in GBM-bearing mice and abolished the survival benefit of the checkpoint inhibitor (CPI) anti-PD-L1 in the mesenchymal tumor SB28 without conferring any survival benefit in the GL261 model.
Results
GBM induces bone disruption and OC activity in several anatomical regions of the calvarium that delineate osteogenic edges adjacent to the skull sutures
To investigate whether GBM induces changes in the skull thickness and density, we established two murine glioma models, SB28 and GL261, in immune competent mice. SB28 exhibited a clear mesenchymal subtype signature while GL261 had a hybrid signature of proneural/mesenchymal subtype according to our 12-gene panel for subtyping8 (Extended Data Fig. 1). High-resolution micro-computed tomography (microCT) imaging revealed that both intracranial tumors induced bone resorption, reducing bone density and thickness (Fig. 1a and Extended Data Fig. 2a,b). Bone resorption was most prominent at the osteogenic edges, adjacent to the skull sutures, that are known to be fused at early childhood (at 1 week of age in mice, corresponding to 2 years of age in humans) and ossified during adulthood (at 4 weeks of age in mice, corresponding to 24 years of age in humans)9. These osteogenic edges adjacent to the skull sutures were recently reported to be connected to the underlying dura through ossified vascular channels that allow immune cell trafficking4,5,6,7. Interestingly, the occipital bone, far from the tumor site, had the highest degree of erosion (Fig. 1a,b). Calvarial bone resorption was specific to intracranial tumor and absent in the subcutaneous GBM model. In addition, sham injury, fibroblast injection (mouse embryonic fibroblasts) or stroke lesions had no impact on the skull. In contrast, when the 4T1 breast cancer cells were intracranially injected, calvarial erosion was induced but with a different pattern (Extended Data Fig. 2c), suggesting the importance of the tumor origin. In both intracranial models of GL261 and SB28, both bone density and thickness were significantly reduced at all measured points, except bone density at mid-occipital (Fig. 1a,f,g). Furthermore, SB28 tumors induced greater bone resorption activity than did GL261 tumors, with wider demineralization in the skull above the tumor, and, interestingly, mineralization within the tumor itself (Fig. 1c). Bone resorption started in the midline at early-stage tumor (half-time), being evident by day 10 after tumor injection in SB28 and day 14 in GL261 tumors (Fig. 1d,e and Extended Data Fig. 2a). Taken together, these data suggest that GBM, but not other brain lesions or systemic tumors, induces bone resorption and OC activity, even at anatomical regions distal to the tumor site.
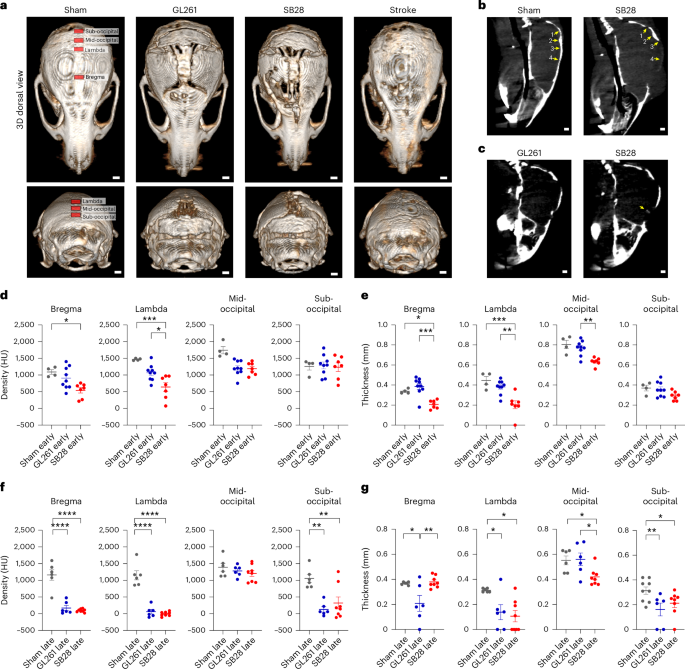
a, microCT imaging showed that GBM induced bone erosion in the skull mainly at the osteogenic edges adjacent to the skull sutures. Tumor was sterotactically injected in frontal lobe, and the occipital bone, far from tumor site, showed the highest erosion. b, Established criteria to measure skull density and thickness at defined anatomical regions indicated by arrows (bregma, lambda, mid-occipital, sub-occipital). c, SB28 tumor had calcification within the tumor as visualized by microCT. d, Statistical analysis of bone density showed significant reduction in bregma and lambda at early-stage/half-time tumor as compared with sham. SB28 had higher erosion extent than GL261. e, Statistical analysis of bone thickness showed significant reduction of bone thickness in lambda, bregma and sub-occipital in SB28 tumors and to lesser extent in GL261 at early-stage/half-time tumor. f, Statistical analysis of bone density showing significant reduction of bone density in bregma, lambda and sub-occipital in last-stage tumor. g, Statistical analysis of bone thickness showing significant reduction of bone density in lambda and sub-occipital in both SB28 and GL261, in addition to SB28 mid-occipital. Number of animals in statistics: in d,e, early-stage/half-time (4 mice sham; 9 mice GL261; 7 mice SB28); in f,g, late-stage tumor (6 mice sham; 6 mice GL261; 8 mice SB28). Data are presented means ± s.e.m. In d–f, significance was assessed by a one-way ANOVA with Tukey’s multiple comparison test (*P < 0.05; **P < 0.01; ***P < 0.001; ****P < 0.0001). See Supplementary Fig. 2. Scale bars: 1,000 µm. HU, Hounsfield unit.
GBM induces specific bone morphometry changes in the calvarium and increases skull channels
To perform bone morphometry analysis and to quantify the changes in skull channels, we performed high-resolution (9 µm) microCT at early and late stages of tumor progression. The analysis was focused on the occipital bone to avoid the impact of surgery site or mechanical pressure related to tumor mass, bearing in mind that bone disruption in this region initiated in early-stage tumors, suggesting an early crosstalk between tumor and occipital region (Fig. 2a). The region of interest in the occipital bone is demarked by the lambdoid sutures and external occipital protuberance to enable exact comparison between animals from different groups. The inner table and outer plate represent the cortical bone in the occipital region, while the diploe represents the porous trabecular bone (see the Methods for details).
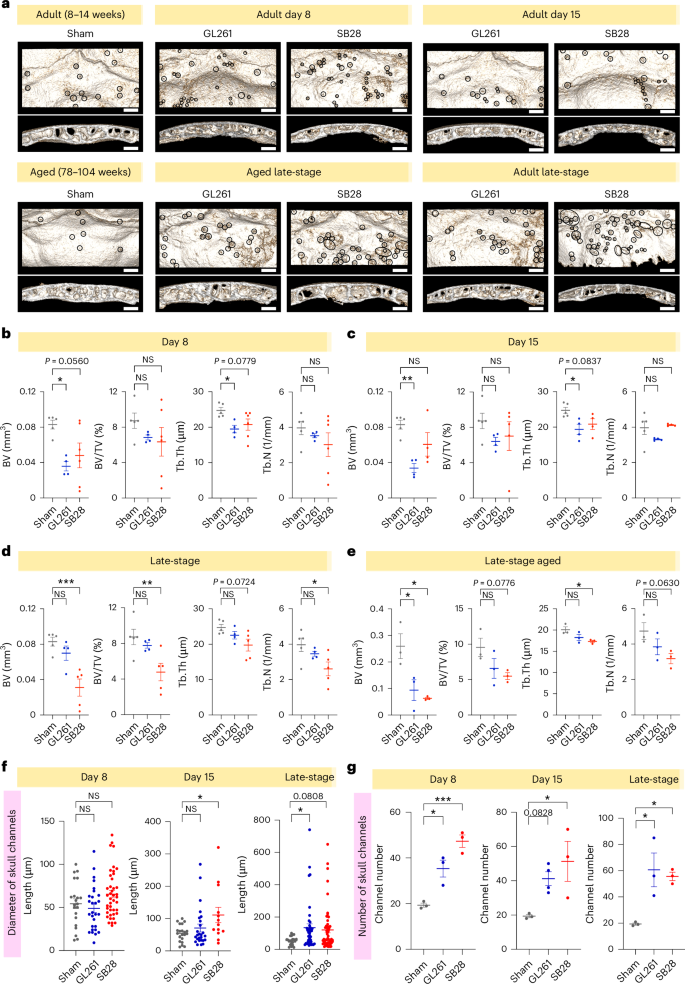
a, High-resolution microCT (9 µm) of dissected skull from two GBM models (GL261 and SB28), during early-stage (day 8, day 15) and late-stage tumor progression. Aged mice (78–104 weeks) were used for late-stage only. Occipital bone distant from tumor site was visualized with skull channels highlighted and used for bone morphometry analysis. b–e, Statistical analysis of bone morphometry showing significant reduction in BV and Tb.Th in GL261 at days 8 and 15, and in late-stage SB28. Number of animals in statistics: b, day 8 (5 mice sham; 4 mice GL261; 6 mice SB28); c, day 15 (5 mice sham; 4 mice GL261; 4 mice SB28); d, late-stage tumor (5 mice sham; 4 mice GL261; 5 mice SB28); e, aged late-stage tumor (3 mice sham; 3 mice GL261; 3 mice SB28). Data are presented means ± s.e.m. In b–e, significance was assessed by a one-way ANOVA with Tukey’s multiple comparison test (*P < 0.05; **P < 0.01; ***P < 0.001; ****P < 0.0001). f, Statistical analysis quantification of the skull channel diameters at early-stage (day 8 and 15) and late-stage tumor. Three animals per cohort (except GL261 day 15) were used for each of the experimental groups (day 8, day 15 and late-stage). Data are presented means ± s.e.m. One-way ANOVA with Tukey’s multiple comparison test (*P < 0.05; **P < 0.01). g, Statistical analysis of skull channel counts showing significant increase for early-stage and late-stage tumors, GL261 and SB28. Three animals per experimental group (except GL261 day 15 were 4 animals). Data are presented means ± s.e.m. One-way ANOVA with Tukey’s multiple comparison test (*P < 0.05; **P < 0.01). Scale bars: 500 µm. NS, not significant.
Adult (8–12 weeks) and aged (78–104 weeks) mice were used. Statistical analysis showed that GBM already reduced bone volume (BV) by day 8 and this remained significant at day 15 in GL261, while this last one rebounded in late-stage tumor (Fig. 2b–d). In SB28, BV tended to decrease by day 8 and day 15 and reached a significant level in late-stage. However, the aged mice exhibited significant BV reduction in both late-stage tumor models (Fig. 2e). The bone volume/total volume (BV/TV) also tended to decrease at all stages but reached a significant level in late-stage SB28 only. For trabecular bone thickness (Tb.Th), the reduction pattern was evident in both tumor models, reaching a significant level in both early-stage and late-stage SB28 (Fig. 2b–d), and tended to be significant in SB28 aged mice (Fig. 2e). The trabecular bone number (Tb.N) tended to be reduced at early stages in both tumors, but it rebounded in SB28 by day 15, then continued to reduce in late-stage SB28, although not to a significant level. In GL261, the rebound occurred in late-stage tumor, in both adult and aged mice, without reaching a significant difference (Fig. 2b–f).
To investigate whether these changes were specific to the skull or whether GBM affected other bones similarly, similar analyses were performed on femurs dissected from the same mice included in the skull imaging (Extended Data Fig. 3a). Contrary to the skull, femur BV significantly increased by day 8 in SB28, and in late-stage GL261. In addition, BV/TV and Tb.N were increased by day 15 in GL261 and in late-stage SB28, but only Tb.N was significantly higher at both day 8 and day 15 in GL261 (Extended Data Fig. 3b–d). This suggests that GBM induces differential changes in bone structure and density in the skull compared with femurs. Finally, quantification of skull channels highlighted in Fig. 2a revealed a significant increase in the channel diameter by day 15 in SB28 and in late-stage GL261 (Fig. 2e), while their numbers demonstrated a significant increase in all tumor stages (Fig. 2f). These observations suggest that GBM affects the skull-dura channels in the occipital bone far from the tumor location by increasing their number and diameter.
The calvarial suture lines in patients with GBM had reduced thickness compared with age- and gender-matched controls without brain tumors and such changes were not affected by tumor size
To investigate whether GBM affects calvarial bone in humans, we used a restricted publicly available computed tomography (CT) dataset of The Cancer Imaging Archive (TCIA). Age- and gender-matched controls were mainly patients with strokes, hematoma, aneurysm, epilepsy and subarachnoid hemorrhage from our institute. The TCIA dataset (TCGA-GBM, TCGA-LGG, CPTAC-GBM, RTOG 0625/ACRIN 6677) included 26 patients with GBM with available CT scans as less than 10% of patients with GBM undergo CT imaging (accessed 27 September 2023). Image analysis was performed on these 26 patients with GBM (Extended Data Table 1). In addition, 22 age- and gender-matched controls were used after excluding any cancer history. However, age and gender had no significant correlation with the skull thickness in the control set except that the mid-occipital was thicker in females compared with in males (P < 0.0001). As the human skull is very different from that of a mouse, we included extra points to precisely compare the anatomical areas between subjects with tumor and controls (Fig. 3a,b). We used the crossing point of right and left midorbital axes with coronal sutures, in addition to bregma point, lambda and mid-occipital which we had used in the mice. The reduction in skull thickness was most significant at lambda and mid-occipital (P < 0.0001), followed by bregma, left and right midorbital–coronal axes intersection (P < 0.001, P < 0.01, P < 0.5, respectively) (Fig. 3c). The increased thickness seen at mid-occipital in females versus males disappeared in response to GBM, although the difference at right midorbital–coronal axes intersection was significant in the presence of GBM (P < 0.05) (Extended Data Fig. 4). However, no significant change was evident in bone density (Fig. 3d). Analyzing CT bone thickness with respect to tumor location, no significant differences were noticed, except the lambda in left frontal tumors was thicker than in right frontal tumors (Extended Data Fig. 5). To investigate the impact of tumor size on calvarial bone thickness, T1-weighted gadolinium-enhanced magnetic resonance imaging (MRI) images were volumetrically analyzed (axial, sagittal or coronal axis view) with maximum number of image slices per volume. The contrast-enhanced regions of the tumor were delineated, segmented and correlated with bone thickness. Of 26 patient scans used in CT analysis, 21 were available for MRI analysis and showed no significant correlation between tumor volume and calvarial thickness (Fig. 3e). We thus found that patients with GBM exhibit reduced skull thickness at specific anatomical locations of the calvarial sutures and these changes were not correlated with tumor size.
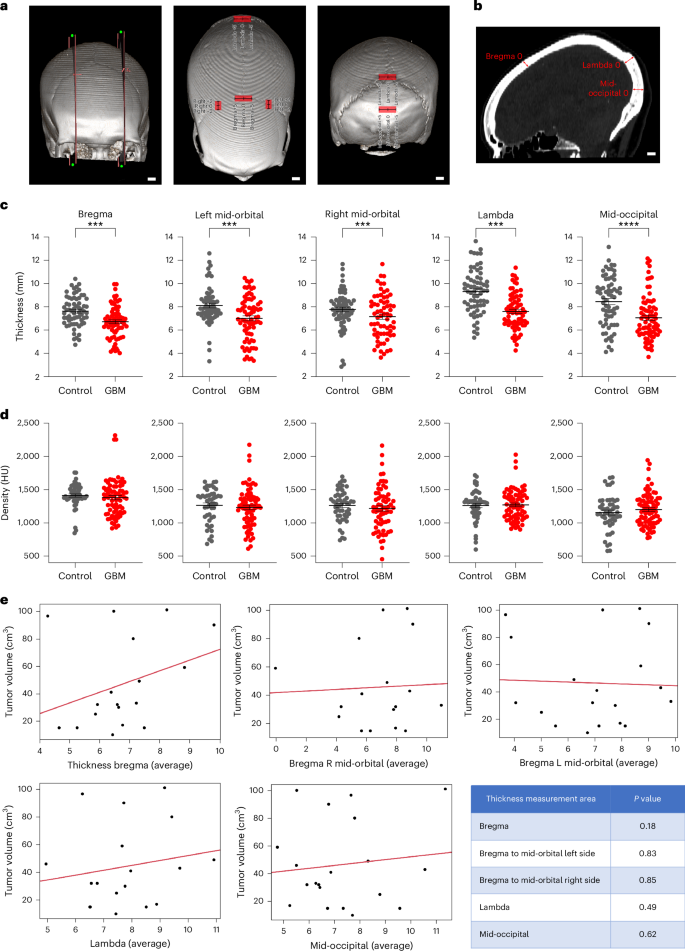
CT of patients with GBM and control patients without any tumor history (majority were stroke, subdural and subarachnoid hemorrhage, hematoma and epilepsy) were used for the analysis. a, Representative 3D visualization of the five anatomic areas that were analyzed for bone thickness and density. b, Sagittal CT section pointing to anatomic areas used in the analysis. c, Reduction in skull thickness was highly significant in lambda and mid-occipital, followed by crossing point of midorbital axes and bregma. d, The change in bone density was not significant. In c and d, sample size was 26 patients with GBM and 22 age- and gender-matched controls. Data are presented as means ± s.e.m. Significance was assessed by Mann–Whitney U test (*P < 0.05; **P < 0.01; ***P < 0.001; ****P < 0.0001). e, Linear fit model for tumor volume (cm3) and bone thickness on average measurements of bregma thickness, bregma to midorbital left side, bregma to midorbital right side, lambda and mid-occipital (3 measurements in mm). See also Supplementary Fig. 3. Student’s t-test was used for analyzing volume against bone thickness. A P value < 0.05 was set as statistical significance (*P < 0.05; **P < 0.01; ***P < 0.001). Scale bars: 10 mm.
GBM induces dynamic changes in the calvarial TRAP/Acp5+ OCs
Bone resorption is a biological process mediated by OCs, a specialized immune cell of macrophage/monocyte origin. To investigate whether OCs in the skull undergo numerical or anatomical distribution changes, we used a fluorescent reporter mouse expressing tdTomato under the endogenous TRAP/Acp5 promotor10. These mice were injected with either GL261 or SB28. Light sheet imaging of the entire skull was used to give an overview of OC distribution during tumor progression. A dense OC cluster was evident in the frontal calvarial bone at day 8, while parietal bone above tumor showed concentrated clusters in late-stage tumor (Fig. 4a, Extended Data Fig. 6 and Supplementary Videos 1–3). To exclude any potential contribution of postmortem artifacts, we used intravital multiphoton imaging. To follow the dynamic changes in OC numbers, we performed a longitudinal study in which we killed mice at an early stage of tumor development (8 d), half-time (15 d) or late-stage, defined by exhibiting intracranial tumor symptoms (3–5 weeks). To avoid the impact of intracranial surgery and tumor growth, only parietal and occipital bones were analyzed. The imaging window was focused in the contralateral side from bregma to lambda. A significant reduction in OC numbers was noted in late-stage brain tumors (Fig. 4b). The distance between neighboring cells was also increased in both GL261 and SB28 at late-stage compared with sham, being wider in SB28 compared with GL261 (Fig. 4b). We classified the OCs into three types according to their size (Fig. 4c). The automatically extracted cell volume divided by three-dimensional (3D)-imaging area revealed a significant reduction in OC cell density in both tumors compared with in sham (Fig. 4d,f). The quantification of cell size and pattern of distribution showed that the small size and big size cells significantly decreased 8 d and 15 d after tumor initiation, then increased in late-stage GL261 tumor. The small size cells became even higher than in the sham control group. The number of big cell clusters decreased after 8 d and 15 d, then rebounded, but this increase was not significant compared with sham (Fig. 4e). In SB28 tumors, a significant decrease was already apparent by day 8 in all three cell types. Although a resurgence was recorded in the intermediate and big size cells by day 15, this increase was not significant compared with day 8 (Fig. 4g). These data suggest that GBM induced dynamic changes in OC cell density and distribution in the skull.
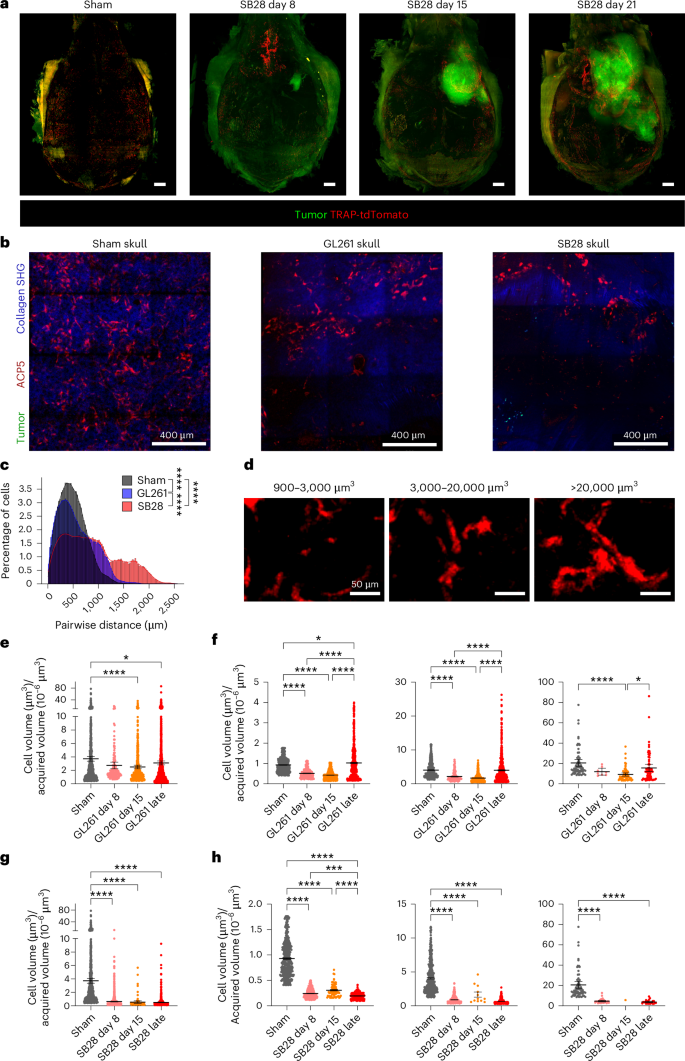
a, A representative light sheet imaging of SB28 showing segmented OC volume during tumor progression (day 8, day 15 and late-stage tumor). Red signal, OCs expressing TRAP-tdTomato; green, tumor cells. Scale bar: 1,000 µm. b, A representative maximum intensity projection of intravital multiphoton microscopic tiling of skull in TRAP-tdTomato transgenic mice. The skull of the same contralateral side was imaged in sham animal, GL261 and SB28 tumor. Red signal, OCs expressing TRAP-tdTomato; blue, bone tissues; green, tumor cells (crossed to contralateral hemisphere in SB28). Scale bar: 400 µm. Experiment was repeated four times. c, Distance between neighboring OCs was increased in both GL261 and SB28, and to a higher extent in SB28 than GL261 suggesting major loss of OC number in SB28. The distance between every pair of segmented OCs was calculated and the distribution was plotted. The OCs were divided into three groups according to their size: 900–3,000 µm3, small cells; 3,000–2,0000 µm3, big cells; >20,000 µm3, cell cluster. d, Representative images of segmented OCs in the skull classified according to their size. The OCs were divided into three groups according to their size: 900–3,000 µm3, small cells; 3,000–20,000 µm3, big cells; >20,000 µm3, cell cluster. e, GL261 tumors induce a decrease in skull OC numbers at days 8 and 15, and a resurgence in late-stage tumor. A longitudinal quantification in GL261 skull showed that the OC numbers declined significantly at early-stage (day 8) and half-time (day 15) of tumor progression compared with sham (P < 0.0001), then rebounded and increased in numbers significantly in late-stage tumor compared with days 8 and 15 (P < 0.0001), but still less than sham control (P < 0.05). OCs were calculated as areas of OCs per imaging area (mean = 3.72 sham; 2.737 GL261 day 8; 2.503 GL261 day 15; 3.102 GL261 late-stage). f, Quantification of segmented cells in GL261 skull according to their size showed that all three types were significantly decreased at days 8 and 15, compared with sham skull, then rebounded and increased in number during the late-stage of tumor progression to be higher than day 15 in all three subsets (P < 0.0001 for small and big size cells, P < 0.05 for cell cluster), but it was significant only for small size cells compared with sham skull. g, SB28 tumors induce a decrease in skull OC numbers during tumor progression, with a small resurgence at day 15. A longitudinal quantification in SB28 skull showed that the OC numbers declined significantly at early-stage (day 8) and half-time (day 15) of tumor progression compared with sham (P < 0.0001). All three types of tdTomato+ cells were significantly decreased in number compared with sham skull (mean = 3.720 sham; 0.6348 SB28 day 8; 0.5491 SB28 day 15; 0.5068 SB28 late-stage). h, Quantification of segmented cells in SB28 skull according to their size showed that all three types were significantly decreased at days 8 and 15 and late-stage compared with sham skull. A resurgence was recorded in the big size and cell cluster by day 15, but all three types of tdTomato+ cells were significantly decreased in number compared with sham controls (P < 0.0001). Multiphoton images used in c–h were collected from four times repeated experiments, 12 tiling images from: day 8, 3 mice GL261; 3 mice SB28; day 15, 3 mice GL261; 3 mice SB28; late-stage, 6 mice GL261; 4 mice SB28; and 3 mice sham. Data are presented as means ± s.e.m. Significance was assessed using a one-way ANOVA with Tukey’s multiple comparison test (*P < 0.05; **P < 0.01; ***P < 0.001; ****P < 0.0001). See also Supplementary Fig. 6. SHG, second harmonic generation.
GBM alters the immune landscape of SM
To perform deep molecular profiling of immune cells in the SM and to investigate the impact of GBM on SM and BM, we optimized a protocol to isolate cells from the skull and long bones and performed integrated scRNA-seq analysis. Our scRNA-seq datasets of sham SM (representing SM of healthy animal in homeostatic condition), sham BM, and SM and BM from SB28 and GL261 tumor-bearing mice were integrated. Cells originating from sham SM, GL261 SM, SB28 SM, sham BM, GL261 BM and SB28 BM were visualized in two dimensions by uniform manifold approximation and projection (UMAP) (Fig. 5a,b). CD45+ cells constituted 75.6% of the total cells in sham SM, 91.3% in GL261 SM and 90% in SB28 SM, while for BM, CD45+ made 76.4%, 89.5% and 91.5% of sham, GL261 and SB28, respectively (Supplementary Table 1).
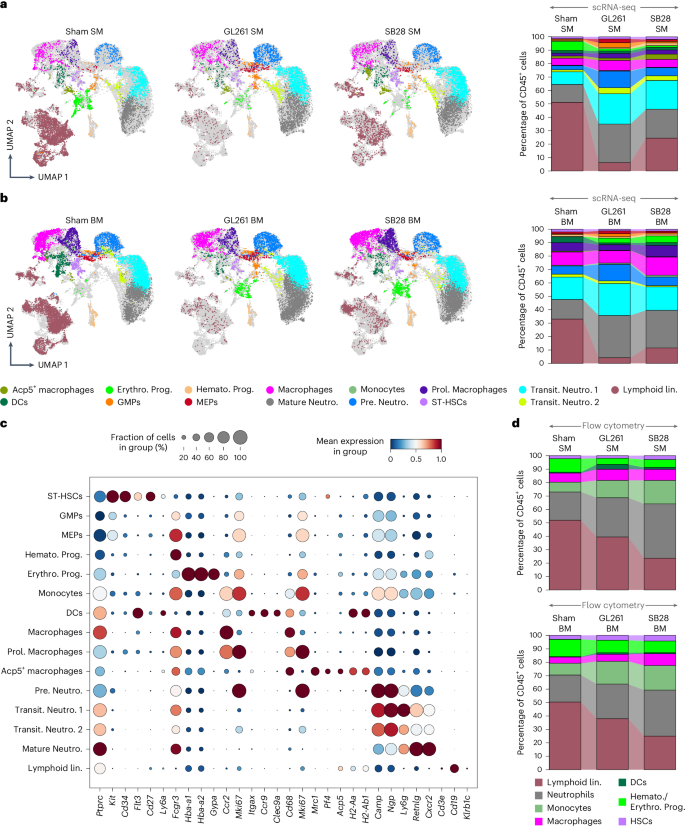
a,b, 2D UMAPs and stacked bar charts visualizing the main myeloid cell populations within CD45+ cells in the SM and BM of sham control compared with GL261 and SB28 derived from scRNA-seq. a, In homeostatic SM, neutrophil subsets made up the largest myeloid populations, with Mature Neutro. and Transit. Neutro. 1 being the majority, and they almost doubled in response to GBM, whereas Pro. Neutro. increased twice to reach 8% in SB28 and four times in GL261 (16%). Prol. Monocytes, macrophages, Acp5+ macrophage, MEPs and GMPs made up a small subset of 0.2–4% which also increased in response to GBM, except for macrophages in SB28 SM, and DCs stayed almost the same (~2%) in SM. b, In sham BM, similar to SM, neutrophil subsets made the largest cell population, but with some differences including: Pre. Neutro. was the largest population in sham BM, slightly increased in GL261 BM and decreased in SB28 BM, whereas Mature Neutro increased three times, and Transit. Neutro. 1 doubled in GL261, but was only slightly elevated in SB28 BM. MEPs and GMPs as well ST-HSCs and Hemato. Prog. in BM were reduced in response to GBM, opposite to their population in SM, whereas Erythroid. Prog. increased in BM and decreased in SM. c, A dot plot depicting normalized expression of different marker genes used to annotate individual cell clusters within the myeloid lineage. Gene markers are shown on the x axis and cell types on the y axis. d, Flow cytometry analysis confirming that GBM alters the SM and BM homeostasis, pushing it towards myelopoiesis. Spectral flow cytometric analysis of CD45+ population in sham SM, GL261 SM and SB28 SM (top) as well as in sham BM, GL261 BM and SB28 BM (bottom). FACS analysis further recapitulated and validated the increase in percentage of neutrophils in the SM and the concurrent decrease in percentage of the lymphoid compartment. Lin., lineage.
To define the cell identity of obtained clusters, an immune cell marker panel was created by combining literature searches11,12,13. We identified 13 clusters in the myeloid lineage (Fig. 5a–c) and 12 clusters in the lymphoid lineage (Fig. 6a–c), in addition to hematopoietic stem cells (HSCs) and erythroid progenitors (Supplementary Table 1). The frequency differences and functional properties of major cell types were confirmed by flow cytometry, comparing sham SM versus SB28 SM/GL261 SM and sham BM versus SB28 BM/GL261 BM (Figs. 5d and 6d, Extended Data Figs. 7–9 and Supplementary Figs. 1 and 2). The gating strategy is presented in Supplementary Fig. 2. Surprisingly, a global distortion was observed in SM hematopoietic compartments in both lymphoid and myeloid lineages, shifting the niche toward myeloid predominance (Fig. 5a,b and Supplementary Table 1). To simplify the changes among SM hematopoietic cells in response to GBM, we studied myeloid and lymphoid subsets separately.
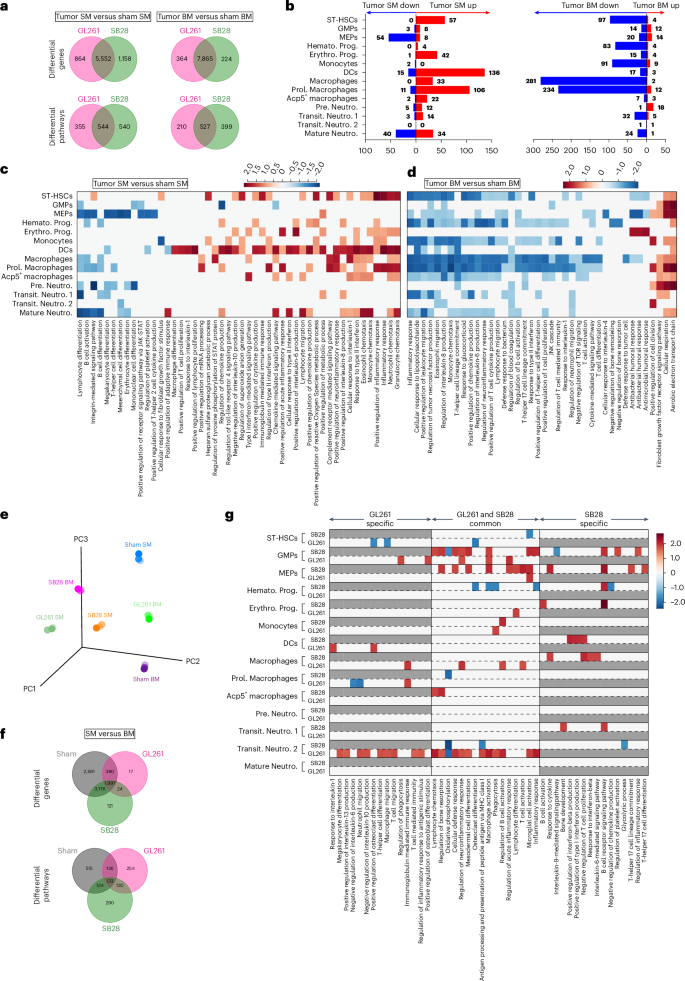
a, Venn diagrams showing DEGs and differential pathways induced by two GBM models, GL261 and SB28, in SM as well as BM compared with sham SM and sham BM, respectively. GL261 and SB28 induced common as well as tumor-specific DEGs and pathways in both SM and BM. pyDESEQ2 was used to identify DEGs in all cell clusters. Venn diagram depicts DEGs with more than 1.2-fold change in upregulation/downregulation. For pathway enrichment, GSEA was used to identify enriched GO pathways and only pathways having FDR Q value less than 0.25 were retained for analysis. b, Stacked bar charts showing significantly upregulated and downregulated pathways induced in each cell type by both GL261 and SB28 in SM (left) and BM (right). There was overall upregulation of pathways in SM while BM had downregulation across most cell types. Prol. Monocytes in SM observed most downregulated pathways while Transit. Neutro. 2 in BM observed most upregulated pathways. c, A heatmap depicting NES of select pathways that were downregulated or upregulated across different cell types in SM in response to both GL261 and SB28. Average NES combined from GL261 and SB28 is plotted. d, A heatmap depicting NES of select pathways that were downregulated or upregulated across different cell types in BM in response to both GL261 and SB28. Average NES combined from GL261 and SB28 is plotted. e, 3D PCA plot showing pseudo bulk transcriptomic profile of different samples. Each sample was randomly split into three pseudo replicates and raw counts were summed for each gene to generate bulk RNA profiles with three pseudo replicates for each of the samples. pyDESEQ2 was used to analyze these bulk RNA profiles and normalized counts were then used to perform PCA. Subsequently, the first three principal components were plotted in 3D space. f, Venn diagrams showing DEGs and differential pathways between SM and BM in sham, GL261 and SB28. Sham SM had a significant number of DEGs as well as differential pathways compared with sham BM which remained differential even in the presence of tumor. SB28 induced more DEGs as well as differential pathways compared with GL261. pyDESEQ2 was used to identify DEGs in all cell clusters. Venn diagram depicts DEGs with more than 1.2-fold change in upregulation or downregulation. For pathway enrichment, GSEA was used to identify enriched GO pathways and only pathways having FDR Q value less than 0.25 were retained for analysis. g, A heatmap depicting NES of select pathways that were downregulated or upregulated across different cell types in SM versus BM. NESs for both GL261 and SB28 are plotted unless a pathway is specific only to GL261 or SB28. Gray boxes depict nonenrichment of a pathway in a given cell type and condition. NES, normalized enrichment score.
GBM triggers differential expansion of the myeloid lineage in SM versus BM
The myeloid lineage composed ~41% in sham SM and increased to 90% and 72% in SM of GL261 and SB28, respectively, whereas BM consisted of 67% myeloid cells which increased to 91% and 82% in GL261 and SB28, respectively (Fig. 5a,b).
This myelopoiesis dominancy was driven by neutrophils which composed the largest myeloid population in homeostatic SM (28.2%) and almost doubled in response to GBM (68.2% in GL261 and 52.5% in SB28) (Fig. 5a,b and Supplementary Table 1). Neutrophils comprised four main subpopulations, with Mature Neutro. (defined as Camp-lo/NoNgp-lo/NoLy6g-hiRetnlg-hiCxcr2hi) being the largest cell population (13.3%) which almost doubled in response to GL261 and SB28 (28.7% and 21.8%, respectively). Pre. Neutro. (pre.neutrophils) (Camp-hi, Ngp-hi, Ly6g-loRetnlg-loCxcr2lo) and Transit. Neutro. 1 (transit neutrophils) (Camp-No, Ngp-No and Ly6g-hiRetnlg-loCxcr2lo) expanded twice in SB28, but to a much greater extent than in GL261 (2–4 times compared with sham SM). In sham BM, the Mature Neutro. and Transit. Neutro. 1 represented the biggest populations of CD45+ cells (14–16%) and underwent differential changes in response to tumor type, with the first one being increased to 28% in SB28 and 31% in Gl261, whereas Transit. Neutro. 1 increased to 17.4% in SB28 and to 23.7% in GL261. The Pre. Neutro. were ~6% in sham BM and expanded almost two times in response to GL261, but did not change in SB28 tumors (Fig. 5a–c and Supplementary Table 1). Furthermore, brain tumors led to an increase in Prol. Macrophages (proliferative macrophages), Hemato. Prog. (hematopoietic progenitors) and MEPs (megakaryocyte–erythroid progenitor cells) in the SM, but not in BM. Monocytes, which made up 0.5% in sham BM, increased to 1% in GL261 BM and 1.3% in SB28 BM. While Acp5+ macrophages increased from 1.7% to 3.8% in SB28 SM, their frequency did not change in GL261 SM, but they were highly reduced in the BM in both tumor models (dropped from 0.5% to 0.2%) (Fig. 5e). The ST-HSC (short term-HSC) population (~1.4% of total CD45+ in SM and 2% in BM) was defined as cKit+CD34+Flt3+CD27+Sca-1Lo (Fig. 5a–c and Supplementary Table 1). The high expression of CDK6 in this cluster suggested that these were short-term HSCs (not quiescent) rather than long-term HSCs14. ST-HSC numbers were increased in SB28 SM from 1.4% to 2%, but did not change in GL261 SM. Hemato. Prog. were defined as Ly6c2+Ccr2+Stmn1+Mki67+, which existed in sham SM (0.7%) and increased to 2% in response to SB28, and to a lesser degree in GL261, 0.9%. Both ST-HSCs and Hemato. Prog. were reduced by almost ~50% in BM of both tumors. The Erythro. Prog. (erythroid progenitor) cells expressed Gypa, Alas2 and hemoglobin genes (Hba-a1/2, Hbb-bs and Hbb-bt) and existed in sham SM (6.8%), and decreased to ~1.6% in GL261 SM and 1.2% in SB28 SM, whereas they increased in BM, from 0.2% in sham BM to 3.5% in GL261 BM and 5% in SB28 BM (Fig. 5a–c and Supplementary Table 1).
The differentially expressed gene (DEG) analysis comparing tumor SM with sham SM showed 5,552 shared genes between SM of both tumor types, GL261 and SB28, with 864 genes specific to GL261 and 1,158 specific to SB28 (Fig. 6a). The pathway analysis showed that the myeloid lineage expansion in the SM of both tumors had 544 shared pathways, which were dominated with upregulated genes related to immune response and proliferation in most cell clusters, including ST-HSCs, GMPs (granulocyte-monocyte progenitors), Hemato. Prog., Erythro. Pro., monocytes, DCs (dendritic cells), macrophages, Acp5+ macrophages and Pre. Neutro. (Fig. 6b,c and Supplementary Table 1), whereas the BM had 527 shared pathways dominated with downregulated genes in most cell clusters, except for Pro. Neutro. (pro.neutrophils) and Prol. Macrophages. (Fig. 6b,d). Semantic clustering of enriched gene ontology (GO) terms revealed inflammatory response, proliferation and angiogenesis, DNA replication and migration as commonly occurring GO themes (Supplementary Figs. 4 and 5). The inflammatory and immune response pathways in SM showed upregulation of several pathways, such as positive regulation of macrophages, monocytes, response to type II interferon, positive regulation of neutrophil migration and others (Fig. 6c). Conversely, downregulated pathways related to type II interferon response, IL-1 response, monocyte chemotaxis, B cell proliferation and others, and were evident in BM (Fig. 6d).
Furthermore, to investigate whether SM and BM are different niches and respond differently to the same type of tumor, we compared side-by-side SM versus BM from GL261 and SB28. Principal component analysis (PCA) of pseudobulk scRNA-seq profiles showed that sham SM and BM are different and remain different in response to GL261 while clustering away from sham (Fig. 6e). In contrast, SB28 brought them closer in the PCA space. There were 2,691 DEGs between sham SM versus sham BM, 1,997 of which stayed among DEGs in response to different tumor types, GL261 or SB28, representing 133 differential pathways across all conditions and suggesting SM and BM keep these differences even with existing tumor condition (Fig. 6f). SB28 SM versus BM seemed to have higher DEGs and differential pathways shared with sham SM versus BM than GL261, suggesting GL261 affected SM and BM in a more similar way than SB28 (Fig. 5e–g). Comparison of SB28 SM versus BM showed higher DEGs and pathways specific to the tumor model than GL261, suggesting that SB28 induced a more specific disturbance in the myeloid lineage of SM and BM than did GL261 (Fig. 5e–g). In SB28 SM versus BM, MEPs, Erythro. Prog., macrophages and Acp5+ macrophage clusters seemed to be enriched, with upregulated immune response and activation, in addition to OC activation in Acp5+ macrophages. In contrast, in GL261 SM versus BM, most differential pathways were upregulated in GMPs, macrophages, Pre. Neutro. and Hemato. Prog (Fig. 5g). The functional characterization of the main myeloid populations via flow cytometry showed that macrophages and DCs from BM and SM had higher expression of MHC-II+, suggesting an increase in antigen presentation under tumor condition (both SB28 and GL261), whereas IL-10 was significantly increased in macrophages in the SB28 tumor, but not in GL261 (Extended Data Figs. 7 and 8a,b). Conversely, DCs from this last one showed higher expression of PD-L1 in both BM and SM compared with sham, and only higher IL-10 in SM DCs (Extended Data Fig. 8c,d). Proliferating neutrophils were significantly higher in the SM but not in the BM of GL261, while proliferating monocytes were higher in both BM and SM of GL261 (Extended Data Fig. 9a–d). In the SB28 model, the total number of neutrophils was significantly higher compared with sham SM, but KI67 did not reach a significant level, while both proliferating monocytes and proliferating DCs were significantly higher in SM, not in the BM (Extended Data Fig. 9e,f). These data together demonstrate that SM and BM myeloid compartments are different in the homeostatic condition and have a differential immune response specific to the tumor type.
GBM induces differential alterations in the lymphoid lineage of SM and BM
Opposite to myeloid lineages, a dramatic change in the lymphoid lineage within the SM of GBM animals was evident, with more than 55% reduction in total lymphoid compartments in SB28 and 87% in GL261 SM. In sham BM, the lymphoid lineage composed ~33% of CD45+ cells which decreased to 11% and 4% in BM of SB28 and GL261, respectively. A wide population of various B cell subsets that belong to different developmental stages occupied 49% of total CD45+ cells in sham SM, making B cells the most numerous compartments in the homeostatic SM niche, whereas they made up <29% of CD45+ in BM (Fig. 7a,b and Supplementary Table 1). The SM lymphoid reduction was mainly driven by major loss of almost all B cell subsets (60–94%) (Fig. 7c). This loss was due to a higher extent of GL261 than SB28 BM.
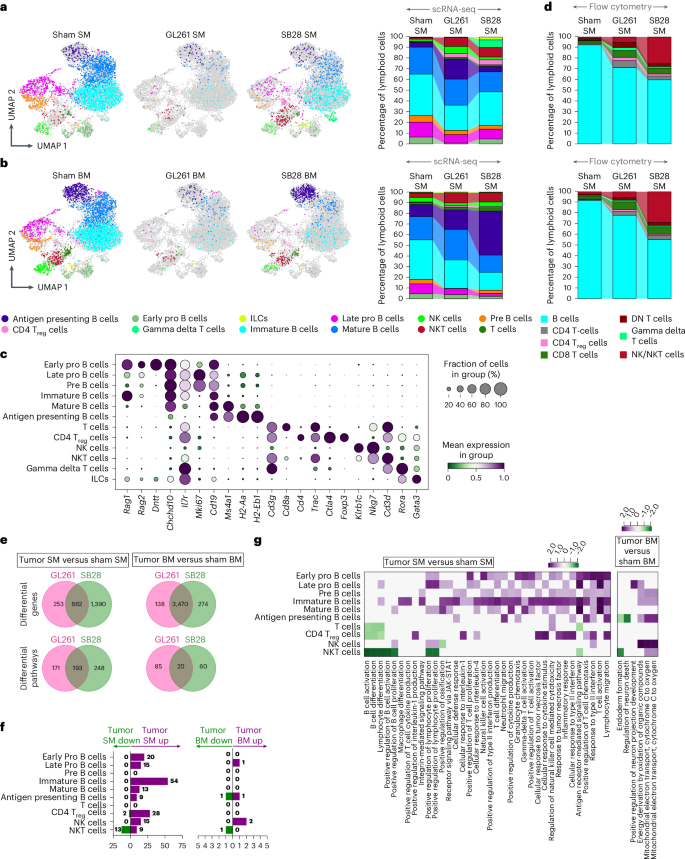
a, 2D UMAPs and stacked bar charts depicting different cell populations and their percentages within the lymphoid subset present in sham SM compared with GL261 and SB28 SM. b, 2D UMAPs and stacked bar charts of corresponding BM derived from scRNA-seq. a,b, In homeostatic SM, B cells were the dominant population within the lymphoid subset, with some differences between SM and BM including higher Pre-B. cells in SM than BM, while this last one had higher Late Pro. B cells which almost disappeared in response to tumor. Early developmental B cell subsets were the most decreased cell types in both SM and BM. While immature B cells were much higher in SM (biggest B cell population) versus BM and reduced almost by 50% in SM and not affect in BM or increased in case of GL261 tumor. Mature B cells also seemed to expand in BM of both tumors while decreasing in SM, and NK cells, NKT cells and T cells were also present in small frequencies. In response to both tumors, T cells, regulatory T cells (Treg cells) and NKT cells increased in the SM while the percentages of NK cells, plasma B cells and NKT cells were increased only in SB28. c, A dot plot summarizing the expression of marker genes utilized to annotate the lymphoid clusters. d, Flow cytometry analysis confirming that GBM decreases SM and BM lymphopoiesis tremendously. Spectral flow cytometric analysis of lymphoid populations in sham SM, compared with GL261 and SB28 SM (top), as well as in sham BM, GL261 BM and SB28 BM (bottom). Flow cytometry analysis of the lymphoid subset validated the decrease in percentage of B cells and the increase in percentage of CD4 and CD8 T cells, in addition to NK/NKT cells in the SM in SB28 and GL261. To simplify the analysis, all six B cell subsets were merged as one cluster (B cells). e, Venn diagrams showing DEGs and differential pathways induced by two GBM models, GL261 and SB28, in SM as well as BM compared with sham SM and sham BM, respectively, across the lymphoid lineage. GL261 and SB28 induced common as well as tumor-specific DEGs and pathways in both SM and BM. pyDESEQ2 was used to identify DEGs in all cell clusters. Venn diagram depicts DEGs with more than 1.2-fold change in upregulation/downregulation. For pathway enrichment, GSEA was used to identify enriched GO pathways and only pathways having FDR Q value less than 0.25 were retained for analysis. f, Stacked bar charts showing significantly upregulated and downregulated pathways induced in different lymphoid lineage cell types by both GL261 and SB28 in SM (left) and BM (right). There was overall upregulation of pathways in SM while BM had downregulation across most cell types. All the B cells subsets were affected in both SM and BM in response to the tumor. g, A heatmap depicting NES of select pathways that were downregulated or upregulated across different cell types in SM (left) or BM (right) in response to both GL261 and SB28. Average NES combined from GL261 and SB28 is plotted. DN T cells, double negative T cells; ILCs, innate lymphoid cells.
Contrary to B cells, natural killer T cells (NKT cells), T cells, gamma delta T cells and regulatory T cells were increased in SB28 SM, but not in GL261 SM. The sham BM had four times more CD8 and NKT cells than sham SM, but they decreased in GL261 BM and SB28 BM (Fig. 7b and Supplementary Table 1). These major changes in lymphoid population were confirmed by FACS analysis (Fig. 7d). Sequestered CD8 and natural killer (NK) cells were increased in both SM and BM, while CD4 increase did not reach significance level (Supplementary Fig. 1a,b). The functional characterization of the main lymphoid populations revealed that both CD4 and CD8 increased their proliferation significantly in BM and SM in response to the tumor (Supplementary Fig. 1a,b). The expression of PD-1 and number of FoxP3 also increased significantly in both BM and SM of both tumor models (Supplementary Figs. 1c–e and 2a–d). In SB28, CD8 from SM but not BM showed significant increase in GzmB and KI67 (Supplementary Fig. 1f), while CD4 proliferation was not different between BM and SM (Supplementary Fig. 1h–j). In GL261, both CD4 and CD8 had higher proliferation rates in both BM and SM, while CD8+GzmB+ did not reach significance level (Supplementary Fig. 2c,d). For NK cells, only SM NK cells showed higher KI67 proliferation marker and PD-1 expression, while BM NK cells showed a higher GzmB (Supplementary Fig. 2e). B cells were highly reduced in their frequency, and tended to increase in KI67 expression, but this increase was not significant in either BM or SM (Supplementary Fig. 2f). Furthermore, we compared tumor-induced DEGs and pathways of lymphoid lineages in both SM and BM. SB28 induced more than four times as many DEGs in SM than in BM (1,390 versus 274), whereas GL261 induced almost double the DEG number (253 in SM versus 138 in BM) (Fig. 7e,f and Supplementary Table 1). In SM, GL261 had fewer DEGs than SB28 and >62% of them were shared with SB28, while in BM, GL261 and SB28 shared more than 92% of DEGs, with SB28 inducing higher numbers of DEGs in BM than in GL261, and the same being true for differential pathway analyses. This suggests that SB28 disturbs the SM lymphoid lineage to a higher extent than does GL261, while both tumors disturb the BM in very similar way, but to a higher extent in SB28. Interestingly, upregulated immune response pathways dominated the SM, while fewer than six pathways dominated the BM. The majority of upregulated pathways in SM were in five B cell clusters, whereas the majority of upregulated pathways in BM were mainly in NK cells and Late Pro B cells. We also noticed upregulation of inflammatory pathways, T cell and NK cell activation, in SM. Altogether, these data suggest that the SM niche receives high stimulatory signals whereas the BM enriches for downregulated pathways related to type II interferon, T cell activation and cell migration.
We thus observed that the B cell lineage constituted the largest hematopoietic population in homeostatic SM, forming more than 49% of CD45+ cells, whereas they made up <29% of BM. Interestingly, GBM induced differential B cell loss in both marrow compartments, utilizing different pathways dominated by upregulation of immune stimulation, B cell and T cell activation in SM, and downregulation of type II interferon and cell migration in BM. A small number of T cells and NKT cells were recruited to the SM of SB28, but not in GL261 SM. All this together suggests that SM is different from BM and responds differently to brain tumor insults.
OC inhibition enhanced tumor progression and reduced the efficacy of checkpoint inhibitors in a GBM mesenchymal mouse model
To investigate the functional effects of OCs on tumor progression, we used zoledronic acid (hereafter named Zol) and RANKL antibody (aRANKL) to inhibit their function (Fig. 8a). In combination with anti-PD-L1, aRANKL has been shown to reduce breast cancer growth15. microCT imaging was performed when control animals started showing tumor symptoms. Skull density and thickness were measured at bregma, lambda, mid-occipital and sub-occipital. Although Zol treatment blocked skull resorption, tumor progression was significantly enhanced in SB28 (Fig. 8b,d and Supplementary Fig. 6) and did not achieve survival benefit in GL261(Supplementary Fig. 7a). aRANKL also blocked skull resorption, to a lesser extent than did Zol, but did not enhance tumor progression as did Zol (Fig. 8c and Supplementary Fig. 6a–d). We also assessed the expression of CPIs in our two murine models, and selected aPD-L1 for combination therapy in SB28 for its high expression in SB28 myeloid cells compared with GL261. aPD-L1 as single treatment extended the survival significantly in SB28 (Fig. 8c). Despite the anti-tumorigenic effect of combining aRANKL with aPD-L1 in recent breast cancer work, this combination abolished the survival benefit of aPD-L1 achieved in the SB28 glioma model as monotherapy (Fig. 8c). microCT analysis showed that bone density was completely restored with Zol treatment (Supplementary Fig. 6a). Interestingly, aRANKL treatment restored bone density slightly, to a lesser extent than did Zol, but not significantly, whereas aPD-L1 treatment increased the skull density significantly in bregma, lambda and mid-occipital, but not sub-occipital, regions (Supplementary Fig. 6b–d). FACS analysis of different treatment groups showed that aPD-L1 increased number and proliferation of T cells in SB28. The expression of their activation markers including GzmB, IFNγ and TNF was also increased, whereas the combination treatment with Zol or aRANKL abolished this significant activation (Fig. 8e). Furthermore, inflammatory neutrophils expressed high PD-L1 and Tim3 levels in SB28 (constituted 22–45% of CD45+), and were eliminated by aPD-L1 monotherapy, but rebounded after adding Zol or aRANKL. The expression of PD-L1 by the CD45− compartment was eliminated by aPD-L1 but remained as high as control with aRANKL and Zol treatment (Fig. 8f). In GL261, although the combination therapy with Zol increased the number of activated T cells that expressed higher levels of GzmB and KI67, the number of inflammatory neutrophils tended to increase in these groups. It is important to remember that the GL261 contain >10 times fewer neutrophils (0.6–2.5%) than do SB28. The combination therapy also induced the highest expression of PD-L1 in the CD45− compartment (Supplementary Fig. 7a,b). Collectively, these results suggest that OC inhibition, using FDA-approved drugs for osteoporosis, prevented the skull-edge resorption induced by GBM, but that the treatment enhanced tumor progression and abolished the efficacy of CPI anti-PD-L1 in SB28 mesenchymal subtype tumor and did not achieve survival benefit in GL261. aPD-L1 or aPD-1 in SB28 and GL261, respectively, increased the activated T cells, while the combination therapy with Zol or aRANKL dampened this effect and increased inflammatory neutrophils.
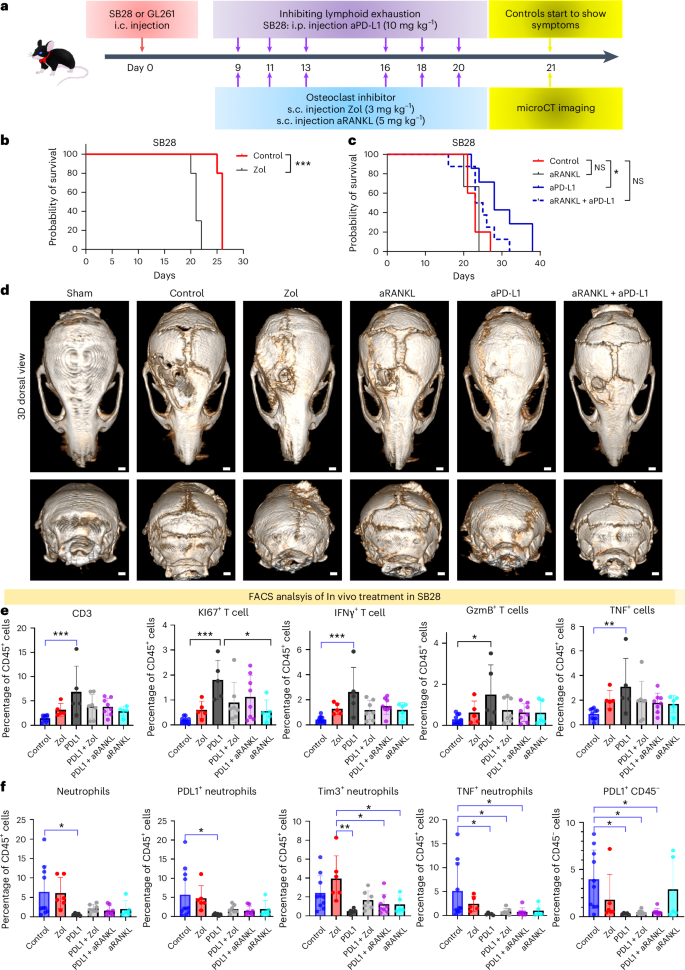
a, Schematic drawing of in vivo inhibition of OC-like macrophages. Treatment started at day 9 (SB28) or day 10 (GL261) after stereotactic tumor injection, three times a week, and microCT was done for the late-stage tumor. b, Kaplan-Meier survival in SB28 tumor-bearing mice. Treatment started at day 9 with 3 mg kg−1 s.c. injection of Zol three times a week, and treatment lasted 2 weeks. Zol treatment enhanced tumor progression significantly (10 mice Zol group, 5 control, experiment repeated twice). c, Anti-RANKL antibody s.c. injection (5 mg kg−1) abolished the survival benefit of anti-PD.L1 treatment (200 µg per mouse) in SB28 tumor (5 control, 7 aPD-L1, 6 aRANKL, 8 aPD-L1 + aRANKL). P value 0.0113 calculated using log-rank (Mantel–Cox) test. d, Coronal and transaxial views of microCT imaging showing the efficacy of Zol in inhibiting skull bone resorption in last-stage SB28 tumor-bearing mice. aRANKL did not stop bone resorption, and neither combination did, opposite to aPD-L1-treated mice. microCT was performed on the same day. e, Flow cytometry analysis of SB28 tumor showing the effect of combining aPD-L1 with Zol or aRANKL. PD-L1 single treatment increased the number of proliferative T cells (KI67+) and functional T cells expressing IFNγ, GzmB and TNF significantly in the tumor, but upon combining it with OC inhibitors (Zol or aRANKL), this abolished the significant difference. f, Flow cytometry analysis of SB28 tumor showing that Zol or aRANKL treatment increased inflammatory neutrophils in the tumor. These neutrophils increased the expression of PD-L1, Tim3 and TNF significantly, while aPD-L1 treatment abolished them from the tumor, and they started to show again upon combining Zol or aRANKL with aPD-L1. For e and f, 5–10 animals per group (10 mice control, 5 Zol, 5 PD-L1, 7 PD-L1 + Zol, 8 PD-L1 + aRANKL, 5 aRANKL) were used for analysis. Data are presented as means ± s.e.m. Significance was assessed using a one-way ANOVA with Tukey’s multiple comparison test (*P < 0.05; **P < 0.01; ***P < 0.001).
Discussion
The skull and SM niche have not been extensively studied in a GBM context due to both technical difficulty and an underappreciation of the systemic effects of GBM. In the current report we demonstrate that GBM activates bone erosion in the calvarium and induces differential changes in the immune landscape of SM and BM. The most active sites of bone resorption in the skull were the osteogenic edges adjacent to the skull sutures. It appears that GBM activates bone resorption in this niche, reverting the fused skull bones and sutures to their pre-fusion structure during early infancy stage (postnatal day 7 in mouse)16,17. However, whether the activation of OCs to induce bone resorption is a direct response to tumor signaling or a secondary response to preliminary changes in the SM niche is still unknown. It has been demonstrated that when OCs stay in direct contact with osteoblasts, they remain in a silent nonresorptive state but start releasing protons that induce bone resorption upon losing their contact with osteoblasts10. Skull sutures were recently found to contain ossified vascularized channels connecting the SM and the meninges, thus forming a direct path that allows immune cell and molecule trafficking7. The ossified channels visualized via high-resolution microCT in our work revealed an increase in their number and diameter, suggesting that they might play a direct role in trafficking immune cells to brain tumors.
It is important to note that previous GBM studies that focused on BM in the femur and tibia without using scRNA-seq reported no significant changes in neutrophil or monocyte numbers, in contrast to what we observed in SM in our work, in which GBM induced almost twofold increase in total neutrophils in both tumors types2. In contrast to neutrophils, there was a tremendous loss of SM B cells ranging from 60% to 94% in all different B cell subsets. Based on these data, it appears that the impact of brain tumor on BM homeostasis is very different from its impact on SM homeostasis. The reasons for these differences are not clear, but could involve the origin and structure of the osteogenic niche in flat versus long bones, the strong connection between brain surface/dura and SM, or the cerebrospinal fluid exchange with SM.
OCs play an essential role in bone homeostasis but have been posited to play a deleterious role in solid cancers such as breast and prostate cancers. It has been suggested that OC bone resorption fuels solid tumor growth and enhances bone metastasis18. Our in vivo studies showed that OC inhibition with Zol or aRANKL accelerated tumor progression in SB28 tumors and did not have survival benefit in GL261. Furthermore, the combination with CPI abolished the survival benefit of anti-PD-L1/anti-PD-1 in these models. Treatment with aPD-L1 or aPD-1 increased the number of activated T cells and eliminated inflammatory neutrophils that expressed PD-L1 and Tim3. Conversely, using Zol or aRANKL as a single treatment kept the neutrophil number high, and, upon combination with aPD-L1 or aPD-1, ameliorated the effect of CPI on T cells, and increased the neutrophil number and PD-L1 expression in the CD45− compartment. Although our work showed that GL261 has ten times fewer neutrophils (0.6–2.5% of total immune cells) than the mesenchymal subtype tumor SB28, combining CPI treatment with Zol or aRANKL increased the neutrophil number in GL261. We believe the low neutrophil number in GL261 was the reason for not significantly reducing animal survival in response to Zol alone, as was the case in SB28 tumor. Our results concur with ref. 19, which reported a pro-tumoral effect of brain tumor neutrophils adapting an inflammatory signature in the tumor microenvironment characterized with high TNF and ceruloplasmin expression. Taken together, our work suggests that OC inhibitors can antagonize the effect of CPI in GBM and accelerate tumor progression in mesenchymal subtype tumors rich with inflammatory neutrophils. Such differences in treatment response according to tumor subtype were reported in recent preclinical studies through blocking CSF1R, which resulted in a significant therapeutic effect in a proneural subtype glioma model, but not in the mesenchymal subtype20.
Although CSF1R inhibition failed to induce significant effects in vivo, the field moved toward combination therapy and generalized patients with GBM as one disease category. Given the complex role of macrophages in the tumor microenvironment, we must investigate ways to activate antitumor macrophages in combination with other immunotherapy strategies, rather than depleting macrophages as a whole, especially in the mesenchymal subtype GBM. Our findings also provide an explanation for the negative outcome of a previous clinical trial (NCT00301873, Zometa study) that aimed to treat osteoporosis in patients with GBM, where 27 of 59 (45.8%) survived after 6 months and 19 of 59 (32.2%) after 12 months, a much lower survival rate compared with other GBM trials that were recruiting patients around the same period (NCT00884741: for the placebo group that had standard GBM treatment, 255 of 309 (82.5%) were reported alive at 6 months, and 192 of 309 (62.1%) after 12 months)21. Early tumor progression in the Zometa study led to early patient termination. These clinical scenarios support our preclinical data and suggest that bisphosphonate treatment or other OC inhibition (denosumab or other RANKL-inhibitors) should be avoided in patients with GBM, and in immunotherapy clinical trials, particularly for mesenchymal subtype GBMs.
Methods
Experimental animals
All animal work was approved by the Institutional Animal Care and Use Committee at the Albert Einstein College of Medicine in accordance with the National Institutes of Health (NIH) guidelines (approved protocol no. 00001516).
Mice of both sexes aged 8–12 weeks were used. C57BL/6J mice were purchased from Charles River. The OC transgenic mice, TRAP-tdTomato mice, were generated by M. Ishii and pups were regularly genotyped using Fw: CTTCCCAGCTCCTCAGCTCC, Rv: TGTACCGTGGGTCAGGAGTG (Sigma-Millipore). Td.Tom expression was confirmed by multiphoton or FACS22. Aged C57BL/6J mice (18–24 months) were supplied by the NIH (Division of Aging Biology). All mice were maintained under pathogen-free conditions in individually ventilated cages, under stable conditions of humidity and temperature and in a controlled vivarium on a 12:12-h light–dark cycle with free access to food and water.
Cell lines
The murine glioma model GL261 was provided by NCI-Frederick. The cell line was defrosted and expanded in sphere conditions (serum-free) containing EmbryoMax DMEM/F12-GlutaMAX medium (MilliporeSigma), basic fibroblast growth factor 10 ng ml−1, epidermal growth factor 20 ng ml−1 (Peperotech), B27-supplement 1:50 (Stem Cell Technology), penicillin/streptomycin 100 U ml−1 (Sigma) and heparin 1 ng ml−1. SB28-GFP was kindly provided by H. Okada of University of California, San Francisco and expanded in DMEM/F12-GlutaMAX medium, 10% FBS, 100 U ml−1 penicillin and 100 µg ml−1 streptomycin. The cells were passaged when they reached 70–80% confluence and kept in culture at 37 °C in a humidified 5% CO2 atmosphere. Cells with fewer than 12 passages and viability 80–95% were used in various in vivo experiments. Cell morphology and GFP expression were checked regularly during cell expansion for transplantation.
Tumor formation and treatment
Tumor cells were stereotactically injected into the right hemisphere (2.5 mm lateral and 0.5 mm frontal from bregma, at 2.5-mm depth). Two controls were used: (1) sham control underwent the same surgery and received DMEM; (2) hemorrhagic stroke was induced by collagenase injection. For orthotopic brain tumor implants, 50,000 tumor cells in 5 μl of EmbryoMax DMEM/F12-GlutaMAX medium (MilliporeSigma) were intracranially injected using a 10-μl Hamilton syringe with a 33-gauge needle in the right striatum of C57/BL6 or TRAP-tdTomato mice as previously described23. Using a stereotactic frame, a burr hole was drilled in the skull using the following stereotactic coordination: 0.5 mm forward from bregma, 1.5 mm lateral and 2.5 mm ventral from the dura. To inhibit backflow through the injection canal, the needle was left in the brain for 2 min and withdrawn gradually (1 mm with waiting time 2 min). The skin incision was closed with 7-mm clips. Sham control mice underwent the same surgery but were injected with medium alone. Mice were allowed to recover; their health status was closely monitored, and they were killed when they started showing neurological symptoms. For subcutaneous tumor, the end point was when tumor reached 1 cm.
For in vivo treatment, 10 d after tumor implant, animals were randomized into different groups that received various treatments three times a week for a total of five doses: Zol (Tocris; administered 3 mg kg−1 by subcutaneous injection), αRANKL antibody (neck subcutaneous injection, 5 mg kg−1), anti-PD-L1 (10F.9G2) (intraperitoneal (i.p.) injection, 200 μg per mouse), anti-PD-1 (29F.1A12) (i.p. injection; BioXcell). At least 9–13 mice were used for each group in total.
High-resolution microCT
microCT imaging was performed using an Inveon Multimodality scanner (Siemens INVEON PET/SPECT/CT Trimodal System scanner). For live animal imaging, a Dual-BiGemini mouse nose cone/holder was designed and built by W. Koba, using Trimble Sketchup Pro 2021, then converted to a stereolithography file which was sliced in Ultimaker Cura v.5.2.1 and printed on an Ultimaker S5 using polylactic acid. The nose cones are attached laterally and opened on both sides. Each side is equipped with a bite bar to lock in the incisors of each mouse. There are four positions available for each of four mice anesthetized during the entire study. Animals are identified and anesthetized in an induction chamber from a VetEquippe anesthesia machine. The concentration of anesthetic was 1.5% isoflurane delivered at 1.5 ml min−1 of oxygen per delivery. Once removed from the induction chamber each mouse was positioned in one of the four positions on the Dual-BiGemini system during the entire scan. The system was connected to the anesthesia machine and anesthetic overflow was scavenged using charcoal filters. Charcoal filters are weighed before each use and discarded after exceeding more than 50 g of the tare weight. After completion of the scan each of the four mice was allowed to recover in an empty cage on top of a chux pad and a reptile heating pad. The temperature did not exceed 26 °C. The imaging parameters were as follows: a Step and Shoot acquisition CT, total Rotation was a Half, with 220 Projections, 594 s Scan Time, with Low Resolution Magnification, Binning by 2, 46.4 Effective Pixel Size, 2,496 px Transaxial CCD, 57.9 mm Transaxial FOV, 4032 pixel Axial CCD, 93.53 mm Axial FOV, 94 mm Scanning Length, Peaked voltage at 80 kV, Current at 500 μA, and used 1.5 mm filter. Exposure was 925 ms.
The raw data were saved as a folder of Digital Imaging and Communications in Medicine (DICOM) files using Inveon Converter (Siemens) and subsequently linear transformation was applied in 3D Slicer (https://www.slicer.org/) to correct the orientation24. Thereafter, the corrected DICOM data were visualized and analyzed in RadiAnt DICOM Viewer v.2023.1 (Medixant). Briefly, the default window level for ‘bone’ was set up before taking the density as well as thickness measurements at the bregma, lambda, mid-occipital and sub-occipital regions along the midline. Ex vivo high-resolution microCT was used to accurately measure microarchitectural properties of all skull specimens. A custom specimen holder was 3D printed with polylactic acid thermoplastic (Ultimaker 5, Ultimaker) in preparation for scanning. The specimens were scanned individually with settings at high resolution, with effective pixel size 9.42 µm, and 1,216 px was the Transaxial CCD size. Total rotation was a half, source voltage peak at 75 kV, and source current 450 µA. The filter thickness was 1.5 mm, used 440 projections, scan time was 1,584 s, Transaxial FOV was 11.46 mm, Axial FOV was 20.5 mm, Axial scanning length was 20 mm and Binning by None. The exposure was 980 ms. The CT detector was a Spectral camera. Bone morphometry was conducted according to ref. 25 using BV (mm3), BV/TV fraction (%), Tb.Th (μm) and Tb.N.
The number and diameters of the ossified SM channels were analyzed using Fiji within an area extending 2 mm posterior and 3.5 mm bilaterally from lambda. 3D microstructural image data were reconstructed from DICOM data, and the bone structure analysis was performed using TRI/3D-BON 64 software (RATOC Systems). In detail, the reconstructed 3D data were cropped into the region of interest, posterior to lambda (Supplementary Fig. 8a). Using the trabecular bone analysis system in TRI/3D-BON 64 software, bone material was automatically detected through a binarization step and the whole bone area was identified by filling the spaces within the detected bone material. The detected whole bone area was then segmented into marrow and cortical bone regions (18 μm inside and outside from the inner edge of the outer bone), and the bone material within the marrow region was extracted as trabecular bone (Supplementary Fig. 8b,c). For bone structure analysis, skull and the right femurs were extracted from adult 8–12-week-old mice or aged mice 18–24 months old, fixed in 4% PFA for 3 d, washed three times with PBS, then imaged with microCT using 9-μm resolution. Raw data were saved as DICOM files and analyzed as previously described25.
Human CT analysis
The following datasets available on the TCIA were accessed after signing the agreement: TCGA-GBM, TCGA-LGG, CPTAC-GBM RTOG 0625/ACRIN 6677 (refs. 26,27,28,29). The CT scans were available for only 26 patients as less than 10% of patients with GBM are imaged with CT since MRI is the standard imaging technique. Of the 26 patients, 21 had the molecular profile (bulk RNA sequencing (RNA-seq)) of tumors available at TCGA and CPTAC. We included 22 control patients (approved IRB no. 2023-14986) after age and gender matching, of which the majority were patients with stroke or traumatic brain injury. Exclusion criteria was autoimmune disease, hormonal therapy and cancer history. DICOM files of the CT scans were loaded into Slicer and a default bone window was selected for visualization. The scans were linearly transformed to correct the orientation with respect to the imaging planes based on two-dimensional (2D) sections as well as visualization of 2D sections on the 3D volume. Subsequently, the sagittal plane was aligned with the sagittal suture (midline) while the coronal plane was aligned with the coronal suture. Bone thickness and density were recorded at the intersection of these two planes. Further, the sagittal plane was moved 5 mm in both directions to capture the spread of sagittal suture in humans. For measurement of the right/left eye midorbital axes intersection with coronal suture, the sagittal plane was aligned with the center of the eye sockets and subsequently bone thickness and density were recorded at the intersection of the sagittal plane with the coronal plane (pre-aligned with the coronal suture). The coronal plane was moved 2 mm in either direction to capture the spread of human coronal sutures. For measurements at lambda and mid-occipital locations, the intersection of axial plane with the sagittal plane (pre-aligned with the sagittal suture) was used to measure bone thickness and density similar to bregma. All the measurements were performed on the sagittal plane.
MRI analysis
Image acquisition was done by retrieval of contrast-enhanced T1-weighted MRI images for each case. Subsequently, the DICOM format images were anonymized and imported onto 3D Slicer software v.5.6.2 (www.slicer.org) for conducting semi-automatic tumor segmentation, and the T1-weighted gadolinium-enhanced MRI sequence volumes (axial, sagittal or coronal axis view) with maximum number of image slices per volume were uploaded to the workspace. The contrast-enhanced regions of the tumor were delineated and segmented followed by tumor volume calculation in the software. Standard descriptive statistical methods and quantitative methods were conducted with regression analysis using JMP 18 statistical software (SAS). Analysis of variance (ANOVA) and Student’s t-test were performed for analyzing volume against bone thickness. A P value < 0.05 was set as statistical significance.
Light sheet imaging and analysis
Life Canvas Standard protocol was followed to perfuse animals with ice-cold heparinized PBS. Dissected skulls with brain were fixed in 4% PFA in PBS for 3 d, and thereafter transferred to PBS and kept at 4 °C. Samples underwent SHIELD (6 d), then passive clearing started with decalcification for 5 d in 10% EGTA at 37 °C, washing three times in PBS, then dilapidation at 37 °C for 2 weeks and washing for 2 d on a shaker, and PBS was changed twice a day. Active immunolabeling was performed using SmartBatch+ LifeCanvas protocol. Primary antibodies used were GFP antibody 1:1,000 (cat. no. NB100-62622) and TdTomato antibody 1:800 (mAb 20163). Secondary antibodies Donkey anti-sheep Alexa Fluor 488 and Goat anti-rabbit Alexa Flour 546 (Invitrogen) were used at 1:500 concentration. Imaging was done using the SmartSPIM light sheet microscope with ×3.6 magnification. Images were stitched and saved as per-channel TIFF files. Using custom Python code, image arrays were reshaped as optimally sized chunks and saved in the .zarr format at multiple resolutions (original, 1:2, 1:4, 1:8). Chunked data were re-imported to perform tile-by-tile ‘segmentation’ followed by enumeration of segmented objects and their properties. Tables were generated specifying the volume of each segmented object and the total number of objects detected. For 3D rendering and video generation, we imported 1:2 or 1:4 down-scaled .zarr data, and the region outside the tissue was classified using a variation of Otsu’s method, permitting the per-channel background to be subtracted. Before converting from full bit depth data to 8 bits per color channel, per-channel contrast was optimized to a percentile intensity range (90–99th percentile). Final renderings were made in napari viewer. For videos, a sequence of frames was captured while rotating the image object along the anterior–posterior axis of the skull.
Multiphoton imaging and analysis
For intravital imaging of the skull bones, mice were anesthetized with isoflurane on a custom-built stereotactic stage and an imaging window was surgically created using dental cement. An Olympus FVE-1200 upright microscope with a ×25, 1.04 numerical aperture objective coupled with DeepSee MaiTai Ti-Sapphire pulsed laser was used. The laser was tuned to 920-nm wavelength for two-photon excitation. Tiled images were acquired using 512 × 512-µm2 z-stack images with 10-µm steps. Images were stitched using Olympus Fluoview software and exported as .oif files. The exported files were subsequently imported in napari Python environment for analysis30. Segmentation was performed using ‘gja-1’ model as implemented in the Allen Cell and Structure Segmenter31. The segmented binary image was manually inspected, and any acellular artifact was removed. Thereafter, a watershed algorithm was applied to identify single cells, as implemented under ‘touching-objects-labeling’ in the SimpleITK package32. The volume of the cells was subsequently calculated using ‘regionprops_table’ from the scikit-image package33.
scRNA-seq library preparation and sequencing
The skull samples from sham and GBM animals were collected by immediate decapitation posterior to the occipital bone after perfusion with ice-cold HBSS. The drilling site for intracranial surgery was discarded to avoid mechanical disruption or contamination related to tumor induction (Supplementary Fig. 9). Single-cell suspensions were prepared using enzymatic digestion enzyme (50% tryple, 50% Collagenase (Type VII-S), Sigma-Aldrich). Samples were incubated for 10 min at 37 °C, then pipetted gently using wide tips and filtered through a 70-μm cell strainer. Cold hibernate medium with 4% BSA was used for sample collection, washing and resuspension. Cells underwent cell sorting using FACS Aria-II to remove dead cells and debris. Sorted cells with viability >70% were kept on ice and used for 10x within 1–3 h after sorting. scRNA-seq libraries were generated from up to 10,000 individual cells captured in an oil emulsion on a Chromium Controller (10x Genomics). Complementary DNA was generated in the individual cell–gel bead emulsion micro-reactors while adding barcodes at the cellular and molecular level using the Chromium Next GEM Single Cell 3′ Kit v.3.1 (10x Genomics kit 1000268.) The barcoded cDNAs from the individual cells were combined for the remaining library process. The unique molecular barcodes ensure that amplification artifacts will not skew the analysis. The libraries were analyzed using a Fragment Analyzer 5200 (Agilent) to ensure a normal size distribution with an average size of 450 bp. The libraries were sequenced using an Illumina NextSeq 2000 with the following read lengths: 28 bp for Read 1, 10 bp for i7 Index, 10 bp for i5 Index and 90 bp for Read 2 at a read depth of 20,000 reads per cell.
scRNA-seq libraries for sham skull, GL261 skull and SB28 skull were sequenced using an Illumina NextSeq 2000 with an 8-base index read, a 28-base read 1 containing cell-identifying barcodes and unique molecular identifiers and a 90-base read 2 containing the transcript sequence.
The raw fastq files were mapped to Mus musculus genome (GRCm39 mm10) along with demultiplexing the cellular barcodes to get gene expression matrices using simpleaf34. For RNA velocity analysis, spliced and unspliced counts were also retrieved for SM samples.
scRNA-seq and bulk RNA-seq analysis
scRNA-seq analysis was primarily performed using Scanpy v.1.9.8 (ref. 35). Our datasets of sham SM, SB28 SM, GL261 SM, sham BM, SB28 BM and GL261 BM are provided under GEO accession number GSE235464. The sham BM dataset was accessed from ArrayExpress under accession number E-MTAB-8630. All the datasets were pooled and subjected to basic pre-processing and filtering before integration using scVI. Briefly, cells expressing fewer than 200 genes were excluded while genes that were expressed in fewer than three cells were also removed. In addition, cells with more than 10% of expressed genes derived from mitochondrial genome were excluded. Scrublet was used to detect and remove doublets from further analysis. Upon initial clustering, CD45+ clusters were identified and subjected to further analysis. After selection of CD45+ cells, normalization and PCA were performed again and neighbors were calculated. Data were embedded on a 2D UMAP for visualization. The Leiden algorithm was used to identify different cell clusters with resolution set at 0.7. Based on expression of a curated panel of marker genes, cell types were annotated. To minimize connectivity violations, partition-based graph abstraction embedding was calculated and force directed layout of the partition-based graph abstraction graph was estimated whose positions were then used to initialize UMAP36. For lymphoid subset analysis, lymphoid cells were isolated from the integrated batch-corrected dataset, raw counts were recovered and the data were re-embedded. Thereafter, the Leiden clustering algorithm with resolution set to 0.5 was applied to identify clusters within this lymphoid population. The clusters were annotated based on the expression of various marker genes.
For differential gene analysis, pseudobulk profiles with three replicates originating from each cell type condition pair were generated by summation of raw counts for all the genes. pyDESEQ2 was then used to analyze these bulk RNA-seq profiles. The log2 fold change values as calculated by pyDESEQ2 were used to perform gene set enrichment analysis (GSEA) on GO Biological Process pathways. All pathways with false discovery rate (FDR) Q value less than 0.25 were retained for analysis and visualization. Semantic clustering for enriched GO terms was performed using the SimplifyEnrichment library in R. For PCA of different samples, pseudobulk profiles were generated by treating all cell types originating from a sample as one cell type and processed using pyDESEQ2 as described above. Normalized counts as output by pyDESEQ2 were logarithmized and used to perform PCA. The first three principal components were plotted in 3D space to generate the 3D PCA plot. Seaborn and matplotlib were additionally used for plotting and visualization.
For subclassification of GL261 and SB28 cell lines, the datasets were downloaded from GSE175419 and GSE127075, respectively. limma (v.3.56.1) and edgeR (v.3.42.2) were used to classify the cell lines using 12 signature genes as previously identified8,37,38.
Flow cytometry
Single-cell suspensions for SM and tumor were prepared as described above for scRNA-seq. Cells were fixed in 4% PFA using BD Cytofix/Cytoperm Kit for 20 min at 4 °C and subsequently washed in FACS buffer (PBS, 4% FBS). Cells were stained with conjugated primary antibodies staining mix for 1 h at 4 °C. Subsequently, cells were washed with FACS buffer and permeabilized using BD Cytofix/Cytoperm Kit and intracellular staining was performed overnight. Cells were washed and then resuspended in FACS buffer before acquisition on a 5-laser Cytek Aurora (Cytek Biosciences). Unmixed FCS files were imported in FlowJo software (v.10.7.1, BD) for analysis. In total, 10,000–50,000 events were recorded for all the samples. See Supplementary Table 2 for antibody information and the spectral flow panel.
Statistical analysis
All statistical analyses were conducted using either scipy or GraphPad Prism. In all boxplots, the center lines represent the median, and lower and upper box limits are, respectively, the first and third quartiles, and whiskers represent the maximal values up to 1.5 times the interquartile range. All values extending beyond this range are considered fliers/outliers. Shaded regions in survival curves represent 95% confidence intervals. Violin plots use the Gaussian kernel to estimate densities, and the center lines represent the medians. The two-sided Mann–Whitney U test was used throughout to nonparametrically compare two populations. P values were adjusted for multiple comparisons using the Benjamini–Hochberg (FDR) procedure, and statistical significance was assessed at an adjusted P value threshold of 0.05. Data distribution was assumed to be normal, but this was not formally tested. No statistical method was used to pre-determine sample size, but a pilot study and previous experience with an in vivo experiment were used to estimate number of animals needed8,23. Data collection and analysis were not performed blind to the conditions of the experiments.
Reporting summary
Further information on research design is available in the Nature Portfolio Reporting Summary linked to this article.
Data availability
Data including single-cell RNA-seq are deposited at the NCBI Gene Expression Omnibus database under GEO identifiers GSE235464 and GSE213309. All raw and processed files of microCT, multiphoton and light sheet imaging can be shared upon request. The human CT data from the TCIA (TCGA-GBM, TCGA-LGG, CPTAC-GBM RTOG 0625/ACRIN 6677) can be accessed after signing an agreement with the TCIA because of face reconstruction possibility based on CT. Source data are provided with this paper.
Code availability
The data analysis code for scRNA-seq is available via GitHub at https://github.com/behnanNN/Behnan-NN-SM. Light sheet Python script analysis is available via GitHub at https://github.com/njkillian/LSM_NN.
References
Wen, P. Y. et al. Glioblastoma in adults: a Society for Neuro-Oncology (SNO) and European Society of Neuro-Oncology (EANO) consensus review on current management and future directions. Neuro Oncol. 22, 1073–1113 (2020).
Chongsathidkiet, P. et al. Author Correction: Sequestration of T cells in bone marrow in the setting of glioblastoma and other intracranial tumors. Nat. Med. 25, 529 (2019).
Ayasoufi, K. et al. Brain cancer induces systemic immunosuppression through release of non-steroid soluble mediators. Brain 143, 3629–3652 (2020).
Herisson, F. et al. Direct vascular channels connect skull bone marrow and the brain surface enabling myeloid cell migration. Nat. Neurosci. 21, 1209–1217 (2018).
Pulous, F. E. et al. Cerebrospinal fluid can exit into the skull bone marrow and instruct cranial hematopoiesis in mice with bacterial meningitis. Nat. Neurosci. 25, 567–576 (2022).
Cugurra, A. et al. Skull and vertebral bone marrow are myeloid cell reservoirs for the meninges and CNS parenchyma. Science https://doi.org/10.1126/science.abf7844 (2021).
Mazzitelli, J. A. et al. Cerebrospinal fluid regulates skull bone marrow niches via direct access through dural channels. Nat. Neurosci. 25, 555–560 (2022).
Behnan, J. et al. Differential propagation of stroma and cancer stem cells dictates tumorigenesis and multipotency. Oncogene 36, 570–584 (2017).
Zhao, H. et al. The suture provides a niche for mesenchymal stem cells of craniofacial bones. Nat. Cell Biol. 17, 386–396 (2015).
Furuya, M. et al. Direct cell-cell contact between mature osteoblasts and osteoclasts dynamically controls their functions in vivo. Nat. Commun. 9, 300 (2018).
Morgan, D. & Tergaonkar, V. Unraveling B cell trajectories at single cell resolution. Trends Immunol. 43, 210–229 (2022).
Xie, X. et al. Single-cell transcriptome profiling reveals neutrophil heterogeneity in homeostasis and infection. Nat. Immunol. 21, 1119–1133 (2020).
Abdelfattah, N. et al. Single-cell analysis of human glioma and immune cells identifies S100A4 as an immunotherapy target. Nat. Commun. 13, 767 (2022).
Laurenti, E. et al. CDK6 levels regulate quiescence exit in human hematopoietic stem cells. Cell Stem Cell 16, 302–313 (2015).
Gomez-Aleza, C. et al. Inhibition of RANK signaling in breast cancer induces an anti-tumor immune response orchestrated by CD8+ T cells. Nat. Commun. 11, 6335 (2020).
Hajiaghamemar, M., Lan, I. S., Christian, C. W., Coats, B. & Margulies, S. S. Infant skull fracture risk for low height falls. Int. J. Legal Med. 133, 847–862 (2019).
Marghoub, A. et al. Characterizing and modeling bone formation during mouse calvarial development. Phys. Rev. Lett. 122, 048103 (2019).
Maurizi, A. & Rucci, N. The osteoclast in bone metastasis: player and target. Cancers (Basel) https://doi.org/10.3390/cancers10070218 (2018).
Maas, R. R. et al. The local microenvironment drives activation of neutrophils in human brain tumors. Cell 186, 4546–4566 (2023).
Rao, R. et al. Glioblastoma genetic drivers dictate the function of tumor-associated macrophages/microglia and responses to CSF1R inhibition. Neuro Oncol. 24, 584–597 (2022).
Gilbert, M. R. et al. A randomized trial of bevacizumab for newly diagnosed glioblastoma. N. Engl. J. Med. 370, 699–708 (2014).
Kikuta, J. et al. Dynamic visualization of RANKL and Th17-mediated osteoclast function. J. Clin. Invest. 123, 866–873 (2013).
Behnan, J. et al. Recruited brain tumor-derived mesenchymal stem cells contribute to brain tumor progression. Stem Cells 32, 1110–1123 (2014).
Fedorov, A. et al. 3D Slicer as an image computing platform for the Quantitative Imaging Network. Magn. Reson. Imaging 30, 1323–1341 (2012).
Bouxsein, M. L. et al. Guidelines for assessment of bone microstructure in rodents using micro-computed tomography. J. Bone Miner. Res. 25, 1468–1486 (2010).
Scarpace, L. et al. The Cancer Genome Atlas Glioblastoma Multiforme Collection (TCGA-GBM) Version 5 [dataset] (The Cancer Imaging Archive, 2016).
National Cancer Institute Clinical Proteomic Tumor Analysis Consortium (CPTAC). The Clinical Proteomic Tumor Analysis Consortium Glioblastoma Multiforme Collection (CPTAC-GBM) (Version 16) [dataset] (The Cancer Imaging Archive, 2018).
Kinahan, P., Muzi, M., Bialecki, B., Herman, B. & Coombs, L. Data from ACRIN-DSC-MR-Brain [dataset] (The Cancer Imaging Archive, 2019).
Pedano, N. et al. The Cancer Genome Atlas Low Grade Glioma Collection (TCGA-LGG) Version 3 [dataset] (The Cancer Imaging Archive, 2016).
Selzer, G. J. et al. napari-imagej: ImageJ ecosystem access from napari. Nat. Methods 20, 1443–1444 (2023).
Wang, M. et al. AllenDigger, a tool for spatial expression data visualization, spatial heterogeneity delineation, and single-cell registration based on the Allen Brain Atlas. J. Phys. Chem. A 127, 2864–2872 (2023).
Yaniv, Z., Lowekamp, B. C., Johnson, H. J. & Beare, R. Correction to: SimpleITK Image-Analysis Notebooks: a collaborative environment for education and reproducible research. J. Digit. Imaging 32, 1118 (2019).
van der Walt, S. et al. scikit-image: Image processing in Python. PeerJ 2, e453 (2014).
He, D. & Patro, R. simpleaf: A simple, flexible, and scalable framework for single-cell data processing using alevin-fry. Bioinformatics https://doi.org/10.1093/bioinformatics/btad614 (2023).
Wolf, F. A., Angerer, P. & Theis, F. J. SCANPY: large-scale single-cell gene expression data analysis. Genome Biol. 19, 15 (2018).
Korsunsky, I. et al. Fast, sensitive and accurate integration of single-cell data with Harmony. Nat. Methods 16, 1289–1296 (2019).
Ritchie, M. E. et al. limma powers differential expression analyses for RNA-sequencing and microarray studies. Nucleic Acids Res. 43, e47 (2015).
Robinson, M. D., McCarthy, D. J. & Smyth, G. K. edgeR: A bioconductor package for differential expression analysis of digital gene expression data. Bioinformatics 26, 139–140 (2010).
Acknowledgements
We thank Y. Zhang for FACS sorting. We thank Y. Le, G. Liriano, R. Falcone and K. Fisher for technical and administrative support. We thank I. Carta for slide scanner assistance. We thank L. Herbst, T. Rakowski-Anderson, L. Jelicks and S. Shrestha for managing the animal core facility. We thank L. Ramkisson for histology core services. We thank the Genomics core facility and R. Dubin for sequencing and mapping. We thank the Albert Einstein College of Medicine Epigenomics Shared Core Facility, RRID: SCR_023284. Flow cytometry studies were carried out using resources of the FACS Core Facility of the Einstein Cancer Center, which is supported by NIH/NCI Cancer Center Service grant no P30 CA13330 and by Shared Instrumentation grants no. S10OD026833 and no. S10OD032169. W.R.K. was supported by a grant from the NIH, grant no. S10RR029545 ‘MicroPET/SPECT/CT Animal Imaging Device’, which supported the purchase of the Inveon imaging scanner. E.E. was supported by a grant from the NINDS, grant no. K12NS080223. J.B. was supported by the Marie Skłodowska-Curie Actions Global Fellowship, Grant Agreement No. 844948. The funders had no role in study design, data collection and analysis, decision to publish or preparation of the manuscript.
Ethics declarations
Competing interests
The authors declare no competing interests.
Peer review
Peer review information
Nature Neuroscience thanks the anonymous reviewers for their contribution to the peer review of this work.
Additional information
Publisher’s note Springer Nature remains neutral with regard to jurisdictional claims in published maps and institutional affiliations.
Extended data
Extended Data Fig. 1 SB28 exhibits Mes subtype signature while GL261 expressed hybrid signature of Mes and PN.
(a and b) RNA Expression profiles of GL261 and SB28, respectively. Molecular subtype of GL261 and SB28 were discerned based on a panel of 12 genes according to Behnan et al. (39).
Extended Data Fig. 2 Additional representative microCT images of GBM induced bone resorption in early-and late-stage glioma at the osteogenic edges adjacent to the skull sutures.
The bone erosion existed in other non-glioma origin with different pattern and was absent in subcutaneous (sc) glioma models. (a) microCT images of early-stage/half-time brain tumors, GL261 and SB28, bearing mice compared to age-matched sham control showing bone erosion in GBM models. (b) microCT image of additional animals bearing late-stage brain tumors, GL261 and SB28, compared to age-matched sham control showing expanded bone erosion in last stage tumor. (c) microCT images of sc-glioma models, GL261-sc and SB28-sc, compared to intracranial (ic) glioma of the same cell line, GL261-ic and SB28-ic. In addition, i.c injected breast cancer cell line, 4T1-ic and (mouse embryonic fibroblasts) MEF-ic as representative of non-glioma origin tumor.
Extended Data Fig. 3 GBM does not induce bone erosion in the fumers.
(a) MicroCT image of fumer from mice bearing brain tumors, GL261 and SB28, compared to age-matched sham control. (b–d) Statistical analysis of bone morphometry showed no significant reduction in BV and Tb.Th in femer. Number of animals in statistics: in (b), Day 8 (6 mice/sham; 5 mice/GL261; 5 mice/SB28); in (c), Day 15 (6 mice/sham; 4 mice/GL261; 6 mice/SB28); in (d), Late-stage tumor (6 mice/sham; 3 mice/GL261; 7 mice/SB28). Data are presented means ± SEM. In (b–d), significance was assessed by a one-way ANOVA with Tukey’s multiple comparison test (ns, no-significant; *, p < 0.05; **, p < 0.01; *** p < 0.001; ****, p < 0.0001).
Extended Data Fig. 4 Bone Thickness across gender and ages in control and GBM patients.
(a) Bone thickness at defined anatomical locations classified according to gender in control dataset (Top) or GBM dataset (Bottom). Female subjects in control dataset had higher bone thickness at Mid-occipital compared to Males, while it was not significant at other locations. In the GBM dataset, female subjects had higher bone thickness only at intersection of Right-eye midorbital axis with coronal suture. No significant difference was observed at other anatomical locations, including Mid-Occipital. (b) Scatter plot of bone thickness and age in control dataset (Top) or GBM dataset (Bottom). No significant correlation was observed between bone thickness and age in both control and GBM datasets. Sample size was 11 female- and 11 male- GBM patients, 10 female- and 12 male- control, 3 measurements for each anatomic point. Mann-Whitney U Test was used to calculate p-values for bone thickness differences between Females and Males. Spearman correlation was calculated for bone thickness vs age correlations. (*, p < 0.05; **, p < 0.01; *** p < 0.001). Four GBM patients were missing age and gender information and were excluded from this analysis.
Extended Data Fig. 5 Human GBM CT bone thickness according to tumor location showing no impact of tumor location on skull thickness except Lmbda point upon having tumor in left frontal region.
Patients with tumor in Left Frontal region had more bone thickness compared to those in Right Frontal region. 12 patients had MRI and CT. Data are presented as means ± SEM. Significance was assessed a one-way ANOVA with Tukey’s multiple comparison test (*, p < 0.05).
Extended Data Fig. 6 GBM reduce the number of OCs in the skull during tumor progression in GL261 and SB28 glioma models.
(a) A representative Maximum Intensity Projection of Light Sheet microscopic of skull in TRAP-tdTomato transgenic mice. Skulls from SB28 and GL261 at Day-8, -15, late-stage were imaged, and sham animals without tumor were used as control. Red signal, OCs expressing TRAP-tdTomato; green, Autofluorescent. Scale bar, 1000 µm. (b) Representative images of segmented OCs in the skull (Surrounded by dotted line). OCs expressing TRAP-tdTomato; white, Segmentaed OC surfaces. Scale bar, 1000 µm. GL261 and SB281 tumors induce a decrease in total volume of skull OCs at Day-8 and -15, and a resurgence in late-stage tumor.
Extended Data Fig. 7 Flow cytometry analysis showing functional characteristics of Macrophages and DCs in SM and BM of SB28 tumor bearing mice.
(a, b) Percentage of total BM macrophages (c, d) Percentage of total SM macrophages out of total CD45+ cells in SB28 and their expression of MHC-II and IL10 showing higher expression of MHC-II and IL10 in SB28 compared to sham control. (e, f) Percentage of total BM DCs (g, h) Percentage of total SM DCs out of CD45+ cells showing no difference in MHC II expression in both BM and SM DCs, while IL10 was significant higher in SM derived DCs, and not significant in BM. Number of animals in statistics: 4 mice/sham; 5 mice/SB28. Data are presented as means ± SEM. Significance was assessed as Mann-Whitney U test (*, p < 0.05; **, p < 0.01; *** p < 0.001; ****, p < 0.0001).
Extended Data Fig. 8 Flow cytometry analysis showing functional characteristics of macrophages and DCs in SM and BM of GL261 tumor bearing mice.
(a) Percentage of total BM macrophages (b) Percentage of total SM macrophages in GL261 and their expression of MHC-II, IL10, IL17, PDL1 and proliferation marker KI67 showing only MHCII was higher in both GL261 BM and SM macrophages compared to sham control. (c) Percentage of total BM DCs (d) Percentage of total SM DCs showing significant increase in MHCII and PDL1 expression in DCs from GL261 BM, while SM DCs increased IL10 expression. Number of animals in statistics: in (a), 5 mice/sham; 6 mice/GL261; in (b), 8 mice/sham; 4 mice/GL261; in (c), 7 mice/sham; 6 mice/GL261; in (d), 8 mice/sham; 4 mice/GL261. Data are presented means ± SEM. Significance was assessed as Mann-Whitney U test (*, p < 0.05; **, p < 0.01; *** p < 0.001).
Extended Data Fig. 9 Flow cytometry analysis showing functional characteristics of Neutrophils and Monocytes in GL261 and SB28.
(a–c) Percentage of total BM and SM Neutrophils out of CD45 showing only SM Neutrophils have higher proliferation marker in response to GL261 (b–d) Percentage of total BM and SM Monocytes out of total CD45+ cells showing higher expression of KI67 in both BM and SM in response to GL261. and their expression of MHC-II and IL10 showing higher expression of MHC-II and IL10 in SB28 compared to sham control. (e) Percentage of total BM Neutrophils (f) Percentage of total SM Neutrophils in response to SB28 tumor showing significant increase in SM neutrophils frequency, not BM neutrophils, but its increased expression of KI67 was not significant no significant difference in Ki67. PDL1 expression was equal in BM of SB28 vs Sham and SM of SB28 vs sham, but SM seems to express higher PDL1 level. Also, Monocytes from SM, not BM and DCs showed higher KI67 expression. Number of animals in statistics: in (a), 5 mice/sham; 6 mice/GL261; in (b), 7 mice/sham; 6 mice/GL261; in (c), 7 mice/sham; 4 mice/GL261; in (d), 7 mice/sham; 4 mice/GL261; in (e), 5 mice/sham; 8 mice/GL261; in (f), 7 mice/sham; 7 mice/GL261. Data are presented as means ± SEM. Significance was assessed as Mann-Whitney U test (*, p < 0.05; **, p < 0.01).
Supplementary information
Supplementary Table 1
Supplementary Table 1. cd45 frequency, myeloid cluster frequencies and lymphoid cluster frequencies.
Supplementary Table 2
Supplementary Table 2. Antibodies spectral flow matrix.
Supplementary Video 1
Supplementary Video 1. Light sheet imaging of early-stage (day 8) SB28 brain tumor showing skull osteoclasts. Three-dimensional, 360-degree-rotating image shows the brain and skull of one of SB28 GBM model. The green area is the glioblastoma tumor; the red areas are osteoclast cells in the skull; ×3.6 magnification.
Supplementary Video 2
Supplementary Video 2. Light sheet imaging of day 15 SB28 brain tumor showing skull osteoclasts. Three-dimensional, 360-degree-rotating image shows the brain and skull of one of SB28 GBM model. The green area is the glioblastoma tumor; the red areas are osteoclast cells in the skull; ×3.6 magnification.
Supplementary Video 3
Supplementary Video 3. Light sheet imaging of late-stage SB28 brain tumor showing skull osteoclasts. Three-dimensional, 360-degree-rotating image shows the brain and skull of one of SB28 GBM model. The green area is the glioblastoma tumor; the red areas are osteoclast cells in the skull; ×3.6 magnification.
Rights and permissions
Open Access This article is licensed under a Creative Commons Attribution-NonCommercial-NoDerivatives 4.0 International License, which permits any non-commercial use, sharing, distribution and reproduction in any medium or format, as long as you give appropriate credit to the original author(s) and the source, provide a link to the Creative Commons licence, and indicate if you modified the licensed material. You do not have permission under this licence to share adapted material derived from this article or parts of it. The images or other third party material in this article are included in the article’s Creative Commons licence, unless indicated otherwise in a credit line to the material. If material is not included in the article’s Creative Commons licence and your intended use is not permitted by statutory regulation or exceeds the permitted use, you will need to obtain permission directly from the copyright holder. To view a copy of this licence, visit http://creativecommons.org/licenses/by-nc-nd/4.0/.
About this article
Cite this article
Dubey, A., Yamashita, E., Stangeland, B. et al. Brain tumors induce widespread disruption of calvarial bone and alteration of skull marrow immune landscape. Nat Neurosci (2025). https://doi.org/10.1038/s41593-025-02064-4
Received: 03 September 2024
Accepted: 22 August 2025
Published: 03 October 2025
DOI: https://doi.org/10.1038/s41593-025-02064-4


