.png)

We’ve all been there - staring at a bug that makes absolutely no sense.
You’ve tried everything you can think of, but the issue persists…
Debugging doesn’t have to be this painful.
It’s a skill you can develop with the right strategies and tools.
It’s something you can learn and get better at.
Mastering debugging can save you time, energy, frustrations, and money as well as improve your code quality.
In today’s article, I’ll share ten practical debugging techniques I use daily that have saved me countless hours.
I’ll also show you some modern tools that could make these strategies even more effective.
Being effective while debugging is crucial.
It’s really important to get it right so you find the root cause of the issue, fix it asap, and then make your customers happy.
Over the years, as a Software Engineer, I’ve found that good debugging is not only about the processes and systems you employ, but also about your mindset and tooling.
I’ve played around with various tools both at my daily job and side projects.
Recently, I tried out Multiplayer, a new session replay platform that captures both the front-end and back-end traces.
I believe we can make debugging much simpler with the help of Multiplayer, effective, and easier to do.
You can’t fix what you can’t see.
The foundation of effective debugging is consistently reproducing the bug.
Start by writing step-by-step instructions that make the bug appear every time.
For example, map out how a user request flows through the whole system, so you build a clear mental model.
This is especially useful in the context of microservice architecture, where a single user request might hit several services.
Finding the bug in the ground schema is hard if you don’t have a good understanding of the flow.
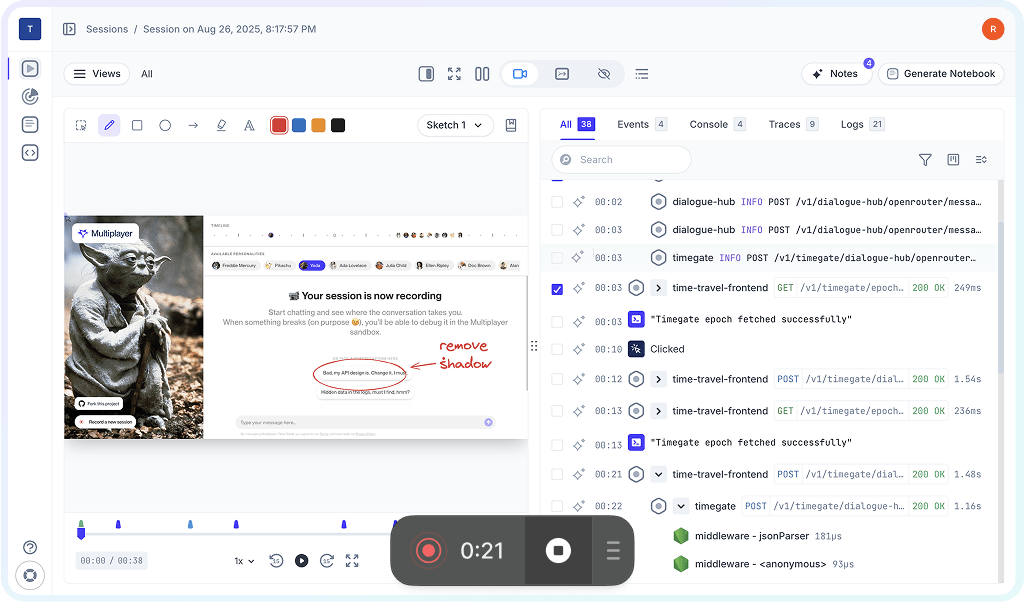
Nowadays, there are tools that record session replays, so you can leverage them to see the flow from the front-end to the back-end instead of doing it manually.
An example of such a tool is Multiplayer, which captures full-stack session recordings.
Once you know how to reproduce a bug, make it fast.
Configure your development environment to jump straight to the problematic area.
This helps to quickly test various hypotheses and solutions.
Every second you save between reproducing the bug and testing a fix compounds over the course of dozens of debugging iterations.
Debugging an issue in a complex system —from front-end to back-end —is hard.
It requires acquiring as much information and context as needed.
Imagine a user reporting a problem—“the page crashed”—but you miss information like why they clicked, what data they had loaded, or the system's state.
So, before digging into the problem, try to collect as much context as possible—ask your product manager, write an email to a client, check recordings, logs, etc.
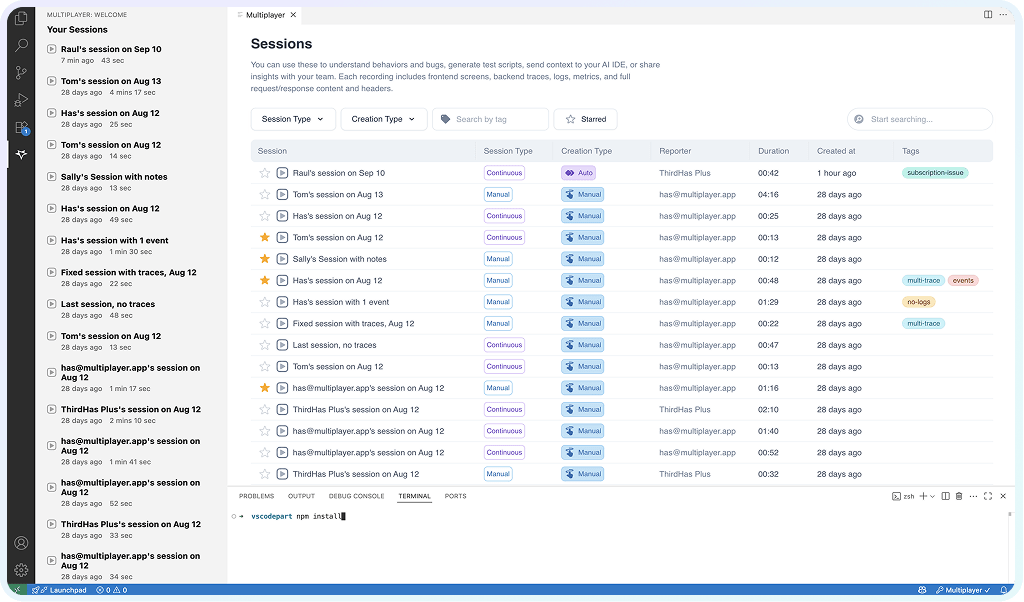
You might also consider using a tool like Multiplayer, which silently captures user sessions so you can collect all the context related to a single issue.
Large codebases make finding bugs like finding a needle in a haystack.
You need to narrow down the scope quickly.
Use a binary search approach: divide your code into working and non-working parts.
Comment out half of the suspicious code. Does the bug occur? If yes, the problem is in the other half. If no, it’s in the code you commented out.
You might also use breakpoints like a binary search to quickly jump to different points in your code.
Repeat this process until you’ve nailed the problematic area.
The main goal is to minimize the scope from “somewhere in this 1000-line file” to “somewhere in these 20 lines”.
Debuggers are invaluable tools that provide real-time insights into your program’s execution.
You can set breakpoints, inspect variables, step through the code line by line, and examine the call stack.
The main benefit is that you can easily see the exact flow of your program and spot anomalies as they happen.
If you’re using tools for recording session replays, you could bring those recordings directly into your IDE.
I’ve personally tried Multiplayer and it worked like a charm.
Rubber duck debugging is simple but extremely powerful.
The main idea is that you explain your code line by line to an object (🦆), a colleague, or even yourself.
You describe what you expect to happen at each step.
The act of explaining forces you to slow down and verify your assumptions.
There is a big difference in how we think about the code when we read and when we speak loudly about it.
I’ve caught the bug many times in the middle of the explanation.
To achieve good results while debugging, you must adopt a more scientific, methodological approach and avoid any random changes.
Do the following
Form a hypothesis about the root cause (ex, “I think the API is returning null when the user has no preferences…”).
Experiment to verify it (add logging, set breakpoints, etc).
Observe the result (confirm or reject the hypothesis).
Fix the code based on what you learned.
Verify the fix actually solves the problem.
Repeat the cycle again with a new hypothesis if needed.
This systematic approach prevents you from going in circles and helps you build an understanding of your codebase.
When a bug is particularly hard, write down what you’ve tried.
Keep a running list of your experiments, hypothesis, and their results.
This prevents you from doing the same thing twice and expecting different results.
Documentation also makes it easier for others to help you.
You can easily ping a colleague, share your progress, and learnings so far.
You might also consider a tool like Multiplayer to annotate session replays with sketches and comments.

This might sound counterintuitive, but stepping away from your laptop is sometimes the fastest way to solve a bug.
Taking a 15-minute walk allows your mind to rest and your subconscious to process the problem.
I can’t count how many times the solution to a difficult bug popped into my head while taking a walk, being at the toilet, or just making a drink.
There’s something about disengaging from the problem that allows your brain to make new connections.
AI coding tools can be powerful debugging partners, especially if you give them the right information.
The right context is the key.
Try providing as much information about the bug as possible to your AI IDE and see how it could reason about it.
Of course, it’s not always correct, but you can quickly test and verify certain hypotheses.
Then, you could focus on the ones your AI coding tool hasn’t thought about.
It’s also helpful if you could share screenshots or session recordings to provide context.
I’ve personally tried Multiplayer’s integration.
I’ve used it to feed my AI assistant with a full-stack session recording, so it can see the full context of a problem.
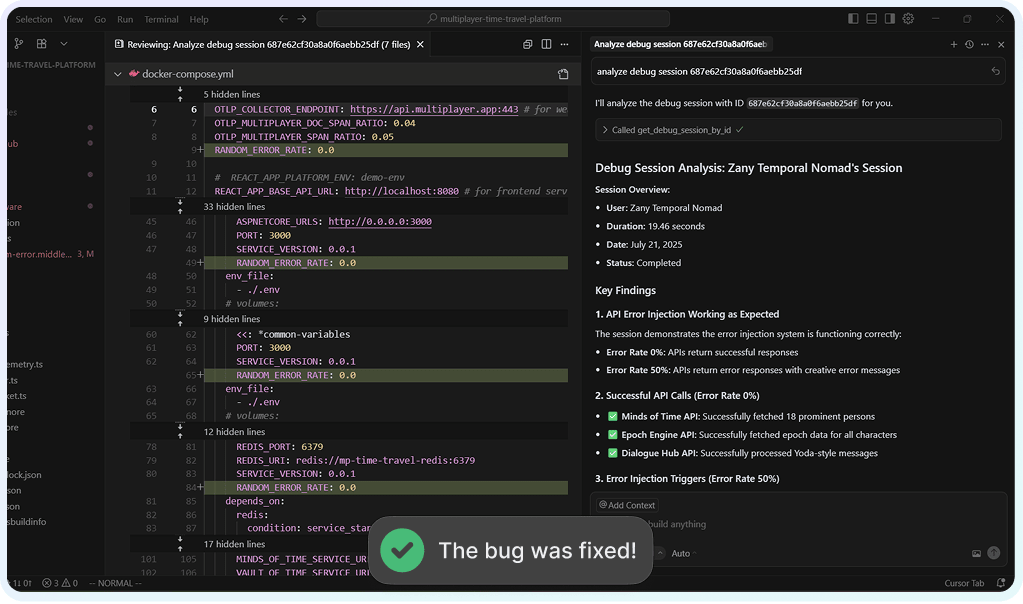
After that, I wrote specific prompts and dug deeper into the problem.
AI is not a magic solution, but it’s a valuable debugging partner when given complete information.
Multiplayer provides Full Stack Session Recordings.
Here’s how it helps with debugging and fixing bugs:
Capture full-stack session recordings.
Annotate your replays with sketches and comments.
Bring full-stack session recordings directly into your IDE.
Give your AI coding tools all the context they need.
Reproduce the error consistently.
Set up your environment to quickly reproduce the bug.
Capture the full context and information.
Isolate the problem.
Use your debugger.
Rubber duck the problem.
Form and test hypotheses.
Document your progress.
Take strategic breaks.
Leverage AI smartly.
Hope this was helpful.
See you next time!
Today’s action step: Take a look at your debugging process and see how you can apply at least one of the mentioned techniques.
You can find me on LinkedIn, Twitter(X), Bluesky, or Threads.
I share daily practical tips to level up your skills and become a better engineer.
Thank you for being a great supporter, reader, and for your help in growing to 28.5K+ subscribers this week 🙏