.png)

Introduction
Creative and artistic experiences have recently been proposed to improve brain health1,2. Creativity is defined here as the ability to produce ideas or solutions that are both novel and effective using one’s imagination. Creativity traditionally includes the arts, but video games can incorporate creative elements3. For instance, strategy video games, such as StarCraft II, materialize creativity in unique tactics, adaptive problem-solving, and personalized playstyles. These experiences, which include multiple domains from the arts to gaming1,2,4, may foster well-being in healthy participants and those with psychological and neurological disorders. Increased brain volume and connectivity correlate with different creative experiences4,5. However, the available evidence on specific brain health benefits is scarce6. Most studies comprise cognitive and emotional effects and well-being or neural correlates, without providing evidence for protective effects on the brain6.
Brain clocks measure accelerated brain age as observed in multiple brain diseases7,8,9,10. They offer a robust approach to assess accelerated or delayed brain aging by measuring deviations between chronological age and brain age, commonly referred to as brain age gaps (BAGs)8,9,10. These BAGs, derived from neuroimaging data, provide a quantitative measure of brain health, identifying individuals with faster or slower aging processes. Accelerated aging (larger positive BAGs) is observed in psychiatric and neurological conditions8,9,10, in vulnerable populations exposed to physical and social exposomes9,11,12,13, or in those with unhealthy lifestyles9,13. Conversely, people with healthier habits, such as systematic creative experiences, could be hypothesized to have delayed aging. Only a few works addressed the impact of creativity, specifically music expertise, on brain structural correlates and reported contradictory results14,15. While structural and functional BAGs can be estimated, the latter may be more sensitive to plasticity-driven effects of interventions and lifestyle on brain aging9,16.
A critical concern in the literature on the health effects of creative experiences is the lack of mechanistic insight17. Biophysical models and graph theory can help elucidate general mechanisms of aging7,18, such as the inter-area coupling modulated by plasticity and the underlying organization of brain networks19,20. These mechanisms and organizational features, as revealed through generative models and graph-theoretical approaches7, could inform the properties of brain clocks and their potential modulation by creative experiences. This synergy can help to understand the underlying brain mechanisms driving accelerated or delayed brain aging7. Thus, brain clocks combined with mechanistic models represent a promising tool for investigating the potential protective effects of diverse creative experiences on brain health. To our knowledge, no studies have yet explored this relationship.
Here, we investigate the potential protective effects of creative experiences on brain clocks in a large sample of participants (N = 1472). We developed creative-sensitive measures of accelerated and delayed brain age using brain clocks, graph theory, and biophysical modeling7,8,9,21. First, we robustly estimated brain clock models using machine learning and EEG data from 1240 participants. Then, we computed brain age gaps from M/EEG data in individuals with different levels of creative experiences (N = 232). These involved age-, sex-, education- and geography-matched groups of expert and non-expert tango dancers, musicians, visual artists, and video game players (study 1); and explored the pre/post-effects of short-term learning in a separate group of video game training (study 2). This design allowed us to investigate and compare the effects of consolidated professional expertise vs short-term learning.
Here, we showed that cross-domain creative experiences are associated with delayed brain aging as measured by BAGs. We found that lower negative BAGs in people with more creative experiences would be mainly observed in frontoparietal hubs, as these are regions vulnerable to aging22,23,24,25. An association between delayed brain aging and the degree of creative expertise was observed in experts (e.g., years of practice) and learners (pre/post-learning outcomes)26,27,28. These effects were larger in the expertise study that involved long-term training than pre/post-effects in non-expert participants involving short-term learning28,29,30. Using biophysical modeling and graph theory, we observed that creative experiences are related to plasticity-driven functional alterations27,31, such as increased local and global efficiency26,27 and modulations in biophysical coupling32,33, as previous reports show impaired segregation and reduced connectivity strength in aging34,35,36. The design allows us to investigate cross-domain convergent impacts of creativity on BAGs, with specific mechanisms related to these potential protective effects, providing insights about the impact of cumulative creative experiences on brain health. These results may inform future public policies to improve health and well-being through creativity and the arts37.
Results
The overall pipeline is shown in Fig. 1. We included 1,473 participants to (a) create brain clock models and (b) test them in groups with varying levels of creative experience (Fig. 1a, b). This analysis included two main groups: expert vs. non-expert participants across various creative domains (study 1), and non-experts undergoing short-term video game training (pre/post-learning, study 2) (Fig. 1c and Table 1). For the study of expertise, we included sex-, education-, and geography-matched groups of experts vs. non-expert participants in dance (tango, age range 18–50 years), music (instrumentalists and singers, 22–41 years), visual arts (drawing, age range 20–37 years), and real-time-strategy video games (StarCraft 2, age range 18–31 years). In the pre/post-learning study, we compared outcomes before and after video game training in non-expert participants (age range 20–30 years). The brain clock model was built using machine learning and source-localized EEG functional connectivity across 1,240 participants (age range 17-91 years) (Fig. 1d and Table 1). The architecture consisted of support vector machine (SVMs) models, trained with EEG connectivity using a 5-fold cross-validation and hyperparameter tuning. From the model, we computed BAGs, defined as the difference between predicted and chronological age. BAGs > 0 indicate accelerated brain aging, and BAGs < 0 indicate delayed aging (Fig. 1d). BAGs and brain clocks constitute a normative approach for systematically measuring the impact of creative experiences on brain health using the same space of M/EEG sources, defined by an anatomical brain parcellation38, and using a standardized score of brain health (the BAGs). The trained brain clocks were used to test the BAGs on 232 participants across and within creative domains.
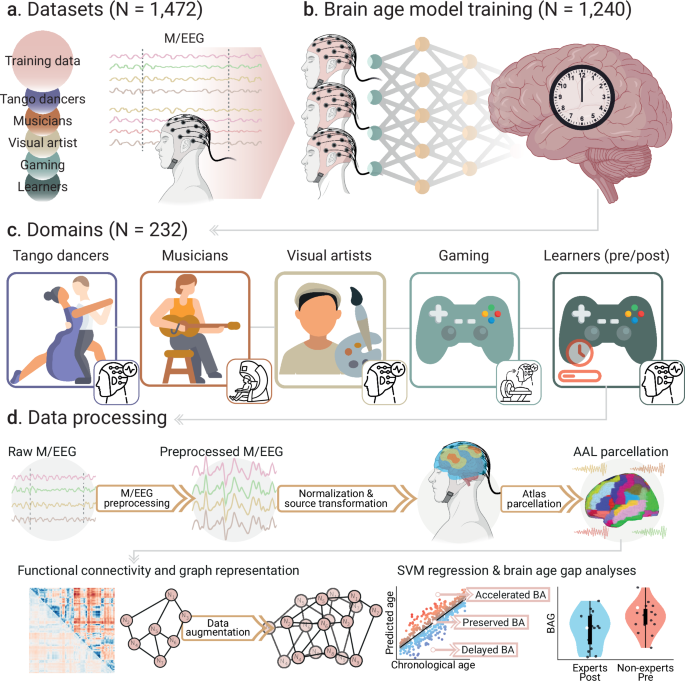
a We included M/EEG data from diverse populations (N = 1472) across 13 countries: Canada, Chile, Argentina, Cuba, Colombia, Brazil, the United Kingdom, Ireland, Italy, Greece, Turkey, Poland, and Germany. b We used a subsample of N = 1240 participants for training the support vector machines (SVMs) using EEG. These SVMs were used to predict the participants’ brain ages across all domains. c The remaining data (N = 232) was used for out-of-sample validation, and it consisted of M/EEG datasets related to different types of creative expertise and learning. Four of these groups represent creative expertise in dance (tango), music (instrumentalists and singers), visual arts (drawing), and video games (StarCraft 2) (study 1 about expertise). Additionally, we included one group with video game learning (StarCraft 2) (study 2 about pre/post-learning). d Before training the SVMs, raw M/EEG signals were preprocessed, normalized, and transformed into the source space using the AAL brain parcellation. From the source-transformed signals, we computed the functional connectivity matrices for all participants. We used data augmentation when training the SVMs to increase the model’s robustness and accuracy. From the trained SVMs, we computed the brain age gaps (BAGs) of participants as the difference between the model predictions and their chronological ages. BAGs > 0 can be interpreted as accelerated brain aging, and BAGs <0 as delayed brain aging. Points and violin plots in the figure are schematic examples. Created in BioRender. Migeot, J. (2025) https://BioRender.com/99vpcts (EEG device and brain illustrations).
The training brain clock model yielded robust results. Accurate age estimation performance was consistent with previous studies using the mean absolute error (MAE) and Pearson’s correlation8,39 (MAE = 8.696 years, r = 0.742, p < 0.001, N = 1240 participants, Cohen’s f 2 = 1.11, Fig. 2a). BAGs were associated with reduced connectivity in age-related networks, specifically frontoparietal and frontal-to-occipital connections22,23,24,25 (Fig. 2b, c and Fig. S2 in Supplementary Information). BAGs were not explained by differences in data quality (Fig. S1 in Supplementary Information).
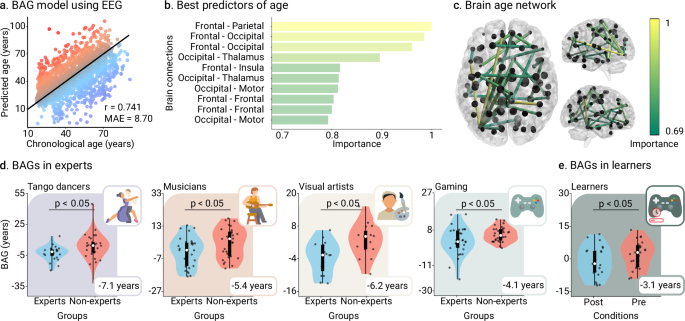
a The model’s performance was assessed by computing the Pearson’s correlation and the mean absolute error (MAE) between the predicted age and the real chronological age of participants (N = 1,240 participants). Red/blue colors represent accelerated/delayed aging. b Most important (informative) brain connections for predicting age. Top connections reflect the highest absolute SVR weights, indicating their importance in age prediction. c The brain age network comprises the set of most informative connections; the thickness of the edges represents the features’ importance of connections for predicting age using SVMs. d BAGs in the expertise study (N = 196 participants), i.e., tango dancers (ΔBAGs = −5.50, [−8.17, −2.84]95%, t(194) = −4.823, p < 0.001, D = −0.69), musicians (ΔBAGs = −5.38, [−10.21, −0.56]95%, t(58) = −2.237, p = 0.035, D = −0.60), visual artists (ΔBAGs = −6.2, [−10.79, −1.60]95%, t(28) = −2.761, p = 0.028, D = −1.04), and gaming (ΔBAGs = −5.38, [−10.21, −0.56]95%, t(58) = −2.237, p = 0.035, D = −0.60). e. BAGs in the pre/post-learning study (N = 24 participants) (ΔBAGs = −3.06, [−5.27, −0.85]95%, t(23) = −2.863, p = 0.028, D = −0.46, FDR-corrected). Points in scatter plots represent participants. Box plots show the median and the first and third quartiles; whiskers mark the minimum and maximum values, and each point represents one participant. Groups were compared using t-statistics with two-sided p-values, FDR-corrected.
Higher levels of creative experiences are associated with delayed brain age
Lower negative BAGs were observed in experts than in non-experts across domains (ΔBAGs = −5.50, [−8.17, −2.84]95%, t(194) = −4.823, p < 0.001, D = −0.69, Fig. 2). These results were replicated in each domain: tango dancers (ΔBAGs = -7.1, [−12.82, −1.47]95%, t(44) = −2.563, p = 0.028, D = -0.77, Fig. 2d) musicians (ΔBAGs = −5.38, [−10.21, −0.56]95%, t(58) = −2.237, p = 0.035, D = −0.60, Fig. 2d), visual arts (ΔBAGs = −6.2, [−10.79, −1.60]95%, t(28) = −2.761, p = 0.028, D = −1.04, Fig. 2d), and gaming (ΔBAGs = −4.06, [−7.43, −0.68]95%, t(60) = −2.422, p = 0.028, D = −0.63, Fig. 2d). In the pre/post-learning study, lower negative BAGs were observed in the post-learning condition compared to the pre-learning one (ΔBAGs = −3.06, [−5.27, −0.85]95%, t(23) = −2.863, p = 0.028, D = −0.46, FDR-corrected, Fig. 2e). These effects were specific to StarCraft II itself, as we did not find any differences in the active control of the pre/post design (ΔBAGs = 0.057, [−4.51, 4.62]95%, t(11) = 0.0274, p = 0.979, D = 0.0092, FDR-corrected, Figure S11 in Supplementary Information). Conversely, significant differences were observed when comparing learners and active controls (Δ(ΔBAGs) = −3.152, [−8.04, 1.81]95%, U(35) = 90, p = 0.036, D = −0.49, Table S11 in Supplementary Information). Thus, results showed moderate to large effects of creativity expertise on BAGs, and small to moderate effects of short-term learning.
Degree of expertise and performance modulate the brain age gaps
We explored the associations of levels of creative experience with BAGs. In the expertise study, the BAGs and the expertise scores were converted into z-scores (section Expertise scores and BAGs standardization in Methods for details). The more skilled participants have lower BAGs (r = −0.306, p = 0.003, N = 105 participants, Cohen’s f 2 = 0.103, FDR-corrected, Fig. 3a). Thus, the degree of individual expertise across four domains (tango dancers, musicians, visual artists, and gaming) was associated with delayed brain age. For the pre/post-learning study, we used the number of actions per minute (APM, section Pre/post-learning design in Methods), which provides a reliable score of in-game performance40, increased after post-learning (ΔAPM = 3.83, [2.45, 5.21]95%, t(19) = 5.804, p < 0.001, D = 0.68, Fig. 3b-c). A negative correlation between ΔBAGs and ΔAPM (r = −0.508, p = 0.022, N = 20 participants, Cohen’s f 2 = 0.349, FDR-corrected, Fig. 3d) evidenced that participants with reduced post-learning BAGs also showed improved performance.
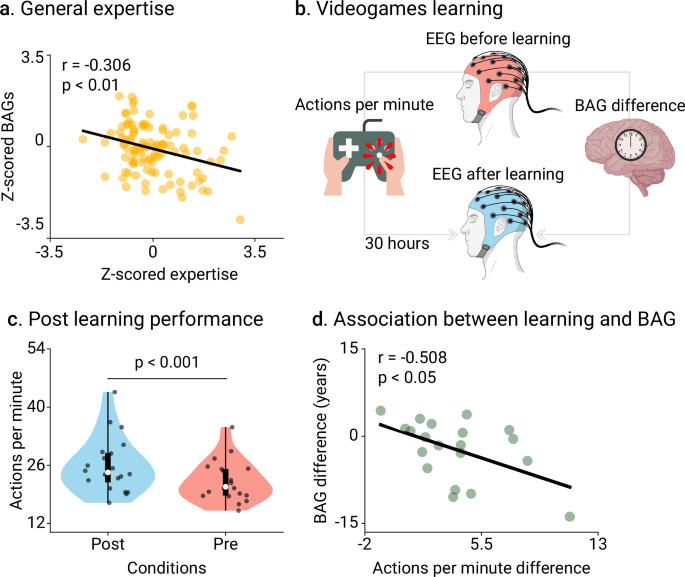
a Correlation between BAGs and scores of expertise for tango dancers, musicians, visual artists, and gaming (r = −0.306, p = 0.003, N = 105 participants, Cohen’s f 2 = 0.103). Scores and BAGs were previously transformed into z-scores. b Scheme representation of the pre/post-learning study design. EEG recordings were acquired before learning (period 0) and thereafter (period 2). The in-game performance was assessed using the average actions per minute (APM) between periods 2 and 1 (post), and periods 0 and 1 (pre). c, d. Post- and pre-learning APM (N = 20 participants) (ΔAPM = 3.83, [2.45, 5.21]95%, t(19) = 5.804, p < 0.001, D = 0.68), and correlation between changes in APM and BAGs (r = -0.508, p = 0.022, N = 20 participants, Cohen’s f 2 = 0.349). Points represent participants. Box plots show the median and the first and third quartiles; whiskers mark the minimum and maximum values, and each point represents one participant. Groups were compared using t-statistics with two-sided p-values, FDR-corrected. Created in BioRender. Migeot, J. (2025) https://BioRender.com/99vpcts (EEG device and brain illustrations).
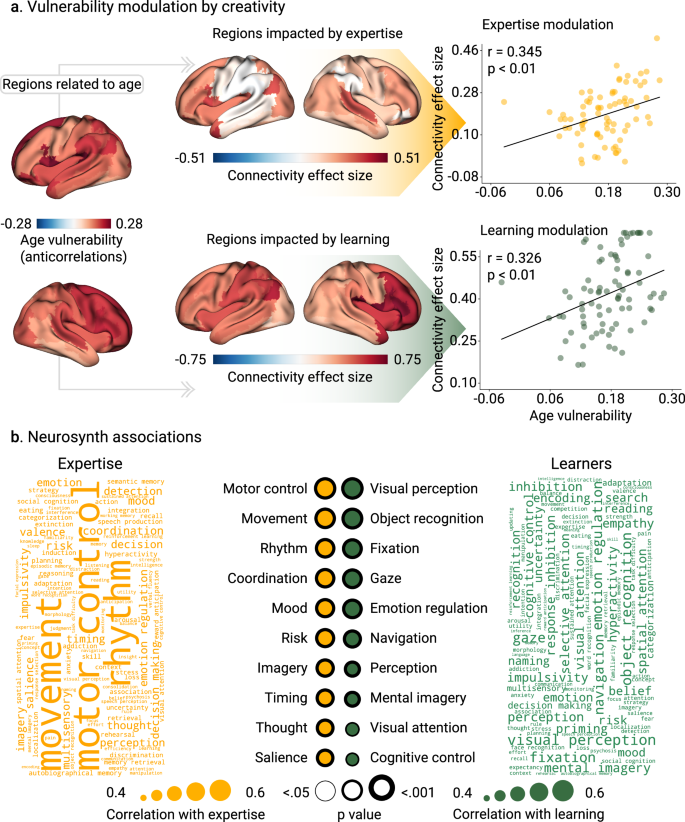
a The anticorrelation between nodal functional connectivity and age represents age vulnerability. Associations between age vulnerability and increased brain connectivity are driven by creative experiences. The areas that have the greatest increase in connectivity are the ones with higher Cohen’s D effect sizes. The brain of the experts’ group is the average brain across dance dancers, musicians, visual artists, and gamers. Scatter plots represent the associations in expertise (r = 0.345, p < 0.001, N = 78 brain areas, Cohen’s f 2 = 0.135) and learning (r = 0.326, p < 0.001, N = 78 brain areas, Cohen’s f 2 = 0.119). Points in scatter plots represent brain areas. b Neurosynth associations with brain connectivity increase in creative experiences. We reported the absolute Pearson’s correlation between brain connectivity and association maps of different cognitive processes (N = 78 brain areas). FDR-corrected p-values are shown, and the thickness of the circles represents statistical significance. The p-values were computed using the Spin test up to 10,000 permutations before performing the FDR correction.
Using the attentional blink paradigm task outcomes, we then analyzed how the effects of pre/post learning can be translated to generalized performance. Results showed significant improvements after training: participants responded faster to the first question (T1; Δ = −141.28, [−238.84, −43.73]95%, t(23) = −2.996, p = 0.026, D = −0.61, FDR-corrected), and exhibited higher accuracy on the second question (T2; Δ = 6.71, [−10.75, 24.16]95%, t(23) = 5.958, p < 0.001, D = 1.22, FDR-corrected). We found no effects in the active control group (results in Supplementary Information Table S6).
The BAG networks comprise regions with age-related vulnerability and expertise
We analyzed whether creative experience had a protective effect in age-vulnerable brain regions. Using the training data, we built a map of brain age vulnerability, which consisted of the areas anticorrelated with chronological age (section Brain maps and Neurosynth associations in Methods for details). Then, we explored the association of regional alterations in nodal strength in (a) expert vs non-expert participants, and (b) pre/post-learning (Fig. 4a). In the expertise study, a correlation between age-related vulnerability regions and changes in nodal strength (r = 0.345, p < 0.001, N = 78 brain areas, Cohen’s f 2 = 0.135, spin test, FDR-corrected, Fig. 4a) involved frontoparietal hubs. In the pre/post-learning study, we also found similar significant associations (r = 0.326, p < 0.001, N = 78 brain areas, Cohen’s f 2 = 0.119, FDR-corrected, Fig. 4a).
We performed a Neurosynth21 analysis to explore the possible underlying cognitive processes involved in the BAG association, i.e., increased connectivity strength with creativity-related cognitive process (Fig. 4b). In the expertise study, the main regions were involved in motor control, movement, rhythm, coordination, imaginary, and visual salience, among others (Fig. 4b). In the pre/post-learning study, associations with cognitive domains were primarily related to attention, i.e., visual perception, object recognition, fixation, perception, and visual attention (Fig. 4b).
Increased network efficiency and coupling strength in creative experiences
We explored causal mechanisms associated with BAGs. First, we investigated the BAG networks and brain efficiency via graph theory41, using global and local efficiency measures (Fig. 5a). In the expertise study, a small negative correlation between z-scored BAGs and global efficiency (r = −0.247, p < 0.001, N = 195 participants, Cohen’s f 2 = 0.065, FDR-corrected, Fig. 5b), and a large correlation with local efficiency (r = −0.479, p < 0.001, N = 195 participants, Cohen’s f 2 = 0.298, FDR-corrected, Fig. 5b) were observed. In the pre/post-learning study, the same association was identified but only with Δlocal efficiency (r = −0.490, p = 0.023, N = 24 participants, Cohen’s f 2 = 0.316, FDR-corrected, Fig. 5c). Thus, the lower the BAGs, the more efficient the brain networks are, especially at local levels.
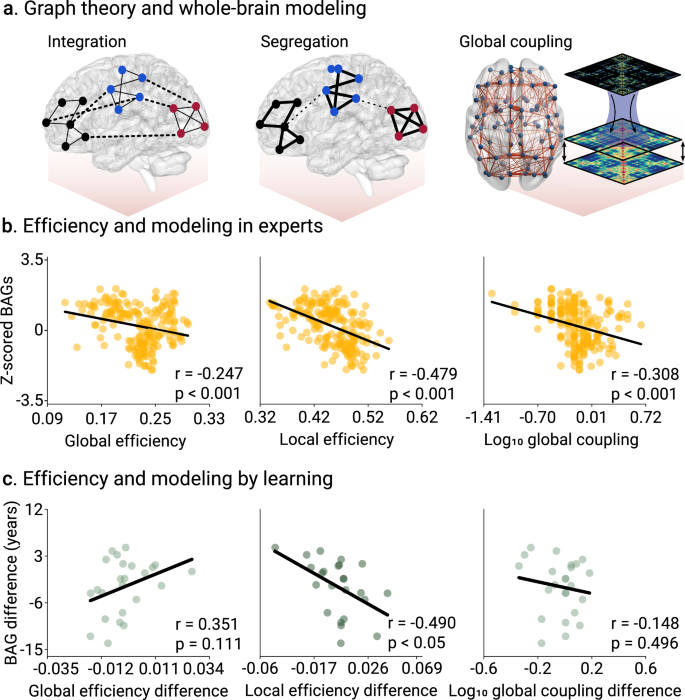
a Using M/EEG functional connectivity, we characterized two efficiency-based properties of brain topology, namely integration, related to general information processing, and segregation, ascribed to specialized information processing. We then used a generative model of EEG activity to test mechanisms based on global coupling modulation. b Efficiency metrics and modeling parameters in the expertise design (tango dancers, musicians, visual artists, and gaming). We reported significant correlations between BAGs and global efficiency (r = −0.247, p < 0.001, N = 195 participants, Cohen’s f 2 = 0.065), local efficiency (r = −0.479, p < 0.001, N = 195 participants, Cohen’s f 2 = 0.298), and global coupling (r = −0.351, p < 0.001, N = 195 participants, Cohen’s f 2 = 0.105). c Efficiency metrics and modeling parameters in the pre/post-learning design. We reported significant correlations between BAGs and local efficiency (r = −0.490, p = 0.023, N = 24 participants, Cohen’s f 2 = 0.316), but not with either global efficiency (r = 0.351, p = 0.111, N = 24 participants, Cohen’s f 2 = 0.141), or global coupling (r = −0.148, p = 0.492, N = 24 participants, Cohen’s f 2 = 0.022). Points in scatter plots represent participants. FDR-corrected p-values.
Second, generative whole-brain modeling was used to investigate causal mechanisms based on generative modeling. The global coupling parameter modulates the biophysical strength of brain connections32,33 (Fig. 5a, see also the goodness of fit in Figs. S4, 5 in Supplementary Information). In the expertise study, a negative correlation between BAGs and global coupling (r = −0.351, p < 0.001, N = 195 participants, Cohen’s f 2 = 0.105, FDR-corrected, Fig. 5b) suggests that long-term creative expertise drives biophysical coupling across domains. As expected, this effect was not observed in the more transient and short-term creative experiences assessed in the pre/post-study (r = −0.148, p = 0.492, N = 24 participants, Cohen’s f 2 = 0.022, FDR-corrected, Fig. 5b)
Sensitivity analyses
ANCOVAs controlling for age, sex, and education confirmed that expertise significantly predicted BAGs across all creative domains (tango dancers, musicians, visual artists, and gamers). These effects remained significant after FDR correction, supporting the robustness of our main findings (Table S8 in Supplementary Information).
We found that the spatial correlations between age vulnerability and connectivity effect sizes remained significant when analyzed separately for each domain. Specifically, robust positive correlations were observed for tango dancers (r = 0.333, p = 0.002, N = 78 brain areas, f² = 0.125, spin test, FDR-corrected), musicians (r = 0.350, p = 0.001, N = 78 brain areas, f² = 0.140, spin test, FDR-corrected), visual artists (r = 0.246, p = 0.013, N = 78 brain areas, f² = 0.064, spin test, FDR-corrected), and gaming (r = 0.282, p = 0.01, N = 78 brain areas, f² = 0.086, spin test, FDR-corrected) (Fig. S8 in Supplementary Information).
Participants classified as BAG-younger (i.e., with brain age gaps below the 35th percentile) showed significantly higher domain-specific expertise than those classified as BAG-older (i.e., above the 65th percentile). This pattern was consistent across domains: tango dancers (Δ = 21.25, [−13.26, 55.76]95%, U(30) = 118.5, p = 0.016, FDR-corrected), musicians (Δ = 4.75, [−0.22, 9.72,]95%, U(38) = 26.5, p = 0.030, FDR-corrected), visual artists (Δ = 2.77, [−2.09, 4.85]95%, U(20) = 138, p = 0.008, FDR-corrected p = 0.016), and gaming (Δ = 11.21, [4.47, 17.95]95%, U(42) = 69.5, p = 0.005, FDR-corrected). The results are summarized in Table S9 in the Supplementary Information.
We compared BAG estimates with and without age bias correction. The main group effects remained consistent across approaches (Fig. S10 in Supplementary Information), confirming that our findings are not driven by regression-to-the-mean artifacts. We observed no meaningful differences in prediction slopes between 64- and 128-channel EEG data in either the training or creativity datasets (Supplementary Table S10).
Discussion
This study addressed how different creative experiences were associated with brain health measures of delayed biological age while exploring age-related brain mechanisms. Creative experiences were linked to delayed brain aging across domains and in both expertise and short-term learning studies. The degree of expertise and learning correlated with BAGs. Creative experiences enhanced connectivity in brain regions vulnerable to age, as well as in areas associated with creativity processes. Increased network efficiency and global coupling contributed to lower BAGs, which were more accentuated in the expertise study. Thus, delayed brain aging, driven by creative experiences, presented an inverted pattern (accelerated aging) seen in many neurological disorders8,9,10,11. Our work provides evidence of reduced accelerated aging in domain-free creativity linked to expertise, experience, and underlying brain plasticity mechanisms.
Most of the evidence on brain clocks suggests that adverse conditions, such as neurological diseases, induce accelerated aging8,9,11,18,22. However, positive social determinants of brain health13 and lifestyles, such as physical activity and good cardiometabolic health9,13,42, education13,43,44, and prosociality45,46 may reduce accelerated aging. Organ and brain clocks have shown how protective factors modulate brain aging, reducing BAGs8,9,10. Although earlier studies suggested a potential effect of creativity on brain health1,2, our work directly addressed this question by showing delayed brain age in multiple creative domains. Domain-free results suggest that different creative experiences share common mechanisms31 and impact networks associated with aging22,23,24,25. Present results support the potential of creativity-based interventions for preventive strategies and supportive therapies for healthy populations and clinical settings1,2,3,4,37.
Delayed brain aging due to creative experiences could be attributed to neural plasticity mechanisms31 and brain specialization5,27. Increased local efficiency through creativity is a hallmark of brain specialization, enhancing the communication bandwidth of expertise-related networks26,27,28, while higher global coupling improved communication across the brain19. Many studies have assessed graph properties associated with aging34,35,36, but no previous study has used them to describe the organizational properties of BAGs. Our results suggest that increased local efficiency with lower BAGs is similar to other brain organizational changes observed with aging, i.e., the reduction of brain segregation34,35,36. Neural plasticity mechanisms31 can drive these changes, supporting more efficient brain connectivity and information transfer between networks26,27,29,47,48,49, with increased network efficiency directly contributing to lower BAGs. Creativity experiences have been linked to structural and functional changes in brain regions vulnerable to aging and involved in creativity-related cognitive processes22,23,24,25. These consisted mainly of frontoparietal hubs, critical for attention, motor control, coordination, and rhythm5,25. Longer training periods result in stronger neural plasticity effects26,27,47, which explains the greater impact on brain connectivity in experts compared to learners, and the correlation between BAGs and expertise level. More domain-specific and smaller effects observed in the learning study might be ascribed to the short-term nature of the training design and specific video game engagement5.
The present work has multiple strengths. We utilized a large and diverse sample for both training the brain clocks, and for different creative experiences, applying state-of-the-art computational methods (machine learning, Neurosynth metanalysis, graph theory, and generative modeling) to assess the effect of creativity on brain health. Our analytical pipeline effectively addressed key confounding factors related to recordings, signals, and demographics, ensuring the reliability and accuracy of the BAGs computation. Although previous works found mixed effects of music expertise on brain health using structural brain age estimation14,15, our work made a step forward using functional connectivity and showing a domain-free positive effect of creativity on brain health. We found a tiered effect of creativity, with higher effects associated with long-term expertise and lower effects in short-term learning; all these outcomes scaled with participants’ skills and post-training performance. The inclusion of an active control group allowed us to isolate the specific effects of learning, as we observed no BAGs or cognitive changes associated with active controls. This reflects the genuine training-related plasticity effects in our pre/post-learning design, showing that short, targeted training can improve specific and generalized performance. Lastly, we provided plasticity-related mechanisms underlying creativity’s differential effects on brain clocks.
Our study also presents multiple limitations, calling for further research. We focused on brain aging, to understand the biological embedding and health-related measures of creativity. Future research should combine brain clocks with cognition, physical health, and well-being9,10,13. Accelerated aging, as measured with increased positive BAGs in literature, is typically associated with adverse outcomes, including disease, unhealthy lifestyles, or increased disparities8,9. However, future studies should develop methodologies that disentangle the potential positive healthy aging outcomes. Although our sample was heterogeneous, we used a normative approach that produced consistent results across groups. While the sample size of each group was relatively small, it remains one of the largest samples of studies in creativity and neuroscience, showing systematic effects in each group and across domains. Still, larger studies exploring additional creative domains are needed, e.g., acting and writing. Gaming can be considered a type of creative experience3, even though it is not traditionally classified as such. For this reason, we repeated the analyses in the expertise study, excluding the gaming groups. The results remained unchanged (Fig. S7 in Supplementary Information). Despite the heterogeneity of the groups, the findings consistently suggest delayed brain aging across all domains. Moreover, we observed domain-specific associations between artistic performance and brain clock metrics. If other than creativity effects (i.e., cognitively engaging activities) underlie these effects, they likely constitute core components of creative experience that manifest across modalities. Future studies should investigate the underlying subprocesses of creative experiences and their potential distinct effects on brain clocks. An additional limitation of our work is the small sample size used for the pre/post-learning design, and especially the active control group. Although both results convergently showed the effects of the intervention, the limited sample size could under/overestimate the magnitude of the outcomes. While EEG simulations derived from structural data (DTI) offer valuable insights into large-scale brain dynamics27, they remain approximations of actual neural activity and should, therefore, be interpreted with caution. However, EEG simulations and other datasets showed similar BAG effects. From a modeling point of view, additional neural plasticity mechanisms should be further assessed with other architectures, such as neural mass models19,32,33,50, and by integrating M/EEG and fMRI to provide cross-modal mechanisms.
We used Pearson’s correlation for its interpretability and reproducibility across different modalities. Source localization reduces, but does not eliminate, volume conduction and spatial leakage, improving the reliability of correlation-based connectivity relative to sensor-level analyses51. However, as Pearson’s correlation is susceptible to volume conduction artifacts52, future works should be replicated using alternative connectivity metrics53 (e.g., imaginary coherence, phase-lag index, or high-order interactions) to ensure the robustness of findings. Another limitation was the use of EEG data recorded with different numbers of electrodes, as lower sensor density may increase signal leakage and distort connectivity estimates54. However, our sensitivity analyses showed that electrode count did not affect the brain age models. Compared to raw functional connectivity measures, BAGs provide coarser-grained estimates that are more robust to sensor density variations. In previous work8, BAG estimates remained stable across EEG systems, channel counts, and signal quality when our data harmonization was applied. Importantly, each dataset in the creativity study included its own control group, ensuring that differences between experts and non-experts or pre- and post-learning were not confounded by electrode numbers.
As the sample used to train the data likely includes more non-experts than experts, brain age models may present a bias. However, there are multiple reasons to believe this is not the case. The experimental design controls for typical variables (age, sex, education, and in some domains, additional factors such as general cognition). Differences between BAGs—at least in terms of the variables typically used for group comparisons—are better explained by differences in creativity. Moreover, the consistency of delayed brain age was observed across groups, domains, and comparisons (between-group contrasts and pre/post designs), suggesting a systematic association between creativity and delayed brain age, despite potential random factors. Furthermore, the association and consistent directionality of BAGs with performance measures, along with the same effects in pre/post design, reinforce this idea. Nonetheless, we cannot fully rule out other contributing factors, and future research should address potential additional confounders. Demographic and individual factors are known to influence BAG8. Our comparisons controlled for standard variables, including age, sex, education, and geography (and cognition in the gaming and tango dancers). Likewise, the pre/post-learning intrasubject design controls all confounding and familial effects with an active control condition. Nonetheless, future studies should examine how the protective effects of creative experiences are potentially influenced by socioeconomic status and other individual-level variables. Finally, our results are consistent with previous findings on the effects of lifestyle8 and interventions16 on brain aging, including the scalability of these effects16. Moreover, they align with the notion that lifestyle and intervention-related changes tend to produce smaller effects than those observed in patient-control comparisons8,9.
Overall, our findings provide a framework to study the biological embedding of creative experiences and their association with delayed brain aging. Creativity was associated with reduced brain age in long- and short-term contexts and according to subject-specific skill levels. Creativity-related delayed brain age was especially observed in age-vulnerable regions linked to cognitive processes supporting creativity and expertise, and was associated with brain efficiency and global coupling mechanisms. Our work may inform current calls to increase creativity as a social prescription and interventions in disease and well-being1,4,37 by providing specific brain health effects and mechanisms.
Methods
Participants and demographics
This report included a total of 1,467 healthy participants. We used data from 1240 healthy controls (HCs) from the EuroLaD EEG Consortium12, to train the SVM models, including participants from global settings. Specifically, 724 HCs were from the global north (Turkey, Greece, Italy, the United Kingdom, and Ireland) (age range 17–91 years, mean age 45.7 ± 22.6 years, 48.8% female/male distribution), while 516 were from the global south (Cuba, Colombia, Brazil, Argentina, and Chile) (age range 18–89 years, mean age 46.4 ± 18.5 years, 50% female/male distribution) (Fig. 1a-c, full demographics in Table 1)55,56. Inclusion criteria required normal cognitive function and no history of disease. Study protocols were approved by each contributing institution’s Institutional Review Board (IRB), and all participants provided informed consent following the Declaration of Helsinki. The complete demographics are presented in Table 1.
We used independent datasets already published, consisting of 232 participants from studies about creativity expertise (study 1) and pre/post-learning (study 2, Fig. 1c). For study 1, we compared experts and control non-expert participants, considering domains related to dance47 (N = 46, Argentina), music49,57 (N = 58, Canada), visual arts48 (N = 30, Germany), and gaming26 (N = 62, Poland). Both expert and non-expert participants were age-, sex-, education-, and geography-matched (Table 1). Participants in the gaming group were also matched by working memory capacity (Table S1 in Supplementary Information). Participants in the dancing group were matched by abstraction capacity, working memory, attention, verbal inhibitory control, and verbal working memory (Table S5 in Supplementary Information). Study 2 consisted of measurements before and after a short-term learning session of gaming29,58 (N = 27, Poland). For all participants considered in this work, sex was defined as the self-reported biological sex. See Table 1 for full demographics and sections Expertise criteria and Pre/post-learning design in Methods for details of expertise criteria and training design. All datasets used in this study were obtained from participants who provided informed consent following the Declaration of Helsinki. The study protocols, including image acquisitions and data collection procedures, were reviewed and approved by the Institutional Review Boards of each contributing institution.
Study 1. Expertise criteria
Tango dancers
A total of 46 right-handed Argentinean participants47 completed a self-assessment questionnaire consisting of 20 items designed to measure their level of expertise47. Expert and beginner tango dancers were recruited from three tango schools in Buenos Aires — DNI, Flor de Milonga, and Divino Estudio del Abasto Tango school. Exclusion criteria included no past neurological or psychiatric history reported. Inclusion criteria included being right-handed, verified by the Edinburgh Inventory, with normal or corrected-to-normal vision. The self-assessment questionnaire covered various areas, including tango practice, general dance experience, and formal tango instruction. Participants were classified according to their expertise level (Table S2 in Supplementary Information, item 17). We then built two coarser groups, where participants were assigned to the expert tango dancers’ group (N = 23), or the non-experts’ one (N = 23), using the median months of formal tango instruction as criteria, i.e., >12 months for expert tango dancers. Demographic data are presented in Table 1. The detailed questionnaire items can be found in Table S2 in Supplementary Information. This dataset consisted of 4.4 min resting-state EEG recordings. Ethics for this study was approved by the Comité de Ética of Universidad de San Andrés / CONICET, Buenos Aires, Argentina.
Musicians
This group included a total of 62 right-handed participants49. The expert musicians consisted of 31 participants with 5+ years of experience playing a musical instrument, including professional and amateur musicians (23 and 8 participants each, respectively). The group included various musical expertise across different instruments (e.g., string instruments, percussion) and singing. The non-expert group (non-musicians) consisted of healthy participants who did not play any musical instrument. The information was retrieved from the OMEGA questionnaire using self-declared musical expertise and years of experience. Musicians were selected based on self-reported experience of playing a musical instrument for five or more years. Four participants were excluded due to data quality concerns, leaving a final sample of 29 experts and 29 non-experts. Demographic data are presented in Table 1. This dataset consisted of 5-min resting-state MEG recordings from the OMEGA database49,57. MEG recordings and questionnaires are available through the OMEGA repository57. The years of education were calculated by translating the maximal educational instruction (e.g., a PhD degree) into cumulative years. Ethics for this study were approved by the Research Ethics Board of Montreal Neurological Institute & Hospital (McGill U.), Montréal, Canada.
Visual artists
A total of 34 right-handed participants were initially recruited for the study, with 17 visual artists and 17 non-artists. Recruitment occurred through social media, posters in locations related to the topic (e.g., universities, art schools, and art institutions), and word of mouth. After initial email contact, candidates were screened for inclusion and exclusion criteria and asked about their artistic background. Suitable participants were then invited to schedule an EEG session, during which a more detailed questionnaire on their art practice and interests was completed. Exclusion criteria included psychiatric, neurological, or cardiac conditions, and hairstyles or accessories (e.g., dreadlocks) that could impair EEG data acquisition. Following exclusions due to low data quality and non-compliance with inclusion criteria48, the final sample consisted of 30 participants: 15 artists (experts) and 15 non-artists (non-experts). As part of the selection criteria, the artists were required to have completed at least three years of university-level academic art education, with specific training in drawing. In contrast, participants in the non-artist group had no formal drawing training and did not engage in drawing regularly. Participants were informed about the data collected and signed informed consent before the session. Compensation was provided, although the specific form or amount is not mentioned in the article. Demographic data are presented in Table 1. This dataset consisted of 2 min resting-state EEG recordings48. Ethics for this study was approved by the Ethics Commission of Humboldt-Universität zu Berlin, Germany.
Gaming
In this study, 62 right-handed male subjects were included26. All participants completed an online questionnaire on demographics, education, and video game experience. The online questionnaire was administered via the GEX platform (GEX Immergo, Funds Auxilium Sp. z o.o), which gathered demographic information, education status, and detailed data on video game habits. As part of the questionnaire, participants provided their Battle.net ID, allowing verification of their StarCraft II league ranking and recent gameplay activity. All participants were right-handed males, had no history of neurological illness or psychoactive substance use, and were matched on undergraduate-level education. Working memory capacity was assessed using a modified online version of the operation span (OSPAN) task, with participants required to maintain at least 85% accuracy on the math component to be included. Two participants were excluded due to poor MRI data quality. All participants gave written informed consent and received monetary compensation for their participation. The expert group (N = 31) met the following criteria: (a) experienced in real-time strategy video games and StarCraft II, (b) played real-time strategy video games at least 6 hours/week for the past 6 months, (c) spent over 60% of gameplay time on StarCraft II, and (d) actively played in the last two seasons, ranked in one of the StarCraft leagues (Gold, Platinum, Diamond, Master, Grandmaster). The non-expert group (N = 31) had: (a) less than 6 hours of real-time strategy play and (b) less than 8 hours per week of total video game play (any genre) in the past 6 months. Only males were recruited due to the lack of female participants with sufficient video game experience. Demographic data are presented in Table 1. Further details about video experience, intellectual level, and other demographic variables can be found in Table S1 in Supplementary Information. As our brain clock models were trained from EEG FC, and this data were not available for participants, we estimated EEG FC from DTI structural connectivity using whole-brain modeling27,59. Previous simulated FC from empirical DTI26 successfully revealed connectivity differences between players and non-players27. We also reported the structural differences between groups in Supplementary Information Figure S6. Ethics for this study was approved by the Research Ethics Committee, SWPS University of Social Sciences & Humanities, Warsaw, Poland.
Study 2. Pre/post-learning design
A total of 24 right-handed participants were considered for the study in a short learning paradigm using video games29,58. Participants were initially recruited online via a covert questionnaire. All participants reported normal or corrected vision, normal hearing, and were right-handed. Exclusion criteria included any history of neurological or psychiatric disorders, head injuries, surgeries, brain tumors, current medication use, or more than five hours of video gaming per week in the prior six months, especially RTS or FPS games. Only participants who completed both sessions and met training requirements were included. Each eligible participant received compensation of approximately 184 USD. Participants engaged in StarCraft II gaming sessions in a controlled laboratory environment at the NeuroCognitive Research Center, SWPS University in Warsaw. Before the first session, each participant completed an introductory training session with a StarCraft II coach to familiarize them with the game’s core concepts and basic mechanics. The training lasted 30 hours in total, spread over 3 to 4 weeks, with participants playing between 5 and 10 hours per week. Telemetric variables were extracted from StarCraft II replays using the Python libraries sc2reader (available at https://github.com/ggtracker/sc2reader) and PACanalyzer (available at https://github.com/Reithan/PACAnalyzer), which enable the retrieval of information from various StarCraft II resources. We used the Actions Per Minute (APM) as a metric of performance, as it is one of the strongest predictors of StarCraft II performance and skill development40. APM reflects cognitive, motor, and decision-making speed, increasing as participants gain experience. EEG data were collected during two lab sessions lasting up to two hours each, which included instructions, electrode setup, and an attentional blink task. Only those who completed both sessions and met the training requirements were included in the final analysis. The attentional blink task involved rapid serial visual presentation (RSVP) of letters at the center of the screen. Participants were instructed to detect and report two target letters (T1 and T2) appearing in the stream, with T2 occurring shortly after T1, to measure the transient lapse in attention characteristic of the attentional blink effect. T1 corresponded to a green capital letter (vowel or consonant), and T2 to a black “X” presented at lag 1, 2, or 7 after T1. Participants answered two yes/no questions: whether a vowel (T1) and/or an “X” (T2) appeared. From the test, we reported the T1 and T2 reaction times and accuracy. EEG recordings were acquired before and after 30 hours of training. The total playing time was monitored, and participants were strictly prohibited from playing outside the lab. Demographic data are presented in Table 1. This dataset consisted of 23 min of EEG recordings during an attentional blink task60. This task was included to assess generalized attention and temporal processing improvements post-training. Although not directly associated with BAGs, improvements in attentional blink performance may reflect learning-induced changes60.
We included an active control group (N = 12) trained in Hearthstone. This group was part of the original study design58, with identical recruitment, training time, and inclusion/exclusion criteria as the StarCraft II group. The Hearthstone game was selected due to its more rule-based and turn-based mechanics, with limited improvisation and creative play compared to StarCraft II’s real-time decision-making58. Ethics for this study was approved by the Research Ethics Committee, SWPS University of Social Sciences & Humanities, Warsaw, Poland.
M/EEG acquisition, preprocessing, and connectivity
M/EEG data were processed offline using a custom-built automated pipeline (Fig. 1d). The pipeline integrates a mesh model tailored to various electrode arrays and performs source space estimation. Details on acquisition parameters (acquisition time, electrode numbers, sampling rate), are provided in Table S3 in Supplementary Information. The full set of pre/post-processing procedures is available in Supplementary Information sections 1.1-5, with a summary provided below.
The M/EEG signals were re-referenced to an average reference and were resampled to a uniform sampling rate of 512 Hz. EEG preprocessing included re-differentiation, removal of muscle and eye movement artifacts, identification and interpolation of bad channels, and normalization. Source reconstruction was conducted using standardized Low-Resolution Brain Electromagnetic Tomography (sLORETA). Brain regions were defined according to the Automated Anatomical Labeling (AAL) atlas38, including only the 78 cortical regions (regions listed in Supplementary Table S4). All MEG data were obtained from a public access data repository (OMEGA57). Preprocessing included low-pass filtering, artifact removal, and co-registration of MEG with anatomical images. MEG source estimation was performed using an atlas-based beamforming approach. A dipole-based forward model and beamformer approach were used to estimate time courses for 78 AAL38 regions with adjustments for signal polarity. We filtered the M/EEG signals between 8 and 40 Hz using a 3rd-order Bessel filter and then computed Pearson’s correlation between pairs of brain regions, resulting in 78×78 functional connectivity matrices. MEG FCs for musicians and non-musicians were adjusted to the average EEG FC connectivity of a subset of participants from the global north (age range 26−30 years).
The 8–40 Hz band was selected to cover alpha to low-gamma rhythms, which are linked to creative and attentional processes48 as well as brain age12,61. Although many features derived from M/EEG correlate with brain age (e.g., power spectral density, entropy, kurtosis)39, we focused on functional connectivity for specific reasons8. Functional connectivity is a robust marker for assessing brain aging, particularly when considering diverse datasets8,12,61. It also allows for comparability with fMRI-based brain clock estimations8. By using a mesh model and a common source space, we ensured standardized brain mapping across participants8. This approach offers a balanced trade-off between spatial and temporal resolution, which is important in multi-site data. In any case, future studies should explore additional M/EEG-derived metrics39 to further enrich brain age modeling.
Additionally, we assessed the Overall Data Quality (ODQ) of the EEG recordings using the method developed by Zhao et al.62, to discard possible effects of data quality on BAGs’ computation. Despite their differences, BAGs derived from different functional sources can be compared using harmonization steps. The use of a similar approach and a common brain parcellation38 allowed us to compare EEG and MEG in the same source space.
Brain clock models and brain age gaps
To improve the model’s robustness and generalizability63, we applied data augmentation over the EEG functional connectivity matrices of the training dataset (Fig. 1d). Using the augmented data, we trained SVMs to predict chronological age8,9 (Fig. 1d). A 5-fold cross-validation scheme with up to 15 repetitions was used, and the model performance was assessed by Pearson’s correlation coefficient and the Mean Absolute Error (MAE) between predicted and real chronological ages in the test sets. Feature importance was defined as the absolute value of SVR weight coefficients, averaged across cross-validation folds and repetitions. Detailed methods are provided in Supplementary Information sections 1.6-7. The BAGs were calculated by subtracting the actual chronological age from the SVM-predicted brain age. In the out-of-sample validation, these values were then corrected by regressing the chronological age. The regression slopes and intercepts were estimated from the training data8,9. The model performance was not assessed using age bias correction as this step can artificially increase the model performance. We finally normalized the BAGs, subtracting the average BAGs within each domain.
Expertise scores and BAGs standardization
To compare different expertise scores and their associations with BAGs, we converted BAGs and expertise scores into z-scores to group them on the same scale. This step allows the merging of all the expertise scores on a common scale, ensuring that measures, such as hours per week and years of experience, are expressed under the same scale for consistent comparisons.
Brain maps and Neurosynth associations
From the training data, we correlated nodal functional connectivity with chronological data, representing the brain areas more vulnerable to age, i.e., negatively correlated with age (Fig. 4). We subsequently captured the differences in nodal strength between (a) expert vs non-expert participants across all domains and (b) pre/post-learning connectivity. We reported these differences using Cohen’s D effect size. We then used Neurosynth21, an automated meta-analytical tool, to explore the cognitive processes linked to altered connectivity associated with creative experiences. We obtained association maps for 89 cognitive terms, which were then parcellated using the AAL atlas. We correlated the changes in nodal strength described above with the Neurosynth association maps, reporting the absolute strength of correlations.
To account for potential spatial autocorrelation in brain maps, we conducted Spin Test analyses64 using the BrainSMASH Python library (https://brainsmash.readthedocs.io/)65. We applied this method to all correlation analyses involving cortical surface data. The Spin Test generates spatially constrained null models by randomly rotating the spherical projection of cortical surface maps while preserving their spatial structure. We used 10,000 permutations to generate null distributions of correlation values. Empirical correlations were then compared to these null distributions to obtain p-values corrected for spatial autocorrelation. We additionally applied false discovery rate (FDR) correction across all comparisons.
Graph theoretical analyses
We quantified functional network properties associated with creative experiences using tools from graph theory41. Functional connectivity matrices were binarized after applying proportional thresholds ranging from 0.02 to 0.1, in steps of 0.01, keeping the highest functional connectivity values after thresholding. We reported the mean value across the whole range of thresholds to minimize the arbitrariness of choosing a single value41. From the binarized matrices, we computed the global and local efficiency.
Global efficiency, E, is a measure of network integration and can be related to generalized information processing, that is, coordinated activity throughout the brain. Global efficiency is based on paths and was defined as66
$${{{\rm{E}}}}=\frac{1}{{{{\rm{n}}}}}{\sum }_{{{{\rm{i}}}}}^{{{{\rm{n}}}}}{{{{\rm{E}}}}}_{{{{\rm{i}}}}}=\frac{1}{{{{\rm{n}}}}}{\sum }_{{{{\rm{i}}}}}^{{{{\rm{n}}}}}\frac{{\sum }_{{{{\rm{j}}}}\ne {{{\rm{i}}}}}^{{{{\rm{n}}}}}{{{{\rm{d}}}}}_{{{{\rm{ij}}}}}^{-1}}{{{{\rm{n}}}}-1}$$
(1)
where Ei is the nodal efficiency, n is the total number of nodes, and dij is the shortest path between nodes i and j. Global efficiency ranges between 0 and 1. Higher values indicate highly integrated networks, where nodes can easily transmit information, while values closer to 0 suggest poor integration and more difficult node-to-node communication.
Local efficiency, L, is a measure of network segregation, capturing the efficiency of information transfer within local neighborhoods of the network, which reflects specialized information processing within clusters of interconnected nodes. It is computed as follows66
$${{{\rm{L}}}}=\frac{1}{{{{\rm{n}}}}}{\sum }_{{{{\rm{i}}}}=1}^{{{{\rm{n}}}}}\frac{1}{{{{{\rm{k}}}}}_{{{{\rm{i}}}}}\left({{{{\rm{k}}}}}_{{{{\rm{i}}}}}-1\right)}{\sum }_{{{{\rm{j}}}},{{{\rm{h}}}}\in \Gamma \left({{{\rm{i}}}}\right)}\frac{{{{{\rm{a}}}}}_{{{{\rm{ij}}}}}{{{{\rm{a}}}}}_{{{{\rm{ih}}}}}}{{{{{\rm{d}}}}}_{{{{\rm{jh}}}}}}$$
(2)
where ki is the degree of node i, Γi is the set of neighbors of node i, and djh represents the shortest path length between nodes j and h within this neighborhood. Local efficiency ranges from 0 to 1. Higher values indicate efficient communication within local neighborhoods, while values closer to 0 suggest weaker local connections.
Graph theoretical analyses were conducted using the Brain Connectivity Toolbox for Python41.
Generative whole-brain model
We used a whole-brain model27,59 to explore associations between BAGs and biophysical coupling, specifically the global coupling parameter, G, of the model. Global coupling represents the overall conductivity of fibers, reflecting the strength of interregional communication.
Our model integrates structural and functional connectivity with regional dynamics, using a network of 78 brain areas defined by the AAL parcellation. The local brain activity was simulated using the normal form of a supercritical Hopf bifurcation (Stuart-Landau oscillators), which can shift the system’s behavior from self-sustained oscillations (limit cycle) to a stable fixed point.
The model’s key parameters include the global coupling and the local bifurcation parameter, ai, which determines whether a region i exhibits noise-induced oscillations (ai < 0), self-sustained oscillations (ai > 0), or critical behavior (ai ≈ 0). We set ai = 0.01 for all regions, following previous studies27. Regions were also subjected to uncorrelated Gaussian noise with a standard deviation of β = 0.1. The complete set of equations consisted of
$$\frac{{{{\rm{d}}}}{x}_{{{{\rm{i}}}}}\left(t\right)}{{{{\rm{d}}}}t}={{{{\rm{a}}}}}_{{{{\rm{i}}}}}{x}_{{{{\rm{i}}}}}\left(t\right)-\left[{x}_{{{{\rm{i}}}}}^{2}\left(t\right)-{y}_{{{{\rm{i}}}}}^{2}\left(t\right)\right]{x}_{{{{\rm{i}}}}}\left(t\right)-{{{{\rm{w}}}}}_{{{{\rm{i}}}}}{y}_{{{{\rm{i}}}}}\left(t\right) \\+{{{\rm{G}}}}{\sum }_{{{{\rm{j}}}}=1}^{{{{\rm{n}}}}}{{{{\rm{M}}}}}_{{{{\rm{ij}}}}}\left({x}_{{{{\rm{j}}}}}\left(t\right)-{x}_{{{{\rm{i}}}}}\left(t\right)\right)+{{{\rm{\beta }}}}{\eta }_{{{{\rm{i}}}}}\left(t\right)$$
(3)
$$\frac{{{{\rm{d}}}}{y}_{{{{\rm{i}}}}}\left(t\right)}{{{{\rm{d}}}}t}=\, {{{{\rm{a}}}}}_{{{{\rm{i}}}}}{y}_{{{{\rm{i}}}}}\left(t\right)-\left[{x}_{{{{\rm{i}}}}}^{2}\left(t\right)-{y}_{{{{\rm{i}}}}}^{2}\left(t\right)\right]{y}_{{{{\rm{i}}}}}\left(t\right)-{{{{\rm{w}}}}}_{{{{\rm{i}}}}}{x}_{{{{\rm{i}}}}}\left(t\right) \\+{{{\rm{G}}}}{\sum }_{{{{\rm{j}}}}=1}^{{{{\rm{n}}}}}{{{{\rm{M}}}}}_{{{{\rm{ij}}}}}\left({y}_{{{{\rm{j}}}}}\left(t\right)-{y}_{{{{\rm{i}}}}}\left(t\right)\right)+{{{\rm{\beta }}}}{\eta }_{{{{\rm{i}}}}}(t)$$
(4)
Here, x(t) represents the real component of the M/EEG-like signals, and y(t) represents the imaginary component. Regions with ai > 0 exhibit self-sustained oscillations at a frequency fi = wi/2π, set to 10 Hz across all nodes. The brain regions are coupled via an empirical structural connectivity, M, where each entry Mij indicates the strength of the connection between regions i and j. We used diffusion tensor imaging (DTI) structural connectivity data from the gaming expertise design26.
Using the linear approximation of the Hopf model59, static functional connectivity was predicted using analytical estimations without running extensive simulations. These estimations can be applied under weak noise conditions and small nonlinearities59.
Model fitting
We generated EEG functional connectivity from DTI structural connectivity and the Hopf model67. We swept parameter G between 0 and 3 in steps of 0.1. We compared the simulated and empirical functional connectivity matrices using the structural similarity index (SSIM = 1, perfect fit)18,68. In the gaming expertise design, the model was fitted to a subsample of age-matched participants from the training data (24.5 ± 1.0 years). The simulated functional connectivity matrices and G values were used for subsequent analyses. We validated our results by comparing the BAGs between expert and non-expert video game players across different values of G, finding consistent results across the entire parameter range (Fig. S3 and S6 in Supplementary Information). For the remaining groups, we used the average structural connectivity matrix across participants of the gaming expertise design (average across experts and non-experts). We then fitted individual G values using participants’ empirical functional connectivity matrices. The results of the model fitting are presented in Figs. S4, 5 in Supplementary Information.
Statistical analyses and visualization
Pairwise t-tests for independent samples (expertise) and paired t-tests (pre/post-learning) with a p-value of 0.05 were used to determine significance, plus the 95% confidence intervals and degrees of freedom. Cohen’s D was calculated to provide effect sizes, with values interpreted as small (0.2 < |D| < 0.5), moderate (0.5 <| D| <0.8), large (0.8 < |D| <1.2), and huge (|D| > 1.2). Cohen’s f² was also used to measure effect size in correlations, with values interpreted as small (0.02 < f² < 0.15), moderate (0.15 < f² < 0.35), large (0.35 < f² < 0.5), and huge (f² > 0.5). For categorical variables, like sex, we proceeded with Chi-squared tests. Pearson’s correlation was used to assess statistical relationships, and all p-values from multiple correlations were corrected for false discovery rate (FDR) using the Benjamini-Hochberg method. For generating the brain plots, we used the BrainNet Viewer Toolbox69. Word cloud plots were generated with the wordcloud 1.9.3 Python package (https://github.com/amueller/word_cloud). We used one-sided Mann-Whitney U tests in relatively small sample sizes, which limited the suitability of parametric alternatives.
Sensitivity analyses
Sensitivity analysis 1: To control for potential confounding variables, we conducted an ANCOVA with BAGs as the dependent variable and the expertise (group), age, sex, and education as covariates. This analysis was performed separately for each creative domain (tango dancers, musicians, visual artists, and gaming). In addition, normality tests and matching using parametric and non-parametric tests are reported in Table S7 in Supplementary Information.
Sensitivity analysis 2: We analyzed the effects of age bias correction, comparing the experts and non-experts with and without the correction.
Sensitivity analysis 3: We repeated the spatial correlation analyses between age vulnerability maps and connectivity-based effect sizes separately for each domain of expertise. For the tango dancers, musicians, and visual artists groups, we used the EEG-derived age vulnerability maps; for the gaming group, the age vulnerability map was constructed using MEG data from musicians and non-musicians.
Sensitivity analysis 4: We investigated whether the BAGs are associated with domain-specific expertise levels. Participants were classified as BAG-younger or BAG-older based on the overall BAG distribution, merging experts and non-experts. Specifically, individuals with BAG values below the 35th percentile were labeled as BAG-younger, while those above the 65th percentile were labeled as BAG-older. We then compared expertise scores between these two groups using one-sided Mann-Whitney U tests and FDR correction.
Sensitivity analysis 5: To assess the impact of channel density on model performance, we computed the slope of predicted versus chronological age using linear regression, separately for 64- and 128-channel EEG datasets, in both the training and creativity datasets.
Reporting summary
Further information on research design is available in the Nature Portfolio Reporting Summary linked to this article.
Data availability
The processed functional‑connectivity matrices, demographic metadata, and full analysis code for all cohorts except the music‑expertise cohort are openly available at both GitHub (https://github.com/carlosmig/Creativity_Brain_Clocks) and the mirrored Zenodo archive https://doi.org/10.5281/zenodo.15915311. These files are sufficient to reproduce every analysis and figure in the paper. The datasets used in this work came from different independent studies: EEG from ReDLat and EuroLad-EEG12, tango EEG47, visual‑artist EEG48, gaming‑expertise DTI26, with simulated FC, StarCraftII learners EEG29,58, and musicians MEG49,57. The music‑expertise cohort’s MEG‑derived functional‑connectivity matrices, demographic variables, and expertise scores are available under restricted access because EUGDPR and original participant consent preclude public release. Qualified academic researchers may obtain these files for non‑commercial research by emailing the corresponding author ([email protected]) and signing a GDPR‑compliant data‑sharing agreement; requests are acknowledged within ten business days and, once access is granted, no further time limit is placed on data use.
Code availability
Graph analyses were performed using the Brain Connectivity Toolbox for Python (https://github.com/fiuneuro/brainconn)41. Neurosynth association maps were generated with the NiMARE Toolbox in Python (https://nimare.readthedocs.io/en/latest/index.html). Full code to reproduce the main results can be found at https://github.com/carlosmig/Creativity_Brain_Clocks and the mirrored Zenodo archive https://doi.org/10.5281/zenodo.15915311. The linearized Hopf model can be found at https://github.com/adrianponce/Linear-Hopf-model59. From replays, StarCraft II telemetry data were obtained using sc2reader (https://github.com/ggtracker/sc2reader) and PACanalyzer (https://github.com/Reithan/PACAnalyzer). Brain plots were made using BrainNet Viewer for MATLAB (https://www.nitrc.org/projects/bnv)69 and the Python surfplot library (https://pypi.org/project/surfplot/). The spin test analyses64 were conducted using the BrainSMASH Python library (https://brainsmash.readthedocs.io/)65.
References
Chen, W. G. et al. Music and medicine: quickening the tempo of progress. Lancet 403, 1213–1215 (2024).
Morgan, J. Music lives on: fine tuning the memory. Lancet Neurol. 17, 211–212 (2018).
Ganter-Argast, C., Schipper, M., Shamsrizi, M., Stein, C. & Khalil, R. The light side of gaming: creativity and brain plasticity. Front. Hum. Neurosci. 17, 1280989 (2024).
Sihvonen, A. J. et al. Music-based interventions in neurological rehabilitation. Lancet Neurol. 16, 648–660 (2017).
Bavelier, D. & Green, C. S. Enhancing attentional control: lessons from action video games. Neuron 104, 147–163 (2019).
Clift, S. et al. WHO–Lancet Global Series on health and the arts. Lancet 403, 1335 (2024).
Ibanez, A., Kringelbach, M. L. & Deco, G. A synergetic turn in cognitive neuroscience of brain diseases. Trends Cogn. Sci. https://doi.org/10.1016/j.tics.2023.12.006 (2024).
Moguilner, S. et al. Brain clocks capture diversity and disparities in aging and dementia across geographically diverse populations. Nat. Med. https://doi.org/10.1038/s41591-024-03209-x (2024).
Tian, Y. E. et al. Heterogeneous aging across multiple organ systems and prediction of chronic disease and mortality. Nat. Med. 29, 1221–1231 (2023).
Boyle, P. A. et al. The “cognitive clock”: A novel indicator of brain health. Alzheimer’s. Dement. 17, 1923–1937 (2021).
Hernandez, H. et al. The exposome of healthy and accelerated aging across 40 countries. Nat. Med.https://doi.org/10.1038/s41591-025-03808-2 (2025).
Hernandez, H. et al. Brain health in diverse settings: How age, demographics and cognition shape brain function. NeuroImage 295, 120636 (2024).
Santamaria-Garcia, H. et al. Factors associated with healthy aging in Latin American populations. Nat. Med. 29, 2248–2258 (2023).
Matziorinis, A. M., Gaser, C. & Koelsch, S. Is musical engagement enough to keep the brain young?. Brain Struct. Funct. 228, 577–588 (2023).
Rogenmoser, L., Kernbach, J., Schlaug, G. & Gaser, C. Keeping brains young with making music. Brain Struct. Funct. 223, 297–305 (2018).
Yilmaz, D. et al. Brain age gap reduction following physical exercise mirrors negative symptom improvement in schizophrenia spectrum disorders. medRxiv, 2025.2001. 2008.24319554 (2025).
Skov, M. & Nadal, M. Can arts-based interventions improve health? A conceptual and methodological critique. Phys. Life Rev. 53, 239–259 (2025).
Sanz Perl, Y. et al. Model-based whole-brain perturbational landscape of neurodegenerative diseases. eLife 12 https://doi.org/10.7554/eLife.83970 (2023).
Coronel-Oliveros, C. et al. Viscous dynamics associated with hypoexcitation and structural disintegration in neurodegeneration via generative whole-brain modeling. Alzheimer’s Dementia https://doi.org/10.1002/alz.13788 (2024).
Coronel-Oliveros, C., Castro, S., Cofré, R. & Orio, P. Structural features of the human Connectome that facilitate the switching of brain dynamics via Noradrenergic neuromodulation. Front. Comput. Neurosci. 15 https://doi.org/10.3389/fncom.2021.687075 (2021).
Yarkoni, T., Poldrack, R. A., Nichols, T. E., Van Essen, D. C. & Wager, T. D. Large-scale automated synthesis of human functional neuroimaging data. Nat. Methods 8, 665–670 (2011).
Pandya, V. A. & Patani, R. Region-specific vulnerability in neurodegeneration: lessons from normal ageing. Ageing Res. Rev. 67, 101311 (2021).
Khalilian, M. et al. Age-related differences in structural and resting-state functional brain network organization across the adult lifespan: A cross-sectional study. Aging Brain 5, 100105 (2024).
Filippi, M. et al. Age-related vulnerability of the human brain connectome. Mol. Psychiatry 28, 5350–5358 (2023).
Kraeutner, S. N. et al. Frontoparietal function and underlying structure reflect capacity for motor skill acquisition during healthy aging. Neurobiol. Aging 133, 78–86 (2024).
Kowalczyk, N. et al. Real-time strategy video game experience and structural connectivity–A diffusion tensor imaging study. Hum. Brain Mapp. 39, 3742–3758 (2018).
Coronel-Oliveros, C. et al. Gaming expertise induces meso‑scale brain plasticity and efficiency mechanisms as revealed by whole-brain modeling. NeuroImage 293, 120633 (2024).
Amoruso, L., Pusil, S., García, A. M. & Ibañez, A. Decoding motor expertise from fine-tuned oscillatory network organization. Hum. Brain Mapp. 43, 2817–2832 (2022).
Lewandowska, P. et al. Association between real-time strategy video game learning outcomes and pre-training brain white matter structure: preliminary study. Sci. Rep. 12, 20741–20741 (2022).
Amoruso, L. et al. Variability in functional brain networks predicts expertise during action observation. NeuroImage 146, 690–700 (2017).
Sampaio-Baptista, C. & Johansen-Berg, H. White matter plasticity in the adult brain. Neuron 96, 1239–1251 (2017).
Coronel-Oliveros, C., Gießing, C., Medel, V., Cofré, R. & Orio, P. Whole-brain modeling explains the context-dependent effects of cholinergic neuromodulation. NeuroImage 265, 119782–119782 (2023).
Coronel-Oliveros, C., Cofré, R. & Orio, P. Cholinergic neuromodulation of inhibitory interneurons facilitates functional integration in whole-brain models. PLOS Comput. Biol. 17, e1008737 (2021).
Deery, H. A., Di Paolo, R., Moran, C., Egan, G. F. & Jamadar, S. D. The older adult brain is less modular, more integrated, and less efficient at rest: A systematic review of large-scale resting-state functional brain networks in aging. Psychophysiology 60, e14159 (2023).
Damoiseaux, J. S. Effects of aging on functional and structural brain connectivity. Neuroimage 160, 32–40 (2017).
Chan, M. Y., Park, D. C., Savalia, N. K., Petersen, S. E. & Wig, G. S. Decreased segregation of brain systems across the healthy adult lifespan. Proc. Natl. Acad. Sci. 111, E4997–E5006 (2014).
Dow, R., Warran, K., Letrondo, P. & Fancourt, D. The arts in public health policy: Progress and opportunities. Lancet Public Health 8, e155–e160 (2023).
Tzourio-Mazoyer, N. et al. Automated anatomical labeling of activations in SPM Using a Macroscopic Anatomical Parcellation of the MNI MRI Single-Subject Brain. NeuroImage 15, 273–289 (2002).
Engemann, D. A. et al. A reusable benchmark of brain-age prediction from M/EEG resting-state signals. Neuroimage 262, 119521 (2022).
Thompson, J. J., Blair, M. R., Chen, L. & Henrey, A. J. Video game telemetry as a critical tool in the study of complex skill learning. PloS One 8, e75129 (2013).
Rubinov, M. & Sporns, O. Complex network measures of brain connectivity: Uses and interpretations. NeuroImage 52, 1059–1069 (2010).
Franco-O’Byrne, D. et al. Cardiometabolic state links neurovascular burden with brain structure and function: evidence from EEG and MRI. NeuroImage, 121308 https://doi.org/10.1016/j.neuroimage.2025.121308 (2025).
Gonzalez-Gomez, R. et al. Educational disparities in brain health and dementia across Latin America and the United States. Alzheimer’s Dementia https://doi.org/10.1002/alz.14085 (2024).
Gonzalez-Gomez, R. et al. Qualitative and quantitative educational disparities and brain signatures in healthy aging and dementia across global settings. eClinicalMedicine https://doi.org/10.1016/j.eclinm.2025.103187 (2025).
Ibanez, A., Matallana, D. & Miller, B. Can prosocial values improve brain health?. Front Neurol. 14, 1202173 (2023).
Franco-O’Byrne, D. et al. The neurocognitive impact of loneliness and social networks on social adaptation. Sci. Rep. 13, 12048 (2023).
Amoruso, L. et al. Time to Tango: Expertise and contextual anticipation during action observation. NeuroImage 98, 366–385 (2014).
Seabra, J. P., Kaltwasser, L., Mylius, M. & Gallese, V. Artistic expertise shapes face perception: An alpha frequency and N170 study on portraiture. Neuroimage: Rep. 2, 100117 (2022).
Mandke, K., Tewarie, P., Adjamian, P., Schuermann, M. & Meier, J. Musicians’ brains at rest: Multilayer network analysis of MEG data. bioRxiv, (2024).
Moguilner, S. et al. Biophysical models applied to dementia patients reveal links between geographical origin, gender, disease duration, and loss of neural inhibition. Alzheimers Res. Ther. 16, 79 (2024).
Gross, J. et al. Good practice for conducting and reporting MEG research. Neuroimage 65, 349–363 (2013).
Van Diessen, E. et al. Opportunities and methodological challenges in EEG and MEG resting state functional brain network research. Clin. Neurophysiol. 126, 1468–1481 (2015).
Herzog, R. et al. Genuine high-order interactions in brain networks and neurodegeneration. Neurobiol. Dis. 175, 105918 (2022).
Allouch, S. et al. Effect of channel density, inverse solutions and connectivity measures on EEG resting-state networks reconstruction: A simulation study. NeuroImage 271, 120006 (2023).
Ibanez, A., Parra, M. A. & Butler, C. The Latin America and the Caribbean Consortium on Dementia (LAC-CD): From Networking to Research to Implementation Science. J. Alzheimer’s. Dis. 82, S379–S394 (2021).
Ibanez, A. et al. The Multi-Partner Consortium to Expand Dementia Research in Latin America (ReDLat): Driving Multicentric Research and Implementation Science. Front. Neurol. 12 https://doi.org/10.3389/fneur.2021.631722 (2021).
Niso, G. et al. OMEGA: the open MEG archive. Neuroimage 124, 1182–1187 (2016).
Jakubowska, N. et al. The role of individual differences in attentional blink phenomenon and real-time-strategy game proficiency. Heliyon 7 (2021).
Ponce-Alvarez, A. & Deco, G. The Hopf whole-brain model and its linear approximation. Sci. Rep. 14, 2615 (2024).
Raymond, J. E., Shapiro, K. L. & Arnell, K. M. Temporary suppression of visual processing in an RSVP task: An attentional blink?. J. Exp. Psychol.: Hum. Percept. Perform. 18, 849 (1992).
Baez, S. et al. Structural inequality and temporal brain dynamics across diverse samples. Clin. Transl. Med. 14, e70032 (2024).
Zhao, L. et al. Quantitative signal quality assessment for large-scale continuous scalp electroencephalography from a big data perspective. Physiol. Meas. 44, 035009 (2023).
Moguilner, S. et al. Visual deep learning of unprocessed neuroimaging characterises dementia subtypes and generalises across non-stereotypic samples. EBioMedicine 90, 104540 (2023).
Alexander-Bloch, A. F. et al. On testing for spatial correspondence between maps of human brain structure and function. Neuroimage 178, 540–551 (2018).
Burt, J. B., Helmer, M., Shinn, M., Anticevic, A. & Murray, J. D. Generative modeling of brain maps with spatial autocorrelation. NeuroImage 220, 117038 (2020).
Latora, V. & Marchiori, M. Efficient behavior of small-world networks. Phys. Rev. Lett. 87, 198701 (2001).
Arbabyazd, L. et al. Virtual connectomic datasets in Alzheimer’s Disease and aging using whole-brain network dynamics modelling. Eneuro 8 (2021).
Ipiña, I. P. et al. Modeling regional changes in dynamic stability during sleep and wakefulness. NeuroImage 215, 116833–116833 (2020).
Xia, M., Wang, J. & He, Y. BrainNet viewer: a network visualization tool for human brain Connectomics. PLoS ONE 8, e68910 (2013).
Acknowledgements
This work was supported by the Latin American Brain Health Institute (BrainLat) # BL-SRGP2020-02 awarded to MAP and AI. AI is supported by grants from ReDLat [National Institutes of Health and the Fogarty International Center (FIC), National Institutes of Aging (R01 AG057234, R01 AG075775, AG021051, R01 AG083799, CARDS-NIH 75N95022C00031), Alzheimer’s Association (SG-20-725707), Rainwater Charitable Foundation, The Bluefield project to cure FTD, and Global Brain Health Institute)], ANID/FONDECYT Regular (1250091, 1210195, 1210176 and 1220995); and ANID/FONDAP/15150012. The contents of this publication are solely the author’s responsibility and do not represent the official views of these institutions.
Ethics declarations
Competing interests
The authors declare no competing interests.
Peer review
Peer review information
Nature Communications thanks Victor Lopez-Madrona, Sina Mansour L, Adam Turnbull, and the other anonymous reviewer(s) for their contribution to the peer review of this work. A peer review file is available.
Additional information
Publisher’s note Springer Nature remains neutral with regard to jurisdictional claims in published maps and institutional affiliations.
Supplementary information
Rights and permissions
Open Access This article is licensed under a Creative Commons Attribution 4.0 International License, which permits use, sharing, adaptation, distribution and reproduction in any medium or format, as long as you give appropriate credit to the original author(s) and the source, provide a link to the Creative Commons licence, and indicate if changes were made. The images or other third party material in this article are included in the article’s Creative Commons licence, unless indicated otherwise in a credit line to the material. If material is not included in the article’s Creative Commons licence and your intended use is not permitted by statutory regulation or exceeds the permitted use, you will need to obtain permission directly from the copyright holder. To view a copy of this licence, visit http://creativecommons.org/licenses/by/4.0/.
About this article
Cite this article
Coronel-Oliveros, C., Migeot, J., Lehue, F. et al. Creative experiences and brain clocks. Nat Commun 16, 8336 (2025). https://doi.org/10.1038/s41467-025-64173-9
Received: 20 October 2024
Accepted: 03 September 2025
Published: 03 October 2025
DOI: https://doi.org/10.1038/s41467-025-64173-9