.png)

Main
The Comprehensive Assessment of Long-term Effects of Reducing Intake of Energy (CALERIE-II) clinical trial in healthy adults demonstrated that a simple 14% reduction of calories for 2 years without specific dietary prescription to alter macronutrient intake or meal timings can reprogramme the immunometabolic axis to promote healthspan1,2,3. Thus, harnessing the pathways engaged by caloric restriction (CR) in humans may expand the current armament of therapeutics against metabolic and immune dysfunction. Induction of negative energy balance and resultant activation of mitochondrial fatty acid oxidation by CR is thought to underlie some of its beneficial effects on healthspan1. However, it has also been suggested that CR-induced metabolic effects may be due to decreased protein intake in food-restricted animal models4,5. Adding back individual amino acids to calorie-restricted Drosophila abolished the longevity effects, and traced to the limitation of methionine, an important node for lifespan extension5. Indeed, methionine restriction (MR) in rodents increases lifespan6 with enhanced insulin sensitivity, adipose tissue thermogenesis and mitochondrial fatty acid oxidation7. Surprisingly, in long-lived Drosophila fed an MR diet, adding back methionine did not rescue the pro-longevity effect of diet, and it was hypothesized that activation of the methionine cycle may impact longevity5. Commercial MR diets contain 0.17% methionine compared with normal levels of 0.86%, but notably, the MR diets also lack cystine8,9, another sulfur-containing amino acid (SAA), which is required for protein synthesis, including synthesis of glutathione, taurine, CoA and iron–sulfur clusters10,11. Of note, in rats, MR-induced anti-adiposity and pro-metabolic effects, including reduction of leptin, insulin, IGF1 and elevation of adiponectin, were reversed when animals were supplemented with cysteine in the diet12. Furthermore, cysteine supplementation in MR rats did not restore low methionine, suggesting no increase in the methionine cycle12, where homocysteine is converted into methionine via the enzyme betaine-homocysteine S-methyltransferase (BHMT)10. The existence of the trans-sulfuration pathway (TSP) in mammals indicates that in case of dietary cysteine scarcity, the host shuttles homocysteine from the methionine cycle via the production of cystathionine, which is then hydrolysed into cysteine by the enzyme cystathionine γ-lyase (CTH)10,13. Cysteine is an ancient molecule that evolved to allow early life to transition from anoxic hydrothermal vents into oxidizing cooler environment14,15. Thus, cysteine, the only thiol-containing proteinogenic amino acid, is essential for disulfide bond formation and redox signalling, including nucleophilic catalysis10,13. It remains unclear whether cysteine specifically controls organismal metabolism and whether sustained CR in healthy humans can help understand the fundamental relationship between energy balance and SAA homeostasis pathways that converge to improve healthspan and lifespan.
CR in humans reduces adipose tissue cysteine
Adipose tissue regulates organismal metabolism by orchestrating inter-organ communication required for healthy longevity. To study the mechanisms that drive CR’s beneficial effects on human metabolism, we conducted an unbiased metabolomics analysis of the subcutaneous adipose tissue (SFAT) of participants in the CALERIE-II trial at baseline and 1 year after 15% achieved CR and weight loss1,2,3. The partial least squares discriminant analyses (PLSDA) of abdominal SFAT biopsies revealed that 1 year of mild sustained CR substantially altered the adipose tissue metabolome (Fig. 1a). The unbiased metabolite sets enrichment analyses demonstrated significant increases in cysteine, methionine and taurine metabolism, which indicates rewiring of cysteine metabolism (Fig. 1b,c). Further analyses of our previously reported RNA sequencing data of humans that underwent CR1,2. revealed that compared to baseline, 1 and 2 years of CR in humans increased the adipose expression of CTH (Fig. 1d) with a concomitant reduction in the expression of BHMT (Fig. 1e). These data suggest that rewiring of cysteine metabolism may involve reduction in methionine cycle and changes in trans-sulfuration pathway metabolites (Fig. 1c). Notably, previous studies have found that long-lived rodents upregulate metabolites in TSP that generates cysteine from methionine16,17. Consistent with our findings in humans that underwent CR, data from multiple lifespan-extending interventions in rodents identified upregulation of CTH as a common signature or potential biomarker of longevity18.
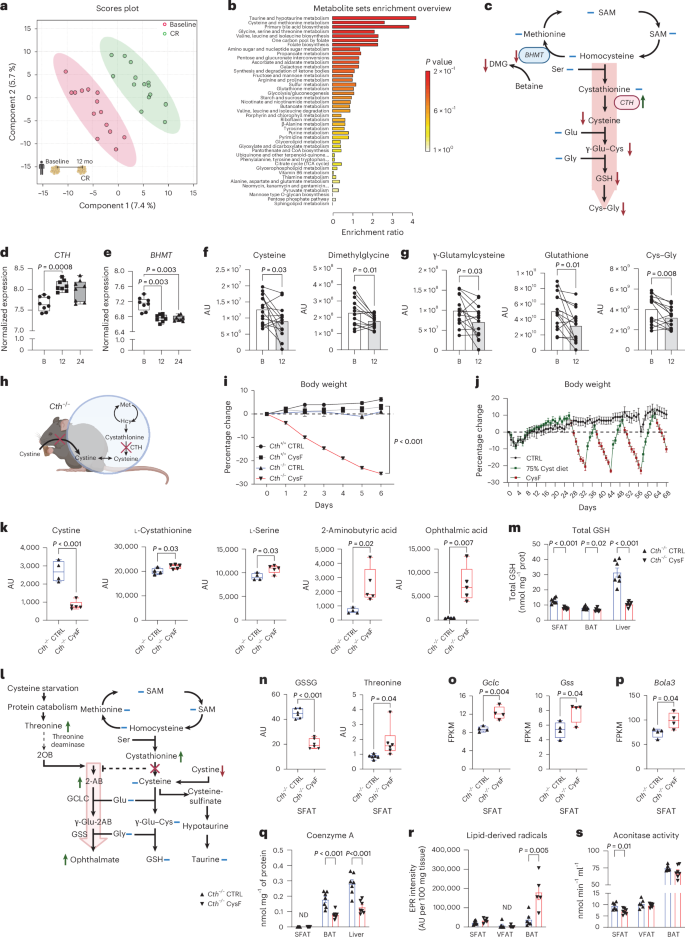
a, Principal-component analysis of the metabolome of subcutaneous adipose depots (SFAT) of healthy individuals at baseline and after 12 months of CR (n = 14). b, Metabolite set enrichment analysis shows that compared to baseline, 1 year of CR in humans activates TSP, with increased cysteine and taurine metabolism. c, Schematic summary of TSP and metabolites from baseline to 1 year CR, measured in human SFAT. Blue lines indicate unchanged metabolites, green and red arrows indicate significantly increased or decreased metabolites or genes respectively, via paired t-test (P < 0.05). SAM, S-adenosyl methionine. d,e, Normalized expression of changes in CTH and BHMT in human SFAT at baseline, and after 12 and 24 months of CR. Adjusted P values were calculated in the differential gene expression analysis in a separate cohort from metabolome analyses in the CALERIE-II trial1 (n = 8). B, baseline. f,g, Change in metabolites in human SFAT at baseline and 12 months of CR. Significance was calculated using paired t-tests (n = 14). AU, arbitrary unit. h, Mouse model used to achieve cysteine deficiency utilizing Cth−/− mice fed a CysF diet. i, Male Cth+/+ and Cth−/− mice were fed control (CTRL) or CysF diets for 6 days (n = 5 Cth+/+ CTRL, n = 12 Cth+/+ CysF, n = 8 Cth−/− CTRL, n = 17 Cth−/− CysF; three experiments pooled). Per cent body weight represented over 6 days of diet. j, Cth−/− mice were fed purified control diet (black line) or a diet containing 75% cysteine (green line) alternately switched to CysF diet (green line with red dots n = 6 per group). k, Box plots of metabolites involved in TSP in the serum of Cth−/− mice fed CTRL or CysF diet for 6 days (n = 4 Cth−/− CTRL, n = 5 Cth−/− CysF). l, Schematic summary of changes in the metabolites in the serum of Cth−/− mice fed CTRL or CysF diet for 6 days. Blue lines represent measured, but unchanged metabolites, red and green arrows indicate significantly decreased or increased metabolites, respectively (P < 0.05). See Supplementary Table 1 for the full list of metabolites. m, Total GSH content in subcutaneous (SFAT), brown (BAT) adipose depots and liver of Cth−/− mice fed with CTRL or CysF diet for 5 days (n = 7 per group), determined by colorimetric assay. n, Box plots of GSSG and threonine quantification in the SFAT of Cth−/− mice fed CTRL or CysF diet for 6 days (n = 6 per group). o,p, RNA-seq based expression of Gclc, Gss (o) and Bola3 (p) in the SFAT of Cth−/− mice fed with CTRL or CysF for 6 days. FPKM, fragments per kilobase of exon model per million mapped fragments. q, Coenzyme A (CoA) content in SFAT, BAT and liver samples of Cth−/− mice fed with CTRL or CysF diet for 5 days, determined by fluorometric assay (n = 7 per group, ND, not detectable). r, Analysis of EPR spectra of POBN-lipid radical adducts measured in Folch extracts of visceral adipose depot (VFAT), SFAT and BAT tissues from Cth−/− mice fed with CTRL or CysF diet for 5 days, normalized to 100 mg (ND, not detectable; n = 5–6 per group). s, Aconitase activity determined in SFAT, VFAT and BAT tissues from Cth−/− mice fed with CTRL or CysF diet for 5 days (n = 6 CTRL and 7 CysF). Data are represented as mean ± s.e.m. Box plots represent median value and extend to the 25th and 75th percentiles. Whiskers are plotted down to the minimum and up to the maximum value. Unless mentioned, differences were determined with unpaired two-tailed t-tests. Panels c, h and l created with BioRender.com.
Metabolomic analyses revealed that despite an increase in CTH expression post-CR, adipose cysteine levels were significantly reduced upon CR (Fig. 1f) with no change in homocysteine and cystathionine (Extended Data Fig. 1a). Consistent with the reduced expression of BHMT in methionine cycle, there was a decline in concentration of dimethylglycine (DMG) (Fig. 1f). CR caused a reduction in cysteine derived metabolites, γ-glutamyl–cysteine (γ-Glu–Cys), glutathione (GSH) and cysteinyl glycine (Cys–Gly) (Fig. 1g). Collectively, these results suggests that food restriction that resulted in 15% CR in humans reduces enzymes and metabolites that feed into methionine cycle and lowers cysteine (Fig. 1c).
Cysteine depletion causes lethal weight loss in mice
Cysteine is thought to be biochemically irreplaceable because methionine, the other sole proteinogenic SAA, lacks a thiol group and hence cannot form complexes with metals to control redox chemistry19. To determine whether cysteine is required for survival and organismal metabolism, we created a loss of function model where cysteine becomes an essential amino acid requiring acquisition from the diet by deletion of CTH (Cth−/− mice) (Fig. 1h and Extended Data Fig. 1b). Cysteine deficiency was thus induced by feeding adult Cth−/− mice a custom amino acid diet that only lacks cystine (cystine-free (CysF) diet), whereas control mice were fed an isocaloric diet that contained cystine (CTRL diet) (Fig. 1h). Utilizing this model, we found that mice with cysteine deficiency rapidly lost ~25–30% body weight within 1 week compared to littermate Cth+/+ mice fed a CysF diet or Cth−/− fed a control diet (Fig. 1i and Extended Data Fig. 1c). Upon clinical examination of the cysteine-deficient mice, 30% weight loss is considered a moribund state that required euthanasia. The weight loss in mice lacking CTH and cystine in the diet was associated with significant fat mass loss relative to lean mass (Extended Data Fig. 1d) in cysteine-deficient animals. Pair feeding of cystine depleted diet fed animals produced similar weight loss (Extended Data Fig. 1e). This rapid weight loss was not due to malaise or behavioural alteration, as Cth−/−CysF mice displayed normal activity and a slight reduction in food intake in the first 2 days after CysF diet switch that was not significantly different (Extended Data Fig. 1f and link of video file of cage activity). The Cth-deficient mice on the control diet were indistinguishable from control littermates in parameters indicative of health, they displayed higher nest building and no change in grip strength, gait, ledge test, hindlimb clasping and displayed no clinical kyphosis (Extended Data Fig. 1g,h). Furthermore, compared with Cth−/− mice on control diet, the analyses of liver, heart, lungs and kidneys of Cth−/−CysF mice did not reveal pathological lesions indicative of tissue dysfunction (Extended Data Fig. 1i). Notably, restoration of up to 75% cystine levels in the diet of Cth−/− CysF mice that were undergoing weight loss was sufficient to completely rescue the body weight over three weight-loss cysteine-depletion cycles, demonstrating the specificity and essentiality of cysteine for the organism (Fig. 1j).
To identify changes in metabolites upon cysteine-deprivation-induced fat mass loss, we conducted serum and subcutaneous adipose tissue (SFAT) metabolomics analyses (Extended Data Fig. 2a,b and Supplementary Tables 1 and 2). Compared with Cth-deficient mice fed a normal diet, the Cth−/−CysF mice had reduced cystine levels, suggesting that cysteine deficiency is maintained by a reduction in systemic cystine levels (Fig. 1k and Extended Data Fig. 2a). Cysteine depletion also elevated the cystathionine and l-serine levels, compared to control diet fed animals (Fig. 1k). Other SAA metabolites such as methionine, homocysteine (HCys) and glutamic acid were not significantly changed (Extended Data Fig. 2c). Taurine levels in the Cth-deficient mice on a cystine-free diet also did not change compared with control animals. Notably, the γ-glutamyl peptide analogues of cysteine and GSH such as 2-aminobutyric acid (2AB) and ophthalmic acid (OA or γ-glutamyl-2-aminobutyryl-glycine) were increased in the serum of cysteine-deficient mice (Fig. 1k,l and Extended Data Fig. 2a). Notably, in subcutaneous and brown adipose (BAT) depots and in liver, cysteine deficiency induces total glutathione (GSH) and oxidized GSH (GSSG) depletion (Fig. 1m,n and Extended Data Fig. 2b,d).The increase in γ-glutamyl peptides (2AB and OA) in cysteine-limiting conditions in vivo is consistent with studies that show that GCLC can synthesize γ-glutamyl-2-aminobutyryl-glycine in a GSH-independent manner and prevents ferroptosis by lowering glutamate generated oxidative stress20. OA is a GSH analogue in which the cysteine group is replaced by l-2-aminobutyrate (2AB). On a normal cysteine-replete diet, 2AB is produced from 2-oxobutyrate (2OB) and glutamate in the presence of aminotransferases21. Thus, the increase in 2AB despite the removal of cystine in diet could be due to an alternative pathway of deamination of threonine into 2AB22. Indeed, l-threonine levels are increased upon cysteine depletion in mice (Fig. 1n). Previous studies found that GSH can inhibit glutamate cysteine ligase (GCLC)23,24 regulating its production by a feedback mechanism. Thus, the removal of cysteine and reduction of GSH may release this disinhibition (Fig. 1m). Consistent with this hypothesis and elevated OA levels, Gclc and Gss expression were increased in cysteine-starved mice (Fig. 1o). The increased OA production versus GSH production reveals adaptive changes induced by systemic cysteine deficiency. Cysteine is required for protein synthesis. However, in mice where cysteine is depleted for 5 days, protein synthesis was not impaired in subcutaneous, visceral, brown adipose depots and in the liver (Extended Data Fig. 2e). Cysteine is also required for Fe–S clusters21,25. The RNA sequencing analysis revealed that the expression of genes involved in Fe–S cluster assembly, including Bola3, was unimpaired or increased during cysteine depletion25 (Fig. 1p and Extended Data Fig. 2f). Consistent with the association between increased Bola3 and adipose browning in a cysteine-deficient state, adipose-specific deletion of Bola3 decreases energy expenditure (EE) and increases adiposity in mice upon aging26. Upon short-term cysteine starvation, Fe–S clusters are preserved in adipose depots. Additionally, cysteine is crucial for coenzyme A (CoA) synthesis. We observed a significant reduction in CoA levels in BAT and liver upon cysteine starvation (Fig. 1q). The in vivo spin trapping and electron paramagnetic resonance (EPR) spectroscopy revealed that cysteine deficiency significantly increased lipid-derived radicals in BAT with undetectable signals in white adipose tissue (WAT) (Fig. 1r and Extended Data Fig. 2g). Also, given aconitase is regulated by reversible oxidation of (4Fe–4S)2+ and cysteine residues, depletion of cysteine also reduced aconitase activity in SFAT with no change in BAT (Fig. 1s). Together, these data demonstrate that removing cysteine causes lethal weight loss and induces adaptive changes in organismal metabolism, including upregulation of Gclc, elevated γ-glutamyl peptides with depletion of CoA and GSH (Fig. 1l,m,q and Extended Data Fig. 2d).
Cysteine deprivation drives adipose tissue browning
The decrease in fat mass during cysteine deficiency is driven by loss of all major fat depots including subcutaneous fat (SFAT), visceral epididymal/ovarian adipose fat (VFAT), and brown adipose tissue (BAT) (Extended Data Fig. 3a). Histological analyses revealed that this reduction in adipose tissue size is associated with transformation of white adipose depots into a BAT-like appearance, with the formation of multilocular adipocytes, enlarged nuclei, and high UCP1 expression, a phenomenon known as ‘browning’ that increases thermogenesis27,28 (Fig. 2a,b and Extended Data Fig. 3b). Of note, the SFAT browning in cysteine-deficient mice was reduced upon cystine-restoration in diet (Fig. 2b). Similar response was observed in visceral fat (VFAT) (Extended Data Fig. 3b). Consistent with the browning of SFAT, the cysteine-deficient animals showed significantly increased expression of uncoupling protein 1 (UCP1) (Fig. 2c) and thermogenic marker genes (Fig. 2d). The UCP1 and adipose triglyceride lipase (ATGL) induction upon cysteine deficiency in adipose tissue was reversed by cysteine repletion (Fig. 2c). Consistent with 30% weight loss at day 5, the glycerol concentrations were depleted in the sera of cysteine-deficient mice and were restored by cysteine-repletion-induced weight regain (Extended Data Fig. 3c). The differentiation of Cth-deficient preadipocytes to mature adipocytes and subsequent exposure to cysteine-free culture conditions did not affect their thermogenic genes or UCP1, suggesting that a non-cell autonomous mechanism may control adipocyte browning (Extended Data Fig. 3d).
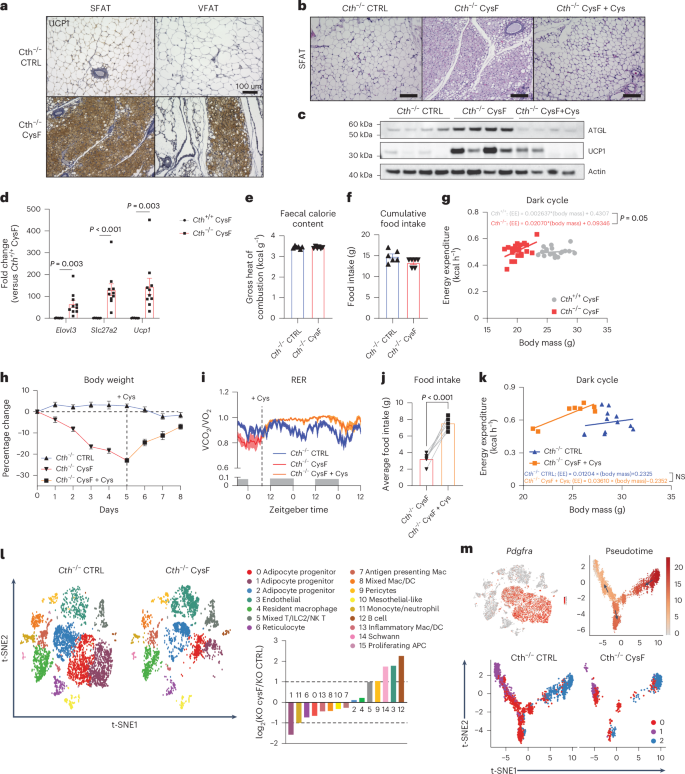
a, Representative images of subcutaneous (SFAT) and visceral (VFAT) fat sections stained for UCP1 from Cth−/− mice fed CTRL or CysF diet for 6 days (scale bar, 100 μm). b, Representative H&E-stained sections of SFAT of Cth−/− mice fed CTRL or CysF diet for 6 days or CysF diet followed by Cys-supplemented diet for 4 days (CysF + Cys) (scale bar, 100 μm). c, Western blot detection of ATGL and UCP1 in SFAT from Cth−/− mice after 6 days of CTRL or CysF diet or Cys supplementation after CysF-induced weight loss. Actin is used as a loading control. d, qPCR analysis of thermogenic genes in SFAT of Cth+/+ and Cth−/− mice fed CysF diet for 6 days (n = 8 Cth+/+ and n = 10 Cth−/−). e,f, Faecal calorie content (n = 6 per group) (e) and cumulative food intake of Cth−/− mice fed CTRL or CysF diet for 4 days (f) (n = 6 per group). g, Linear regression analysis of EE against body mass during dark cycle at 4 and 5 days of weight loss (n = 10 Cth+/+ CysF and n = 12 Cth−/− CysF). h, Per cent body weight change of Cth−/− mice fed with CTRL diet or CysF diet (red line) for 5 days and then switched to Cys-containing diet (orange line) for 3 days (n = 6 per group). i, RER measured in metabolic cages, of Cth−/− mice fed with CTRL diet (n = 6) or Cys-containing diet after CysF-induced weight loss (n = 4). j, Average food intake of Cth−/− mice fed with CysF diet and then switched to Cys-containing diet for 2 days (n = 7 per group). Significance was measured with paired t-test. k, Linear regression analysis of EE against body mass during dark cycle of Cth−/− mice fed with CTRL (n = 6) or Cys-supplemented diet after CysF-induced weight loss (n = 4), average values of the first two nights after diet switch. l, t-SNE plot of scRNA-seq showing cluster identities from SFAT SVF from Cth−/− mice fed CTRL or CysF diet at day 4 of weight loss and bar chart showing population fold change (FC) in relative abundance of each cluster comparing Cth−/− CysF versus Cth−/− CTRL. DC, dendritic cell; APC, antigen-presenting cell. m, t-SNE plot displaying Pdgfra expression in red across all populations and Monocle analysis of clusters 0, 1 and 2, with colouring by pseudotime to show right most cluster giving rise to two separate clusters. Each cluster represented by colour in Cth−/− CTRL and Cth−/− CysF. Data are expressed as mean ± s.e.m. Statistical differences were calculated by two-way ANOVA with Sidak’s correction for multiple comparisons or unpaired two-tailed t-tests. NS, not significant.
We next investigated whether changes in energy absorption, energy intake or EE contribute to cysteine-depletion-induced weight loss. Analysis of energy absorption by faecal bomb calorimetry revealed no significant difference in control and cysteine-deficient mice (Fig. 2e). Moreover, although the cumulative food intake over 5 days of weight loss was not statistically different (Fig. 2f), the cumulative food intake in the first 2 days (Extended Data Fig. 3e) after switching to CysF diet was lower (P < 0.05), which may contribute to early weight loss. Calculation of the analysis of covariance (ANCOVA) or representation of the data as regression between EE and body mass, demonstrated that EE was increased in cysteine-deprived animals during the dark cycle (Fig. 2g) and not in the light cycle (Extended Data Fig. 3f,g). In addition, there was no difference in locomotor activity between control or cysteine-deficient mice (Extended Data Fig. 3h), suggesting that cysteine depletion increases EE. Of note, the increase in EE was supported by increased fat utilization, as the respiratory exchange ratio (RER) in cysteine-deprived animals was significantly reduced (Extended Data Fig. 3i,j).
We next determined the specificity of cysteine on mechanisms that may contribute to rapid weight loss. Weight regain after cysteine repletion substantially reversed adipose browning (Fig. 2b,h and Extended Data Fig. 3b) and normalized the glycerol, ATGL and UCP1 levels in adipose tissue. (Fig. 2c and Extended Data Fig. 3c). Furthermore, replacement of single amino acid cysteine, also reversed the cysteine-starvation-driven reduction in RER, suggesting restoration of organismal metabolism to normal carbohydrate utilization instead of fatty acid oxidation (Fig. 2i). Of note, cysteine repletion significantly increased food intake for the first two days, suggesting that animals can sense cystine in diet and compensate via hyperphagia to restore bodyweight setpoint (Fig. 2j). The EE upon cysteine replacement was not significantly different during weight rebound (Fig. 2k). These data suggest that cysteine replacement can reverse weight loss by mechanisms that involve reduced adipose browning and decreased fat utilization while change in EE alone does not account for rapid weight restoration.
We conducted the RNA sequencing of the major adipose depots to investigate the mechanisms that control adipose tissue browning and associated remodelling. As displayed by the heatmap, cysteine deficiency profoundly altered the transcriptome of adipose tissue (Extended Data Fig. 3k). Gene set enrichment analysis comparing Cth−/− CTRL and Cth−/− CysF identified that the top downregulated pathways were involved in the extracellular matrix and collagen deposition, highlighting the broad remodelling of the adipose tissue (Extended Data Fig. 3l). In addition, multiple metabolic pathways seemed to be regulated by cysteine deficiency within the SFAT with ‘respiratory electron transport chain and heat production’ as the top pathway induced during cysteine deficiency (Extended Data Fig. 3l). Indeed, numerous genes identified by the ‘thermogenesis’ Gene Ontology term pathway such as Ucp1, Cidea, Cox7a1, Cox8b, Dio2, Eva1, Pgc1, Elovl3 and Slc27a2, were differentially expressed comparing Cth+/+ CysF and Cth−/− CysF in the SFAT (Extended Data Fig. 3m). These results demonstrate that cysteine depletion activates the thermogenic transcriptional programme.
To investigate the cellular basis of adipose tissue remodelling during cysteine deficiency, we isolated the stromal vascular fraction (SVF) by enzymatic digestion and conducted single-cell RNA sequencing (scRNA-seq) of SFAT. We isolated SVF cells from Cth+/+ and Cth−/− fed CTRL or CysF diet with each sample pooled from four animals (Extended Data Fig. 4a). A total of 4,666 cells in Cth+/+ CTRL; 5,658 cells in Cth+/+ CysF; 4,756 cells in Cth−/− CTRL; and 3,786 cells in Cth−/− CysF were analysed for scRNA-seq (Extended Data Fig. 4b). Consistent with previous results29,30, the unbiased clustering revealed 15 distinct cell populations including αβ T cells, γδ T cells, ILC2s and natural killer (NK) T cells, B cells, reticulocytes, mesothelial-like cells, Schwann cells and several myeloid clusters (Extended Data Fig. 4b–d). Comparison of Cth−/− CysF with other groups revealed dramatic changes in cellular composition (Fig. 2l). Particularly, loss of clusters 0, 1 and 2 were apparent upon cysteine deficiency (Fig. 2l). Of note, these clusters contained the highest numbers of differentially expressed genes induced by β3-adrenergic receptor agonist CL-316243 (ref. 31) (Extended Data Fig. 4e), highlighting the potential role of sympathetic nervous system (SNS)-derived noradrenaline (NA) in regulating the effects of cysteine deficiency. By expression of Pdgfra, we identified these clusters as enriched for adipocyte progenitors (Fig. 2m). We conducted a pseudotime analysis to place these clusters on a trajectory and illuminate their cell lineage. Trajectory analysis based on pseudotime suggested that cluster 2 may differentiate into two separate preadipocyte clusters, clusters 0 and 1 (Fig. 2m). Cth−/− CysF animals proportionally lost clusters 0 and 1, while relatively maintaining cluster 2 compared with the other groups (Fig. 2m), suggesting that more differentiated preadipocytes are mobilized during cysteine deficiency. Indeed, cluster 2 expressed Dpp4, an early progenitor marker that has been shown to give rise to different committed preadipoctyes32 (Extended Data Fig. 4f). Cluster 0 was enriched for both Icam1 and F3, which are expressed by committed adipogenic and antiadipogenic preadipocytes, respectively29,32 (Extended Data Fig. 4f). Cd9, a fibrogenic marker in preadipocytes31,33, along with the collagen gene, Col5a3, were broadly expressed across clusters 0 and 1, and was specifically lost by day 4 of inducing cysteine deficiency (Extended Data Fig. 4f,g). The loss of these preadipocyte clusters were orthogonally validated by FACS (Extended Data Fig. 4h). We next sought to identify beige/brown adipocyte precursors in our scRNA-seq dataset to understand whether there was an increased commitment towards brown adipocytes. Clearly, Tagln or Sm22, which has been previously described in beige adipocytes34,35, is specifically expressed by a subset of cells in cluster 1 (Extended Data Fig. 4f). Of note, these Tagln-expressing cells are lost with cysteine deficiency (Fig. 2l). Given the strong browning phenotype observed on day 6, it is possible that these cells become mobilized and differentiate early on during cysteine deficiency, leading to the absence of these cells as mature adipocytes are not captured within the SVF. Indeed, when we performed pathways analysis on cluster1, comparing gene expression of Cth−/− CysF with Cth−/− CTRL, we found that one of the top upregulated pathways was ‘adipogenesis’ (Extended Data Fig. 4i). Furthermore, examination of the expression of stem associated markers and mature adipocyte markers in the adipocyte progenitor clusters revealed a clear downregulation of stem markers and an increase in mature adipocyte markers, suggesting that cysteine deficiency was driving the maturation of progenitor cells (Fig. 2m and Extended Data Fig. 4j). However, given the robust transformation of the adipose tissue during cysteine deficiency towards browning, it is unlikely that mobilization of brown precursors alone is mediating this response. Previous studies have found that in certain models, beige adipocytes can originate from pre-existing white adipocytes, in addition to de novo adipogenesis36. The potential role of cysteine in the trans-differentiation of mature white adipocytes into brown-like adipocytes needs to be further examined using future lineage-tracking studies.
Cysteine depletion-induced FGF21 is partially required for weight loss
To determine the mechanism of adipose thermogenesis caused by cysteine starvation, we next investigated the processes upstream of increased fatty acid oxidation. We measured the lipolysis regulators, phosphorylation of hormone-sensitive lipase (pHSL) and ATGL and found that cysteine deficiency increased ATGL expression without consistently affecting pHSL levels (Fig. 3a and Extended Data Fig. 5a). ATGL preferentially catalysers the first step of triglyceride hydrolysis, whereas the hormone-sensitive lipase (HSL) has a much broader range of substrates with a preference for diacylglycerols and cholesteryl esters37. Given a dramatic browning response in WAT post-cysteine deficiency, the increased ATGL is consistent with previous work that shows BAT relies heavily on the action of ATGL to mobilize lipid substrates for thermogenesis38. This is further supported by a decrease in most lipid species, particularly triglycerides and diacylglycerol in the BAT of cysteine-deficient mice (Fig. 3b and Extended Data Fig. 5b,c). Considering dramatic adipose tissue browning and elevated UCP1 expression upon cysteine starvation, we next sought to investigate whether this is a homeostatic response to defend core body temperature (CBT) or whether temperature setpoint is perturbed to causes hyperthermia. We measured CBT utilizing loggers surgically implanted into the peritoneal cavity in Cth−/− mice on CTRL or CysF diet over 6 days when animals lose weight. Of note, despite conversion of WAT into brown-like thermogenic fat, the CBT was not different between control and cysteine-deficient mice (Extended Data Fig. 5d,e). These data suggest that either cysteine- may signal the host to defend CBT within tight normal physiological range or any metabolic heat that is generated is dissipated due to the animal housing in the sub-thermoneutral temperature. To confirm adipose thermogenesis in vivo, we utilized a highly sensitive and specific magnetic resonance spectroscopic imaging method called biosensor imaging of redundant deviation in shifts (BIRDS)39 to determine the temperature of BAT in Cth+/+ and Cth−/− animals after 6 days of CysF diet. This method relies on measuring the chemical shift of the four nonexchangeable methyl groups from an exogenous contrast agent, TmDOTMA, which has a high-temperature sensitivity (0.7 ppm per °C). The TmDOTMA− methyl resonance has ultrafast relaxation times (<5 ms), allowing high signal-to-noise ratio by rapid repetition for superior signal averaging39. The temperature was calculated from the chemical shift of the TmDOTMA− methyl resonance according to (equation (1) and Methods). Compared to cysteine-replete animals, the in vivo local temperature in BAT of cysteine-deficient mice was significantly greater than surrounding tissue (Fig. 3c,d), suggesting increased thermogenesis.
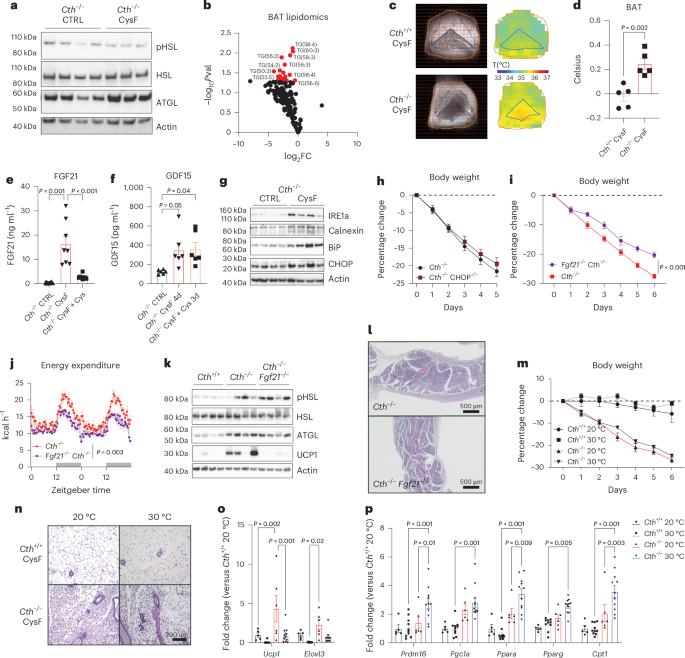
a, Western blot detection of lipolysis regulators pHSL, HSL and ATGL in SFAT from Cth−/− mice after 6 days of CTRL or CysF diet, actin is used as loading control. b, Volcano plot of lipid species of BAT showing FC of triglycerides in Cth−/− mice fed CTRL or CysF diet. c,d, in vivo measurement of BAT temperature by BIRDS imaging (c) and quantification of local temperature differences in BAT (d) compared to surrounding tissue in Cth+/+ and Cth−/− mice on CysF diet for 6 days (n = 5 per group). e, Serum FGF21 quantification in Cth−/− CTRL (n = 23), Cth−/− CysF for 6 days (n = 8) and Cth−/− CysF followed with 4 days of Cys supplementation (n = 10). f, Serum GDF15 concentrations in Cth−/− CTRL, Cth−/− CysF for 4 days and Cth−/− CysF followed with 3 days of Cys supplementation (n = 6 per group). g, Immunoblot analysis of CHOP, calnexin, IRE1a, BiP in the liver of Cth−/− mice fed with CTRL or CysF diet at day 6. Actin was used as loading control. h, Percentage body weight change of Cth−/− and Cth−/−CHOP−/− mice fed with CysF diet for 5 days (n = 17 Cth−/− and n = 15 Cth−/−CHOP−/−). i, Percentage body weight change of Cth−/− and Fgf21−/−Cth−/− mice fed with CysF diet for 5 days (n = 13 Cth−/− and n = 18 Fgf21−/−Cth−/−). j, Energy expenditure measured in metabolic cages of Cth−/− and Cth−/− Fgf21−/− mice on days 3–4 of CysF diet (n = 5 per group). k, Immunoblot analysis of pHSL, HSL, ATGL and UCP1 in SFAT of Cth+/+, Cth−/− and Cth−/−Fgf21−/− mice fed CysF diet for 6 days. l, Representative H&E-stained SFAT sections of Cth−/− and Fgf21−/−Cth−/− mice after 6 days of CysF diet (scale bar, 500 μm). m–p, Cth+/+ and Cth−/− mice were fed with CysF diet and housed at 20 °C or 30 °C for 6 days. Percentage body weight change (n = 3 Cth+/+ 20 °C, n = 4 Cth+/+ 30 °C, n = 4 Cth−/− 20 °C, n = 5 Cth−/− 30 °C) (m), representative images of H&E staining of SFAT sections (scale bar, 200 μm) (n) and qPCR analysis of thermogenic markers (n = 5 Cth+/+ 20 °C, n = 10 Cth+/+ 30 °C, n = 6 Cth−/− 20 °C, n = 11 Cth−/− 30 °C) (o,p). Data are expressed as mean ± s.e.m. Statistical differences were calculated by one-way ANOVA with Tukey’s correction for multiple comparisons or two-way ANOVA with Sidak’s correction for multiple comparisons or unpaired two-tailed t-tests.
Changes in nutritional stress induced by CR, MR or low-protein diets upregulate the expression of FGF21, which, when overexpressed, increases lifespan and also upregulates EE40,41. The induction of cysteine deficiency in Cth-deficient mice caused a dramatic increase in the FGF21 concentration in blood (Fig. 3e) and Fgf21 expression in the liver (Extended Data Fig. 5f), which was reversed by cysteine-repletion-induced weight restoration (Fig. 3e). Similar to FGF21, the hormone GDF15, can also be induced by cellular or nutritional stress-mediated signalling42. Cysteine depletion at day 4 after weight loss significantly increased GDF15, which was not restored after cysteine-repletion-induced weight regain (Fig. 3f). Given the cysteine-repleted diet switch increases food intake, the higher GDF15 levels during weight rebound are likely insufficient to cause food aversion. Notably, recent studies suggest elevated endoplasmic-reticulum (ER) stress in Bhmt−/− mice with reduced methionine cycle, is associated with increased FGF21 and adipose browning43. Cysteine deficiency led to induction of ER-stress proteins CHOP, calnexin, IRE1α and BIP (Fig. 3g). However, deletion of CHOP in cysteine-starved Cth−/− mice did not rescue weight loss (Fig. 3h) nor did it alter the FGF21 and GDF15 serum levels (Extended Data Fig. 5g,h) demonstrating that induction of the CHOP-dependent ER-stress response does not drive cysteine’s metabolic and neuroendocrine effect.
Given that cysteine specifically regulated FGF21 during weight loss and regain (Fig. 3e), we generated Fgf21−/−Cth−/− double knockout (DKO) mice to test whether FGF21 controls adipose browning and weight loss in cysteine-starved mice. In the absence of FGF21, cysteine deficiency-induced weight loss and reduction in adiposity in Cth−/− mice were blunted, but the weight-loss trajectory continued and was not rescued (Fig. 3i and Extended Data Fig. 5i). The Fgf21−/−Cth−/− DKO mice had lower EE compared to Cth−/− mice on the CysF diet (Fig. 3j). However, the RER was not different, indicating that Fgf21−/−Cth−/− mice still substantially utilized fat as an energy source (Extended Data Fig. 5j). This was supported by maintenance of lipolysis signalling observed by levels of pHSL and ATGL in Cth−/− mice, but reduced UCP1 protein and mRNA expression in WAT of Fgf21−/−Cth−/− (Fig. 3k and Extended Data Fig. 5k). Of note, the WAT of Fgf21−/−Cth−/− DKO mice maintained classical multilocular browning characteristics (Fig. 3l) suggesting that FGF21 is not required for adipose browning. These results suggest that FGF21 is partially required for weight loss but does not mediate lipid mobilization or adipose browning caused by cysteine deficiency.
Cysteine-starvation-induced weight loss is maintained at thermoneutrality
Cysteine deprivation revealed a metabolic crisis that may signal the host to activate thermogenic mechanisms. However, across animal vivarium, including ours, mice are housed at sub-thermoneutral 20 °C temperatures and are constantly under thermogenic stress due to slight cold challenge28. To further confirm that mice were indeed inducing thermogenesis to defend CBT, we housed cysteine-deficient animals at 30 °C thermoneutrality. The cysteine deficiency in Cth−/− mice housed at 30 °C also led to similar weight loss as 20 °C with significant browning of adipose tissue (Fig. 3m,n and Extended Data Fig. 5l). The degree of browning and gene expression of Ucp1 and Elovl3 in CysF Cth-deficient mice at thermoneutrality were relatively lower than inductions observed at 20 °C (Fig. 3o). Furthermore, expression of genes involved with lipid regulation and browning such as Prdm16, Ppargc1a, Ppara, Pparg and Cpt1 (Fig. 3p) were significantly increased in SFAT, suggesting that even at thermoneutral temperatures, Cth−/− CysF-fed mice activate fat metabolism and have increased thermogenesis caused by cysteine deficiency. In addition, compared to controls, the cysteine-deficient mice at thermoneutrality retained higher Ucp1 expression in BAT (Extended Data Fig. 5m). Together, cysteine-depletion-induced weight loss and adipose browning are maintained at thermoneutrality.
Systemic depletion of cysteine drives browning in a UCP1-independent manner
The liver is believed to be the primary organ responsible for maintaining systemic cysteine homeostasis10,13. Immunoblot analyses confirmed the highest CTH expression in the liver, followed by the kidney, thymus and adipose tissue (Extended Data Fig. 6a). Given that CR in humans lowers cysteine levels in adipose tissue; we generated adipocyte- and hepatocyte-specific Cth-deficient mice to explore the cell-type-specific mechanism of cysteine in weight loss (Fig. 4a–h). As expected, liver-specific deletion of Cth did not alter CTH expression in the kidney and adipose-specific ablation of Cth maintained the expression in the liver (Extended Data Fig. 6b). Neither liver- nor adipose-specific deletion of Cth led to a reduction in serum cysteine levels (Fig. 4c,d,g,h and Extended Data Fig. 6c,d) or caused fat mass loss when cysteine was restricted in the diet (Fig. 4e,f).
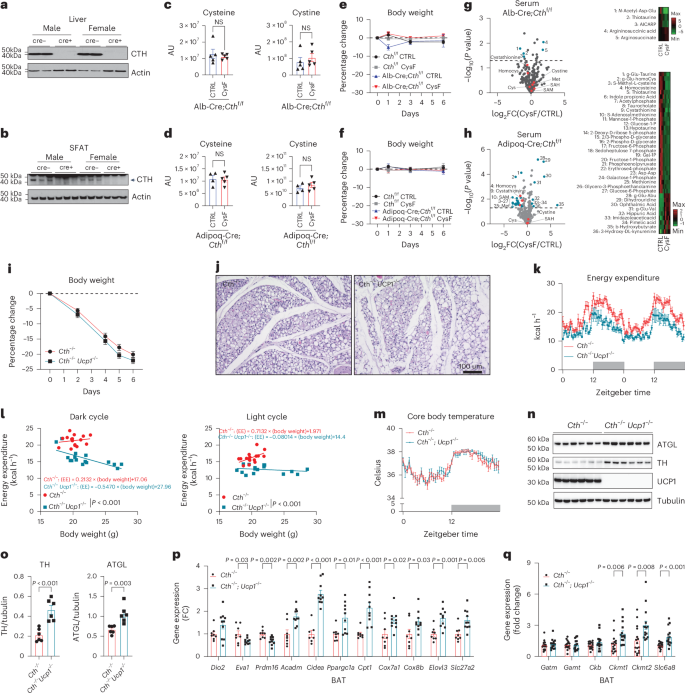
a, Immunoblot analyses of CTH in the liver of male and female Cthf/f Alb:Cre− or Alb:Cre+ mice. b, Western blot detection of CTH in the SFAT of male and female Cthf/f Adipoq:Cre− or Adipoq:Cre+ mice. c,d, Serum cysteine and cystine determined by LC–MS/MS in Alb:CreCthf/f mice (n = 5 per group) (c) and Adipoq:Cre;Cthf/f mice (n = 4 CTRL and n = 5 CysF) (d) after 6 days of CTRL or CysF diet. AU, arbitrary units. e,f, Percentage body weight changes of Alb-Cre;Cthf/f mice (n = 5 Cthf/f CTRL, n = 6 Cthf/f CysF and n = 3 Alb-Cre;Cthf/f CTRL and CysF) (e) and Adipoq-Cre;Cthf/f mice (n = 5 per group) after 6 days of CTRL or CysF diet (f). g,h, Volcano plot of serum metabolites identified by LC–MS/MS in Alb-Cre;Cthf/f mice (n = 5 per group) (g) and Adipoq-Cre;Cthf/f mice (n = 4 CTRL and n = 5 CysF) (h) after 6 days of CTRL or CysF diet. Trans-sulfuration pathway related metabolites are highlighted in red. Significantly increased or decreased metabolites (−log10(P) >1.3 and ∣log2(FC)∣>1) are highlighted in blue and listed on the right. Cys, cysteine; Homocys, homocysteine; Met, methionine; SAH, S-adenosyl homocysteine. Supplementary Tables 3 and 6 provide the full list of metabolites. i–l, Cth−/− and Cth−/− Ucp1−/− mice were fed a CysF diet for 6 days (n = 8 per group). Per cent body weight change over 6 days of diet (i). Representative H&E histology images of SFAT after 6 days of diet (j). Energy expenditure measured in metabolic cages on days 4 and 5 of CysF diet (k). Linear regression analysis of EE against body mass during dark and light cycles at 4 and 5 days of weight loss (when adjusted to body mass covariate, EE of Cth−/− Ucp1−/− is significantly decreased, during both night and day) (l). m, CBTs measured in the peritoneal cavity by implantation of Star-Oddi loggers over 6 days of diet in male Cth−/− and Cth−/−Ucp1−/− mice fed CysF diet. Recordings were taken every 30 min and representative day 4 is plotted (n = 7 Cth−/−, n = 5 Cth−/−Ucp1−/−). n,o, Immunoblot staining of ATGL, TH and UCP1 in BAT of Cth−/− and Cth−/−Ucp1−/− fed a CysF diet for 6 days (n) and quantification using tubulin as loading control (o). p, Thermogenic markers gene expression analysis in BAT of Cth−/− and Cth−/−Ucp1−/− mice fed a CysF diet for 6 days, measured by qPCR (n = 8 Cth−/−, n = 10 Cth−/−Ucp1−/−). q, Gene expression of genes involved in futile creatine cycle in BAT of Cth−/− and Cth−/−Ucp1−/− mice fed a CysF diet for 6 days (n = 16 Cth−/−, n = 15 Cth−/−Ucp1−/−), quantified by qPCR. Data are expressed as mean ± s.e.m. Statistical differences were calculated by two-way ANOVA with Sidak’s correction for multiple comparisons or by unpaired two-tailed t-tests.
Further liquid chromatography–mass spectrometry (LC–MS) analyses of sera from hepatocyte-specific Cth-deficient mice maintained on CysF diet showed no changes in cystathionine, γ-glutamyl-dipeptides, cysteine or cystine (Fig. 4g, Extended Data Fig. 6e and Supplementary Table 3). Consistent with low CTH activity, livers of the CysF-fed mice (Alb-Cre:Cthf/f, CysF) had lower levels of cysteine, cystathionine, S-adenosyl homocysteine, 2AB and ophthalmate (Extended Data Fig. 6f,g and Supplementary Table 4). Of note, the levels of cystathionine and cysteine/cystine in subcutaneous adipose tissue of liver-specific Cth-deficient mice were unchanged (Extended Data Fig. 6h,i and Supplementary Table 5). Consistent with these data, no change in serum cysteine/cystine were detected in adipose tissue specific Cth−/− mice that had no weight loss on a cysteine-free diet (Fig. 4h, Extended Data Fig. 6j and Supplementary Table 6). The TSP metabolites can potentially be generated by the gut microbiota19. The Cth−/− animals co-housed together with Cth+/+ mice still maintained weight loss when fed a CysF diet, suggesting that microbiota derived metabolites do not account for the weight loss (Extended Data Fig. 6k). These results demonstrates that Cth across multiple tissues may defend systemic cysteine pool to prevent uncontrolled thermogenesis and death when cysteine content is low in diet.
Given that UCP1 is a canonical regulator of non-shivering adipose thermogenesis44,45 and as cysteine elimination induced UCP1 expression in WAT, we next deleted UCP1 in cysteine-deficient mice to determine its role in adipose browning. Notably, we found that Cth−/−Ucp1−/− double knockout (DKO) mice had equivalent food intake (Extended Data Fig. 6l), lost weight at a similar rate to its Cth−/− littermates on a CysF diet and displayed similar browning-like features with multilocular adipocytes (Fig. 4i,j). The ablation of UCP1 in cysteine-deficient mice lowered EE during dark and light cycles (Fig. 4k,l) but did not affect the CBT (Fig. 4m). Despite similar body weight loss and browning phenotype, Cth−/− and Cth−/−Ucp1−/− DKO mice show significant differences in the interaction between EE and body weight (Fig. 4l). Therefore, UCP1 depletion and other parameters such as body composition may account for this significant difference in the correlative trend between EE and body weight. The lack of UCP1 in Cth-deficient mice undergoing cysteine starvation displayed elevated ATGL and tyrosine hydroxylase (TH) expression, suggesting increased lipolytic signalling (Fig. 4n,o). Despite lack of UCP1, gene expression indicative of the thermogenic programme, such as Ppargc1, Cidea and Cpt1 are significantly increased in Cth−/−Ucp1−/− DKO mice compared to Cth−/− in the BAT after 6 days of CysF diet (Fig. 4p). Furthermore, gene expression of other mediators of the thermogenic genes such as Acadm, Cox7a1, Elovl3 and Slc27a2 are also significantly increased in Cth−/−Ucp1−/− DKO mice compared to Cth−/− animals fed cysteine-restricted diet (Fig. 4p). UCP1-independent thermogenesis has been reported previously46. The futile creatine cycle is proposed to regulate UCP1-independent thermogenesis47. Compared to control animals, the creatine cycle genes Ckb and Alpl were not significantly different in SFAT of cysteine-deficient animals (Extended Data Fig. 6m). The creatine synthesis genes, Gatm and Gamt were significantly reduced with cysteine deficiency in SFAT (Extended Data Fig. 6m). The expression of one of the creatine kinases that utilizes ATP, Ckmt2 and the transporter for creatine, Slc6a8 were also not differentially regulated in SFAT (Extended Data Fig. 6m). Notably, Slc6a8, Ckmt1 and Ckmt2 expression was increased in BAT of Cth−/−Ucp1−/− animals compared to cysteine-deficient animals (Fig. 4q), suggesting a potential role of these effectors in BAT thermogenesis in the cysteine-starvation model.
The alternative UCP1-independent thermogenic regulatory genes Atp2a2 and Ryr2 that control calcium cycling48 were not impacted by cysteine deficiency (Extended Data Fig. 6n). Similarly, Sarcolipin and Atp2a2, which can increase muscle driven thermogenesis49 were also not affected in skeletal muscle of Cth-deficient mice lacking cysteine (Extended Data Fig. 6o). The futile lipid cycle is also implicated in UCP1 independent thermogenesis50. Of note, Cth−/− mice on a CysF diet have significantly elevated expression of Dgat1, Pnpla2 and Gk with no change in Lipe in SFAT (Extended Data Fig. 6p). The expression of these genes was also induced in absence of UCP1 in BAT and SFAT (Extended Data Fig. 6q,r). However, absence of association between changes in gene expression of major UCP1 independent regulators does not rule out causal role of some of these mechanisms in cysteine-deprivation-driven adipose browning. These results suggest that systemic cysteine deficiency-induced thermogenesis depends mainly on an as-of-yet unknown non-canonical UCP1-independent thermogenic mechanism.
Cysteine-depletion-induced adipose browning and weight loss requires catecholamine signalling
As cysteine-elimination-induced adipocyte browning is non-cell autonomous (Extended Data Fig. 3d), we evaluated upstream mechanisms that control cysteine-starvation-induced thermogenesis. We conducted an unbiased whole-brain activity mapping screen to determine the circuitry responsible for regulating the thermogenic induction. Using whole-brain immunolabelling and clearing tandem iDISCO+51, we mapped the differential expression of the immediate–early gene c-Fos (Fig. 5a). Subsequently, we quantified c-Fos positive cells across brain regions and registered them to the Allen Brain Atlas with CLEARMAP52. Notably, key components of the canonical thermogenesis circuitry (Fig. 5a–d) were significantly activated upon 5 days of exposure to a cysteine-free diet.
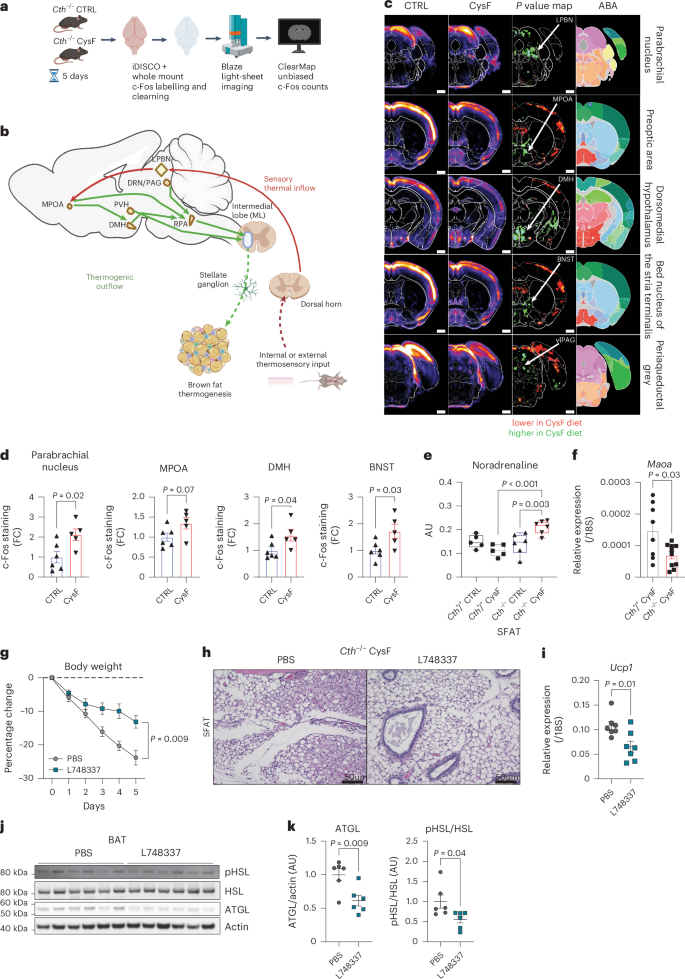
a, Tissue clearing and whole-brain c-Fos immunolabelling approach using iDISCO+ and CLEARMAP in Cth−/−mice fed CTRL or CysF for 5 days. b, Scheme of the thermosensory information inflow into the brain and the thermogenic outflow to periphery, highlighting the key canonical sites responsible for a thermogenic response. LPBN, lateral parabrachial nucleus; MPOA, medial preoptic area; DMH, dorsomedial hypothalamus; PVH, paraventricular hypothalamus; RPA, raphe palladus; DRN/vlPAG, dorsal raphe nucleus/ventrolateral portion of the periaqueductal grey. c, Automated analysis of c-Fos+ cell distribution in Cth−/− brains collected after 5 days CTRL (n = 6) or CysF feeding (n = 5). Panels show the reference annotation (Allen Brain Atlas; ABA) with details from the averaged density maps (5–6 brains averaged) between the two conditions, P value maps (25-μm orthogonal projection) for the canonical thermogenic regions in the brain as coronal projections. First lane shows the LPBN, the entry point of thermosensory information into the brain. Second lane shows the MPOA, the sensory integrator of thermogenic input information. Third, fourth and fifth lanes show DMH, BNST and the vlPAG, respectively; three critical sites for transmitting information received by the MPOA to the SNS-mediated thermogenic outflow. d, Quantification of c-Fos staining in the parabrachial nucleus, MPOA, DMH and BNST of Cth−/− mice after 5 days of CTRL (n = 6) or CysF feeding (n = 5). e) Measurement of noradrenaline by orbitrap MS/MS in the SFAT of Cth+/+ and Cth−/− fed 6 days of CTRL or CysF diet (n = 5 Cth+/+ CTRL, n = 5 Cth+/+ CysF, n = 6 Cth−/− CTRL, n = 6 Cth−/− CysF). f, qPCR gene expression Maoa in SFAT of Cth+/+ (n = 8) and Cth−/− (n = 10) mice fed with CysF diet for 6 days. g,k, Cth−/− mice were fed with CysF diet for 5 days and treated daily with a β-3 adrenergic receptor antagonist (L748337) or vehicle (PBS) (n = 7 per group). g, Percentage body weight change. h, Representative images of hematoxylin and eosin (H&E) staining of SFAT sections (scale bar, 50 μm). i, qPCR gene expression of Ucp1 in BAT depots. j, Immunoblot analysis of lipolysis regulators (pHSL, HSL and ATGL) in BAT samples. Actin is used as a loading control. k, Quantification of pHSL and ATGL signals (n = 6 per group). Data are expressed as mean ± s.e.m. Box plots represent median value and extend to the 25th and 75th percentiles. Whiskers are plotted down to the minimum and up to the maximum value. Statistical differences were calculated by two-way ANOVA with Sidak’s correction for multiple comparisons or by unpaired two-tailed t-tests. Panels a and b created with BioRender.com.
In brief, thermogenic signals seem to converge in the dorsal lateral parabrachial nucleus (LPBN), a critical hub that integrates inputs related to both environmental temperature changes and internal metabolic shifts53. From the LPBN, thermogenic signals are relayed to the medial preoptic area (MPOA), a key sensory integrator that regulates thermogenesis54,55. The MPOA then initiates a thermogenic response primarily through activation of the SNS. This response can be mediated by direct monosynaptic projections from the MPOA to premotor regions involved in sympathetic activation or through polysynaptic pathways involving the dorsomedial hypothalamus (DMH), bed nucleus of the stria terminalis (BNST) and the ventrolateral periaqueductal grey (vlPAG) adjacent to the dorsal raphe nucleus (DRN)56,57,58. All these regions were significantly activated (Fig. 5c,d). These findings support the role of the SNS in mediating cysteine-dependent thermogenesis. By activating this well-established thermogenic circuitry, cysteine deficiency induces a potent metabolic response, highlighting a critical mechanism by which systemic amino acid depletion can modulate EE and adipose browning. This underscores the broader physiological relevance of cysteine metabolism in energy homeostasis and thermoregulation.
Upstream of lipolysis, nonshivering thermogenesis is mainly activated by the SNS-derived adipose noradrenaline59. Mass-spectrometric analyses of subcutaneous adipose tissue (Fig. 5e), including imaging mass spectrometry of BAT (Extended Data Fig. 7a) revealed that cysteine-starvation-induced browning is associated with increased NA concentrations. This was coupled with a significant reduction in NA-degrading enzyme monoamine oxidase-a (Maoa) (Fig. 5f), without affecting catechol-o-methyl transferase (Comt), suggesting increased adipose NA bioavailability (Extended Data Fig. 7b). Finally, to test whether SNS-derived NA is required for adipose browning, the inhibition of β3-adrenergic receptors (ADRB3) by L748337 in Cth-deficient mice lacking cysteine-protected animals against weight loss (Fig. 5g), despite having a similar food intake (Extended Data Fig. 7c). Inhibition of β3-adrenergic signalling blunted adipose browning (Fig. 5h) and lowered Ucp1 (Fig. 5i), as well as lipolysis inducers pHSL and ATGL that are downstream of ADRB3 signalling (Fig. 5j,k). This was consistent with our unbiased RNA sequencing analyses that showed that cysteine-regulated adipose clusters contained the highest numbers of differentially expressed genes induced by β3-adrenergic receptor agonist (Extended Data Fig. 4e). Together our findings suggest that cysteine-depletion-induced browning is non-cell autonomous and lack of cysteine drives increased SNS activity leading to augmented ADRB3-mediated NA signalling that controls adipose browning to weight loss.
Cysteine deficiency reverses high-fat diet-induced obesity in mice
We next tested whether cysteine deficiency could be utilized to induce an adaptive thermogenic mechanism for fat mass reduction in the high-fat diet (HFD)-induced obesity model. The Cth−/− mice that had been fed HFD for 12 weeks were switched to an isocaloric HFD containing (HFD-CTRL) or lacking cystine (HFD-CysF). The Cth−/− mice fed a HFD-CysF diet were able to lose approximately 30% body weight within 1 week despite maintaining a high calorie intake (Fig. 6a). This weight loss was associated with major reductions in fat mass (Extended Data Fig. 7d). With weight loss, cysteine-deficient mice had reduced fasting glucose levels, improved glucose tolerance (Fig. 6b,c and Extended Data Fig. 7e) and increased EE (Fig. 6d and Extended Data Fig. 7f). Furthermore, cysteine deficiency in obese mice reduced RER suggesting higher fat utilization (Fig. 6e). Notably, immunohistological analysis of the white adipose depots demonstrated that cysteine deficiency induced browning even while on HFD with increased expression of UCP1 in SFAT and VFAT (Fig. 6f). Additionally, consistent with improvement of metabolic function in obesity, the gene expression of inflammasome components Il1b, Il18, Nlrp3, Casp1 and pro-inflammatory cytokines Il6 and Tnf were reduced in F4/80+CD11b+ adipose tissue macrophages in visceral adipose tissue (Fig. 6g) These results demonstrate that induction of cysteine deficiency can cause rapid weight loss in mouse model of diet-induced obesity, opening new avenues for future drug development for excess weight loss.
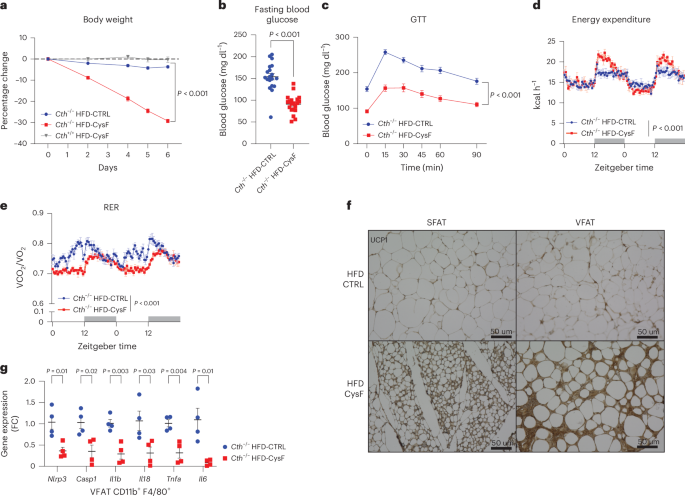
Cth−/− mice that had been fed HFD for 12 weeks were switched to HFD-CTRL or HFD-CysF. a, Percentage body weight change after switching to HFD-CysF diet (n = 6 Cth−/− HFD-CTRL, n = 5 Cth−/− HFD-CysF and n = 5 Cth+/+ HFD-CysF). b, Fasting blood glucose measured 1 week post diet switch (Cth−/− HFD-CTRL n = 19, Cth−/− HFD-CysF, n = 20). c, The glucose tolerance test (GTT) in Cth−/− after diet switch from HFD-CTRL to HFD-CysF (Cth−/− HFD-CTRL n = 19, Cth−/− HFD-CysF, n = 20). The glucose administration is based on total body weight. d, EE of Cth−/− mice fed with HFD-CTRL or HFD-CysF, average values of nights 4 and 5 of diet switch (n = 6 Cth−/− HFD-CTRL, n = 5 Cth−/− HFD-CysF). e, RER measured in metabolic chambers on days 4 and 5 of diet switch (n = 6 Cth−/− HFD-CTRL, n = 5 Cth−/− HFD-CysF). f, Representative histological sections of SFAT and VFAT stained for UCP1, 6 days after diet switch. g, qPCR analysis of inflammatory genes in CD11b+ F4/80+ VFAT macrophages of Cth−/− mice after diet switch to HFD-CTRL or HFD-CysF (n = 4 per group). Data are expressed as mean ± s.e.m. Statistical differences were calculated by two-way ANOVA with Sidak’s correction for multiple comparisons or by unpaired two-tailed t-tests.
Discussion
Adipose tissue regulates metabolism by orchestrating inter-organ communication required for healthy longevity60. Analyses of adipose tissue of humans that underwent moderate CR in free-living conditions have highlighted genes and pathways that link energy metabolism and inflammation to influence healthspan1,2. In rodents, restriction of calories up to 40% reduces CBT and induces browning of the adipose tissue of mice reared in sub-thermoneutral temperature61. The CR in humans upregulated the fatty acid oxidation and futile lipid cycling induced-thermogenic pathways but UCP1 was undetectable in adipose tissue of CALERIE-II participants1. Similarly, weight loss in obese humans is not associated with classical UCP1 adipose tissue browning62. This suggests that alternative UCP1-independent mechanisms maybe at play in human in response to CR. In this regard, reduction of CBT63 and increased FGF21 is a common link between CR and MR-induced adipose browning and increased longevity7,41,61. Our studies demonstrated that reduction of cysteine and subsequent rewiring of downstream cysteine metabolism is linked to adipose browning and weight loss.
Expression and activity of the TSP genes CBS and CTH increase when cysteine is low10. Indeed, during CR, the TSP is induced to defend against the depletion of cysteine levels. MR regimens that improve lifespan are also restricted or deficient in cysteine12, and it is unclear whether MR or cysteine restriction drives pro-longevity effects. Thus, to understand the metabolic requirement of dietary non-essential amino acid such as cysteine, a genetic mouse model is required that lacks Cth in conjunction with restriction of cysteine. Notably, previously reported Cth mutant mice originally generated on a 129SvEv mouse strain maintained on cysteine-replete normal chow diet were reported to display hypertension and motor dysfunction characteristic of neurodegenerative changes in corpus striatum64,65. Using this same model cysteine depletion in this global Cth-deficient mice also causes weight loss and adipose tissue browning together with decrease of CoA levels similar to our findings66. We also demonstrate that conditional deletion of Cth (on a pure C57/B6 background) in adipose tissue and liver is not sufficient to induces weight loss and cause adipose browning as other tissues compensate to maintain to systemic cysteine concentrations after cysteine elimination in the diet. Our data establish that systemic cysteine depletion drives adipose tissue thermogenesis without causing behavioural defects or pathological lesions.
While it is still unclear why cysteine deficiency triggers the activation of adipose browning, the mechanism of thermogenesis depends on upstream SNS-mediated sympathetic β3-adrenergic signalling and partially requires FGF21 and can be successfully maintained even in the absence of UCP1 and at thermoneutrality. Future studies of specific ablation of UCP1-independent thermogenic genes in Cth−/− mice on cysteine restriction are required to determine the causal downstream pathway that causes thermogenesis. The model of cysteine-deprivation-induced strong browning response may thus allow the discovery of an alternate UCP1-independent mechanism of adipose tissue thermogenesis.
In healthy humans undergoing CR, consistent with reduced cysteine, glutathione, a major redox regulator, was reduced in adipose tissue. The Cth-deficient mice on a cysteine-free diet show a decrease in CoA and GSH with a compensatory increase in Gclc, Gss and accumulation of γ-glutamyl-peptides. Despite increased oxidative stress, the adipose tissue histology, RNA sequencing and lipidomic analysis of BAT did not reveal overt ferroptosis in cysteine-depletion-induced weight loss. Future studies may reveal cysteine-dependent alternative protective mechanisms that control redox balance and ferroptosis while sustaining UCP1-independent thermogenesis.
Taken together, this study expands our understanding of pathways activated by pro-longevity dietary interventions that confer metabolic adaptation required to maintain tissue homeostasis. Thus, the manipulation of TSP activity to drive adipose tissue browning also has implications for developing interventions that control adiposity and promote longevity. In humans, restriction of methionine and cysteine increased FGF21 and caused a reduction in body weight with improvement of metabolic parameters67. Similar to our findings, the metabolic benefits of methionine and cysteine dietary restriction in humans were greater than MR alone67. Here, based on human dietary restriction studies and mouse models of cysteine deficiency, we demonstrate that cysteine is essential for organismal metabolism as its absence triggers adipose browning with progressive weight loss.
Methods
Human samples
The participants in this study were part of the CALERIE Phase 2 study68, which was a multicentre, parallel-group, randomized controlled trial by recruitment of non-obese healthy individuals. Overall, 238 adults participated at three different locations: Pennington Biomedical Research Center, Washington University and Tufts University (NCT00427193, registered on ClinicalTrials.gov). Duke University served as a coordinating centre. Participants were randomly assigned to of 25% CR or ad libitum caloric intake for 2 years. CR group participants actually reached 14% of CR1,3. Men were between 21 and 50 years old and women were between 21 and 47 years old. Their body mass index was between 22.0 and 27.9 kg m–2 at the initial visit. Samples were collected at baseline, 1 year and 2 years of intervention. Abdominal subcutaneous adipose tissue biopsy was performed on a portion of CR group participants and used for RNA sequencing and metabolomics in this study. All studies were performed under a protocol approved by the Pennington institutional review board with written informed consent from all participants.
Mice
All mice were on a C57BL/6J (B6) genetic background. Cth−/− mice (C57BL/6NTac-Cthtm1a(EUCOMM)Hmgu/Ieg) were purchased from the European Mouse Mutant Cell Repository. Breeding these mice to Flipase transgenic mice from The Jackson Laboratories generated Cthfl/fl mice, which were crossed to Adipoq-cre and Albumin-cre, purchased from Jackson Laboratories. Ucp1−/− and CHOP−/− mice were purchased from The Jackson Laboratories and crossed to Cth−/− mice. Fgf21−/− mice were kindly provided by S. Kliewer (UT Southwestern) as described previously40 and crossed to Cth−/− mice. All mice used in this study were housed in specific-pathogen-free facilities in ventilated cage racks that deliver HEPA-filtered air to each cage with free access to sterile water through a Hydropac system at Yale School of Medicine. Mice were fed ad libitum with a standard vivarium chow (Harlan 2018s), unless a special diet was provided, and housed under a 12-h light–dark cycle with controlled temperature and humidity conditions (approximately 22 °C and 60% humidity). Unless stated, male mice were used for the experiments, aged 3–5 months at the start of the experiment. All experiments and animal use were approved by the Institutional Animal Care and Use Committee at Yale University. Animals were either allocated to experimental groups depending on their genotype or randomly when working with the same genotype.
Diet studies
For cysteine-deficiency studies, mice were fed either a control diet (511387), CysF diet (510027), HFD-CTRL diet (511412) or HFD-CysF diet (511411) purchased from Dyets, for 6 days unless specified otherwise. For pair-feeding studies, mice were provided with either ad libitum or 2.22–2.27 g of diet daily.
Western blot analysis
Cell lysates were prepared using RIPA buffer and optionally frozen and stored at −80 °C. Samples were left on ice, vortexing every 10 min for 30 min. For tissue samples, snap-frozen tissues were ground by mortar and pestle in liquid nitrogen and resuspended in RIPA buffer with protease and phosphatase inhibitors. Samples were centrifuged at 14,000g for 15 min and the supernatant was collected protein concentration was determined using the DC Protein Assay (Bio-Rad) and transferred to a nitrocellulose membrane. The following antibodies (and source) were diluted 1:1,000 and used to measure protein expression: β-actin (Cell Signalling 4967), pHSL p660 (Cell Signalling 4126), ATGL (Cell Signalling 2439S), UCP1 (Abcam ab10983), CTH (Novus H00001491-M03), tubulin (Abcam ab7291), HSL (Cell Signalling 4107), TH (Cell Signalling 2792), IRE1a (Cell Signalling 3294), Calnexin (Novus NB300-518), BiP (Cell Signalling 3177), CHOP (Cell Signalling 2895), HSP90 (Cell Signalling 4874), anti-puromycin (Sigma-Aldrich MABE343) and HSP40 (Cell Signalling 4868); followed by incubation with appropriate HRP-conjugated secondary antibodies, diluted 1:5,000 (anti-rabbit IgG, HRP-linked antibody (Cell Signalling 7074) or peroxidase AffiniPure goat anti-rabbit IgG (H+L) (Jackson ImmunoResearch, 111-035-003)).
Gene expression analysis
Cells or ground tissue (described above) were collected in STAT-60 (Tel-test). RNA from cells were extracted using QIAGEN RNeasy micro kits following the manufacturer’s instructions. For tissue samples, RNA was extracted using Zymo mini kits following the manufacturer’s instructions. During RNA extraction, DNA was digested using RNase free DNase set (QIAGEN). Synthesis of complementary DNA was performed using an iScript cDNA synthesis kit (Bio-Rad) and real-time quantitative PCR (qPCR) was conducted using Power SYBR Green detection reagent (Thermo Fisher Scientific) on a Light Cycler 480 II (Roche). Primer sequences are listed in Supplementary Table 7.
Glucose tolerance test
Cth−/− HFD-CTRL and HFD-CysF mice were fasted 14 h before glucose tolerance test. Glucose was given by intraperitoneal (i.p.) injection based on body weight (0.4 g kg−1). Cth−/− CTRL and CysF mice were fasted for 4 h. Glucose was given by i.p. based on lean mass determined by EchoMRI (2 g kg−1 lean mass). Blood glucose levels were measured by handheld glucometer (Breeze, Bayer Health Care).
Flow cytometry
Adipose tissue was digested at 37 °C in HBSS (Life Technologies) + 0.1% collagenase I or II (Worthington Biochemicals). The SVF was collected by centrifugation, washed and filtered using 100-μm and 70-μm strainers. Cells were stained with LIVE/DEAD Fixable Aqua Dead Cell Stain kit (Thermo Fisher Scientific) and then for surface markers, including anti-CD45-BV711 (BioLegend, 103147) or anti-CD45-PE-Cy7 (BioLegend, 103114), anti-CD3-Perp-Cy5.5 (BioLegend, 100327), anti-B220-AF488 (BioLegend, 103225), anti-CD11b-BV711 (BioLegend, 101241), anti-F4/80-BV421 (BioLegend, 123132), anti-Ly6G-AF700 (BioLegend, 127622), anti-Siglec F-AF647 (BD, 562680), anti-CD24-PerCp-Cy5.5 (eBioscience, 45-0242-80), anti-F3-PE (R&D, FAB3178P), anti-CD31-PE-Cy7 (eBioscience, 25-0311-81), anti-Pdgfra-BV605 (BioLegend, 135916), anti-Dpp4-FITC (BioLegend, 137805) and anti-CD9-APC (BioLegend, 124813). Antibodies were diluted 1:200. Cells were fixed in 2% PFA. Samples were acquired on a custom LSR II or sorted with a FACSARIA cell sorter, using Diva software (v.8.0.1). Data were analysed in FlowJo (v.10.3).
Single-cell RNA sequencing
For SVF, female Cth+/+ and Cth−/− mice were fed CTRL of CysF diet for 4 days. SFAT was collected, with lymph nodes removed, pooled and digested. Isolated cells were subjected to droplet-based 3′ end massively parallel scRNA-seq using Chromium Single Cell 3′ Reagent kits as per manufacturer’s instructions (10x Genomics). The libraries were sequenced using a HiSeq3000 instrument (Illumina). Sample demultiplexing, barcode processing and single-cell 3′ counting was performed using the Cell Ranger Single-Cell Software Suite (10x Genomics). The Cell Ranger count was used to align samples to the reference genome (mm10), quantify reads, and filter reads with a quality score below 30. The Seurat package in R was used for subsequent analysis31. Cells with mitochondrial content greater than 0.05% were removed and data were normalized using a scaling factor of 10,000, and number of unique molecular identifiers (nUMI) was regressed with a negative binomial model. Principal-component analysis (PCA) was performed using the top 3,000 most variable genes and t-distributed stochastic neighbour embedding (t-SNE) analysis was performed with the top 20 principal components. Clustering was performed using a resolution of 0.4. The highly variable genes were selected using the FindVariableFeatures function with mean >0.0125 or <3 and dispersion >0.5. These genes are used in performing the linear dimensionality reduction. PCA was performed before clustering and the first 20 principal components were used based on the ElbowPlot. Clustering was performed using the FindClusters function, which works on k-nearest neighbour graph model with granularity ranging 0.1–0.9 and selected 0.4 for the downstream clustering. For identifying the biomarkers for each cluster, we performed differential expression between each cluster to all other clusters, identifying positive markers for that cluster. To understand the trajectory of the adipocyte progenitors, we used Monocle2 to analyse scRNA-seq data of clusters 0, 1 and 2 (ref. 69).
Whole-tissue RNA sequencing and transcriptome analysis
Snap-frozen tissues were ground by mortar and pestle in liquid nitrogen and resuspended in STAT-60. RNA was extracted using Zymo mini kits. RNA was sequenced on a HiSeq2500. The quality of raw reads was assessed with FastQC. Raw reads were mapped to the GENCODE vM9 mouse reference genome (GENCODE) using STAR Aligner with the following options: –outFilterMultimapNmax 15 –outFilterMismatchNmax 6 –outSAMstrandField All –outSAMtype BAM SortedByCoordinate –quantMode TranscriptomeSAM. The quality control of mapped reads was performed using in-house scripts that employ Picard tools. The list of rRNA genomic intervals that we used for this quality control was prepared on the basis of UCSC mm10 rRNA annotation file (UCSC) and GENCODE primary assembly annotation for vM9 (GENCODE). rRNA intervals from these two annotations were combined and merged to obtain the final list of rRNA intervals. These intervals were used for the calculation of the percentage of reads mapped to rRNA genomic loci. Strand specificity of the RNA-seq experiment was determined using an in-house script, on the basis of Picard mapping statistics. Expression quantification was performed using RSEM. For the assessment of expression of mitochondrial genes, we used all genes annotated on the mitochondrial chromosome in the GENCODE vM9 mouse reference genome. PCA was performed in R. For PCA, the donor effect was removed using the ComBat function from the sva R-package. Gene differential expression was calculated using DESeq2. Pathway analysis was conducted using fgsea (fast GSEA) R-package (fgsea) with the minimum of 15 and maximum of 500 genes in a pathway and with 1 million of permutations. For the pathway analysis, we used the Canonical Pathways from the MSigDB C2 pathway set (MSigDB1 and MSigDB2), v.6.1. The elimination of redundant significantly regulated pathways (adjusted P < 0.05) was carried out using an in-house Python script in the following way. We considered all ordered pairs of pathways, where the first pathway had normalized enrichment score equal to or greater than the second pathway. For each ordered pair of pathways, we analysed the leading gene sets of these pathways. The leading gene sets were obtained using fgsea. If at least one of the leading gene sets in a pair of pathways had more than 60% of genes in common with the other leading gene set, then we eliminated the second pathway in the pair.
Sample preparation for metabolome analysis
Frozen tissues or serum samples, together with internal standard compounds (mentioned below), was subjected to sonication in 500 μl of ice-cold methanol. To this, an equal volume of ultrapure water (LC–MS grade, Wako) and 0.4 volume of chloroform were added. The resulting suspension was centrifuged at 15,000g for 15 min at 4 °C. The aqueous phase was then filtered using an ultrafiltration tube (Ultrafree MC-PLHCC, Human Metabolome Technologies), and the filtrate was concentrated by nitrogen spraying (aluminium block bath with nitrogen gas spraying system, DTU-1BN/EN1-36, TAITEC). The concentrated filtrate was dissolved in 50 μl of ultrapure water and utilized for ion chromatography (IC)–MS and LC–MS/MS analysis. Methionine sulfone and 2-morpholinoethanesulfonic acid were employed as internal standards for cationic and anionic metabolites, respectively. The recovery rate (%) of the standards in each sample measurement was calculated to correct for the loss of endogenous metabolites during sample preparation.
IC–MS metabolome analysis
Anionic metabolites were detected using an orbitrap-type MS (Q-Exactive focus; Thermo Fisher Scientific) connected to a high-performance IC system (ICS-5000+, Thermo Fisher Scientific) that allows for highly selective and sensitive metabolite quantification through IC separation and a Fourier transfer MS principle. The IC system included a modified Thermo Scientific Dionex AERS 500 anion electrolytic suppressor, which converted the potassium hydroxide gradient into pure water before the sample entered the mass spectrometer. Separation was carried out using a Thermo Scientific Dionex IonPac AS11-HC column with a particle size of 4 μm. The IC flow rate was 0.25 ml min−1, supplemented post-column with a makeup flow of 0.18 ml min−1 methanol. The potassium hydroxide gradient conditions for IC separation were as follows: from 1 mM to 100 mM (0–40 min), to 100 mM (40–50 min) and to 1 mM (50.1–60 min), with a column temperature of 30 °C. The Q-Exactive focus mass spectrometer was operated in the ESI-negative mode for all detections. A full mass scan (m/z 70–900) was performed at a resolution of 70,000. The automatic gain control target was set at 3 × 10⁶ ions, and the maximum ion injection time was 100 ms. The source ionization parameters were optimized with a spray voltage of 3 kV, and other parameters were as follows: transfer temperature of 320 °C; S-Lens level of 50, heater temperature of 300 °C; sheath gas of 36 and Aux gas of 10.
LC–MS/MS metabolome analysis
Cationic metabolites were measured using LC–MS/MS. The LC–MS-8060 triple-quadrupole mass spectrometer (Shimadzu corporation) with an electrospray ionization (ESI) ion source was employed to perform multiple reaction monitoring in positive and negative ESI modes. The samples were separated on a Discovery HS F5-3 column (2.1 mm internal diameter × 150 mm length, 3-μm particle, Sigma-Aldrich) using a step gradient of mobile phase A (0.1% formate) and mobile phase B (0.1% acetonitrile) with varying ratios: 100:0 (0–5 min), 75:25 (5–11 min), 65:35 (11–15 min), 5:95 (15–20 min) and 100:0 (20–25 min). The flow rate was set at 0.25 ml min−1 and the column temperature was maintained at 40 °C.
Monoamine measurements by HPLC with electro chemical detector
For low concentration monoamine measurements, extracted tissue metabolites by abovementioned protocol were injected with an autosampler (M-510, Eicom) into a HPLC unit (Eicom) coupled to an ECD (ECD-300, Eicom). The samples were resolved on the Eicompak SC-5ODS column (φ3.0 × 150 mm, Eicom), using an isocratic mobile phase (5 mg l−1 EDTA-2Na, 220 mg l−1 sodium 1-octanesulfonate in acetate/citrate buffer (0.1 M, pH 3.5)/methanol (83:17, v/v)), at a flow rate of 0.5 ml min−1 and a column temperature of 25 °C. At the ECD, analytes were subjected to oxidation reactions within the ECD unit with WE-3G graphite electrode (applied potential is +750 mV against an Ag/AgCl reference electrode). Resulting chromatograms were analysed using the software EPC-300 (Eicom).
Lipidome analysis
To extract total lipids, frozen tissues were mixed with 500 μl of 1-butanol/methanol (1:1, v/v) containing 5 mM ammonium formate. The mixture was vortexed for 10 s, sonicated for 15 min in a sonic water bath and then centrifuged at 16,000g for 10 min at 20 °C. The supernatant was transferred to a 0.2-ml glass insert with a Teflon insert cap for LC ESI–MS analysis.
For lipidomic analysis, a Q-Exactive focus orbitrap mass spectrometer (Thermo Fisher Scientific) was connected to an HPLC system (Ultimate3000, Thermo Fisher Scientific). The samples were separated on a Thermo Scientific Accucore C18 column (2.1 × 150 mm, 2.6 μm) using a step gradient of mobile phase A (10 mM ammonium formate in 50% acetonitrile and 0.1% formic acid) and mobile phase B (2 mM ammonium formate in acetonitrile/isopropyl alcohol/water, ratios of 10:88:2, v/v/v, with 0.02% formic acid). The gradient ratios used were 65:35 (0 min), 40:60 (0–4 min), 15:85 (4–12 min), 0:100 (12–21 min), 0:100 (21–24 min), 65:35 (24–24.1 min) and 100:0 (24.1–28 min) at a flow rate of 0.4 ml min−1 and a column temperature of 35 °C. The Q-Exactive focus mass spectrometer operated in both positive and negative ESI modes. It performed a full mass scan (m/z 250–1,100), followed by three rapid data-dependent MS/MS scans, at resolutions of 70,000 and 17,500, respectively. The automatic gain control target was set at 1 × 10⁶ ions, and the maximum ion injection time was 100 ms. The source ionization parameters included a spray voltage of 3 kV, transfer tube temperature of 285 °C, S-Lens level of 45, heater temperature of 370 °C, sheath gas at 60 and auxiliary gas at 20. The acquired data were analysed using LipidSearch software (Mitsui Knowledge Industry) for major phospholipids (PLs). The search parameters for LipidSearch software were as follows: precursor mass tolerance of 3 ppm, product mass tolerance of 7 ppm and m-score threshold of 3.
Visualizing noradrenaline distribution using MALDI-imaging mass spectrometry
The tissue block was frozen and secured onto a disc using a cryoembedding medium (Super Cryoembedding Medium, SECTION-LAB), then equilibrated at −16 °C in cryostats (Leica Biosystems). Tissue sections, 8-µm thick, were cut and mounted onto conductive indium-tin-oxide (ITO)-coated glass slides (Matsunami Glass Industries). A solution of tetrafluoroborate salts of 2,4-diphenyl-pyrylium (DPP) (1.3 mg ml−1 in methanol) for on-tissue derivatization of monoamines and DHB-matrix (50 mg ml−1 in 80% ethanol) were manually sprayed onto the tissue using an airbrush (Procon Boy FWA platinum; Mr Hobby). The manual spray was performed at room temperature, applying 40 μl mm−2 with a distance of approximately 50 mm. The samples were analysed using a linear ion trap mass spectrometer (LTQ XL, Thermo Fisher Scientific). The raster scan pitch was set at 50 µm. Signals of noradrenaline-DPP (m/z 384 > 232) were monitored with a precursor ion isolation width of m/z 1.0 and a normalized collision energy of 45%. Ion images were reconstructed using ImageQuest v.1.1.0 software (Thermo Fisher Scientific).
iDISCO+ whole-brain clearing and imaging
Mice were transcardially perfused with PBS, followed by 4% PFA. Brains were then put through a 24 h post-fixing period, after which, immunolabelling and whole-brain clearing were performed according to previously established protocols. Antibodies used for c-Fos labelling were Synaptic Systems rabbit c-Fos 226008 (primary) and Alexa-Fluor 647 donkey anti-rabbit (secondary), respectively. Fos labelling studies were next analysed using ClearMap52. For acquisition, cleared samples were imaged in a sagittal orientation (left lateral side up) on a light-sheet microscope (Miltenyi Blaze) equipped with a sCMOS camera and LVMI-Fluor ×4 objective lens equipped with a 6-mm working distance dipping cap. Inspector Microscope controller software was used. Samples were scanned in the 640 nm channel. Images were taken every 6 μm and reconstructed with ClearMap software52 for quantification or Imaris v.10.1 software for visualization. The 480-nm channel was used with a ×1.3 objective lens for autofluorescence.
Core body temperature measurement
Animals were anaesthetized with isoflurane, first at a rate of 2–3% and maintained at 0.5–2% in oxygen during surgery. Mice were kept on a heating pad throughout surgery. Mice were injected with buprenorphine and bupivacaine as pre-emptive analgesia. A small ventral incision of 1 cm was made after clipping hair and disinfection with betadine and 70% ethanol. DST nano-T temperature loggers (Star-Oddi) were placed in the peritoneal cavity, and abdominal muscle and skin were sutured closed. After surgery, mice were singly housed and provided with Meloxicam for 48 h. After 7 days, sutures were removed. Ten days after surgery, mice were started on CTRL or CysF diet, and loggers were removed for data collection after killing. Loggers were programmed to take temperature readings every 30 min.
Metabolic cages
The EE, RER, activity and food intake of mice were monitored using the TSE PhenoMaster System (v.3.0.3) Indirect Calorimetry System. Each mouse was housed in individual chambers for 3 days for acclimation and switched to experimental diet for 6 days. Each parameter was measured every 30 min. EE and RER were calculated based on the oxygen consumption (O2) and carbon dioxide production (CO2). Mouse activity was detected by infra-red sensors, and food intake and water consumption were measured via weight sensors on food and water dispensers located in the cage.
EchoMRI
The parameters of body composition were measured in vivo by magnetic resonance imaging (EchoMRI; Echo Medical Systems). The amount of fat mass, lean mass and free water were measured by the analysis. For the analysis, each mouse was placed in an acrylic tube with breathing holes and the tube was inserted in the MRI machine. The analysis per mouse takes approximately 90 s and automatically calculated numerical results were analysed.
Climate chambers
Mice were acclimated in climate chambers (model 7000-10, Caron) at either 30 °C or 20 °C, with humidity maintained at 50% under a 12 h light–dark cycle. After 1 week acclimation, mice were switched to either CTRL or CysF diet for 6 days, while maintained in the climate chambers. Mice were handled daily to measure body weight.
Faeces bomb calorimetry
Faeces were collected daily over the course of CTRL or CysF feeding. Samples were dried for 72 h. Faecal bomb calorimetry was performed at UT Southwestern Medical Center Metabolic Phenotyping Core using a Parr 6200 Isoperibol Calorimeter equipped with a 6510 Parr Water Handling.
Serum and tissue measurements
After blood collection by cardiac puncture, samples were allowed to clot for 2 h. Serum was collected after centrifugation. FGF21 and GDF15 levels in the serum were measured by ELISA (R&D). Cysteine levels were determined by competitive EIA (LS-Bio). Glycerol levels were determined by colorimetric assay (Sigma-Aldrich). Snap-frozen tissues were homogenized in PBS supplemented with EDTA and protease and phosphatase inhibitors. Samples were filtered through 10 kDa Amicon Ultra Centrifugal filters (Millipore). Total GSH and GSSG levels were determined by colorimetric assay (Cayman Chemical). Coenzyme A levels were measured by fluorometric assay (Abcam). Data were normalized to protein concentration, determined beforehand with colorimetric assay (Bio-Rad).
SUnSET assay
SUnSET assay was performed to assess protein synthesis70. Mice were injected with puromycin (Invivogen) (40 nmol g−1 body weight). Mice were killed 30 min after administration and tissues were collected and snap-frozen in liquid nitrogen. Samples were processed for western blotting to assess incorporation of puromycin in newly synthesized proteins.
β-3 adrenergic receptor inhibition
Mice were administered twice daily L748337 (Santa Cruz Biotechnology) (5 mg kg−1) by i.p. injection. Mice were weighed daily and assessed for their health.
Histology
Tissues were collected in 10% formalin, embedded in paraffin and sectioned into 5-μm thick sections. Tissues were stained with haematoxylin and eosin (H&E) or stained for UCP1 (Abcam) and goat anti-rabbit HRP (DAKO) and developed for colour using Abcam DAB substrate kit.
Animal preparation for BIRDS temperature analysis
The animals were anaesthetized with 3% isoflurane in an induction chamber and then kept at 2–3% during surgery. The animal was laid back on a microwaveable heating pad. Before incision, a single dose of bupivacaine was given for analgesia. A 1–2-cm midline incision was made on the neck to expose the jugular vein. Another small incision (<1 cm) was made at the back of the neck. A sterile polyurethane or silicone catheter with a metal guide was inserted from the back of the neck, where the vascular port was fixed to the jugular vein. Before implantation the port and the catheter were flushed with heparinized saline (25 IU ml−1). The jugular vein was catheterized toward the heart. The skin was closed with surgical sutures after application of triple antibiotic ointment and the vascular port was fixed. The duration of the surgical procedure was 15–20 min.
MR data acquisition
TmDOTMA− was purchased from Macrocyclics. Temperature mapping with BIRDS was performed on a 9.4T Bruker scanner. The respiration rate was monitored during the entire duration of the experiment. A 200 mM TmDOTMA− solution was infused at a rate of 60 to 80 µl h−1 for 1–2 h. The infusion rate was adjusted according to animal physiology. The T2-weighted MR images were acquired with a field of view of 23 × 23 mm2, 128 × 128 matrix, 23 slices of 0.5-mm thickness, TR = 3 s and TE = 9 ms. The extremely short T1 and T2 relaxation times (<5 ms) of the TmDOTMA− methyl group allowed ultrafast temperature mapping with BIRDS using 3D chemical shift imaging (CSI) acquisition with a short TR (10 ms) and wide bandwidths (±150 ppm). Temperature mapping with BIRDS was started immediately after detection of global MR signal of TmDOTMA− methyl group, at about 1 h after the start of the infusion. The CSI was acquired using a field of view of 23 × 15 × 23 mm3, 809 spherical encoding steps, 21 min acquisition and reconstructed to 23 × 15 × 23, with a voxel resolution of 1 × 1 × 1 mm3. Selective excitation of the TmDOTMA− methyl group was achieved using a single-band, 200-µs Shinnar-Le Roux (SLR) RF pulse. The MR spectrum in each voxel was line broadened (200 Hz) and phased (zero-order) in MATLAB (MathWorks), and the corresponding temperature Tc was calculated from the chemical shift \({\delta }_{C{H}_{3}}\) of the TmDOTMA− methyl group according to
$${T}_{c}={a}_{0}+{a}_{1}({\delta }_{C{H}_{3}}-{\delta }_{0})+{a}_{2}{({\delta }_{C{H}_{3}}-{\delta }_{0})}^{2}$$
(1)
where δ0 = −103.0 ppm and the coefficients a0 = 34.45 ± 0.01, a1 = 1.460 ± 0.003 and a2 = 0.0152 ± 0.0009 were calculated from the linear least-squares fit of temperature as a function of chemical shift \({\delta }_{C{H}_{3}}\). Statistical analysis was carried out using Student’s t-test with two tails, with P < 0.05 used as a cutoff for significance.
In vivo spin trapping and electron paramagnetic resonance spectroscopy
POBN (α-(4-pyridyl-1-oxide)-N-t-butylnitrone, Enzo) was used for spin trapping; POBN was dissolved in saline and administered i.p. at 500 mg kg−1 body weight. Tissue samples (VFAT, SFAT and BAT) were collected 45 min after injection, immediately frozen in liquid nitrogen and stored at −80 °C until EPR measurements. Lipid extraction was performed using chloroform:methanol (2:1) (Folch extraction) as described previously71. All EPR spectra were recorded in a quartz flat cell using an X-band EMX plus EPR Spectroscope (parameters: 3,480 ± 80 G scan width, 105 receiver gain and 20 mW microwave power; time constant of 1,310 ms and conversion time of 655 ms).
Aconitase activity
Aconitase activity was measured with an Aconitase Assay kit (Cayman). Freshly collected SFAT and VFAT samples were measured at 500 μg total protein pe ml, and BAT samples were measured at 100 μg total protein per ml. All results were normalized to 500 μg ml−1 total protein concentration. The standard protocol provided with the kits was followed.
In vitro adipocyte differentiation
Stromal vascular fraction from visceral depots of Cth−/− was isolated as previously described. Cells were plated in growth medium (DMEM supplemented with 10% FBS and 1% penicillin–streptomycin) and expanded for 3–5 days. Adipocyte differentiation was induced with growth medium supplemented with insulin (5 μg ml−1), rosiglitazone (1 μM), iso-butyl-methylxanthine (0.5 mM) and dexamethasone (1 μM) for 48 h. Cells were maintained on differentiation medium containing insulin (5 μg ml−1) and rosiglitazone (1 μM) for 96 h. Fully differentiated cells were then treated with various concentrations of cystine (0–200 μM) for 48 h, in cystine and methionine-free DMEM (Gibco) supplemented with 10% dialysed FBS, 1% penicillin–streptomycin and 200 μM methionine.
Quantification and statistical analysis
Data collection and analysis were not performed blind to the conditions of the experiments. Data were analysed with GraphPad (v.9.4.0) or R (v.3.4.2). Statistical differences between groups were calculated by unpaired two-tailed t-tests. For comparing groups over time, mice were individually tracked, and groups were compared using two-way analysis of variance (ANOVA) with Sidak’s correction for multiple comparisons. For all experiments P ≤ 0.05 was considered significant. No statistical methods were used to pre-determine sample sizes, but our sample sizes are similar to those reported in the field. Data distribution was assumed to be normal, but this was not formally tested. Some mice were excluded from the study due to abnormal health conditions or reaching the humane end point.
Reporting summary
Further information on research design is available in the Nature Portfolio Reporting Summary linked to this article.
Data availability
Sequencing data are accessible in the Gene Expression Omnibus repository. Murine bulk RNA-seq data of the adipose depots after cysteine restriction is under accession code GSE292788; scRNA-seq of the adipose SVF is under GSE293660; and human RNA-seq data from the CALERIE-II study were published previously1. Source data are provided with this paper.
References
Spadaro, O. et al. Caloric restriction in humans reveals immunometabolic regulators of health span. Science 375, 671–677 (2022).
Ryu, S. et al. The matricellular protein SPARC induces inflammatory interferon-response in macrophages during aging. Immunity 55, 1609–1626 (2022).
Redman, L. M. et al. Metabolic slowing and reduced oxidative damage with sustained caloric restriction support the rate of living and oxidative damage theories of aging. Cell Metab. 27, 805–815 (2018).
Green, C. L., Lamming, D. W. & Fontana, L. Molecular mechanisms of dietary restriction promoting health and longevity. Nat. Rev. Mol. Cell Biol. 23, 56–73 (2022).
Grandison, R. C., Piper, M. D. & Partridge, L. Amino-acid imbalance explains extension of lifespan by dietary restriction in Drosophila. Nature 462, 1061–1064 (2009).
Orentreich, N., Matias, J. R., DeFelice, A. & Zimmerman, J. A. Low methionine ingestion by rats extends life span. J. Nutr. 123, 269–27 (1993).
Wanders, D. et al. FGF21 mediates the thermogenic and insulin-sensitizing effects of dietary methionine restriction but not its effects on hepatic lipid metabolism. Diabetes 66, 858–867 (2017).
Xu, Q. et al. HNF4α regulates sulfur amino acid metabolism and confers sensitivity to methionine restriction in liver cancer. Nat. Commun. 11, 3978 (2020).
Plaisance, E. P. et al. Role of beta-adrenergic receptors in the hyperphagic and hypermetabolic responses to dietary methionine restriction. Am. J. Physiol. Regul. Integr. Comp. Physiol. 299, R740–R750 (2010).
Stipanuk, M. H. Metabolism of sulfur-containing amino acids. Annu. Rev. Nutr. 6, 179–209 (1986).
Johnson, D. C., Dean, D. R., Smith, A. D. & Johnson, M. K. Structure, function, and formation of biological iron-sulfur clusters. Annu. Rev. Biochem. 74, 247–281 (2005).
Elshorbagy, A. K. et al. Cysteine supplementation reverses methionine restriction effects on rat adiposity: significance of stearoyl-coenzyme A desaturase. J. Lipid Res. 52, 104–112 (2011).
Deplancke, B. & Gaskins, H. R. Redox control of the transsulfuration and glutathione biosynthesis pathways. Curr. Opin. Clin. Nutr. Metab. Care 5, 85–92 (2002).
Moosmann, B., Schindeldecker, M. & Hajieva, P. Cysteine, glutathione and a new genetic code: biochemical adaptations of the primordial cells that spread into open water and survived biospheric oxygenation. Biol. Chem. 401, 213–231 (2020).
Jordan, S. F. et al. Spontaneous assembly of redox-active iron-sulfur clusters at low concentrations of cysteine. Nat. Commun. 12, 5925 (2021).
Uthus, E. O. & Brown-Borg, H. M. Methionine flux to transsulfuration is enhanced in the long living Ames dwarf mouse. Mech. Ageing Dev. 127, 444–450 (2006).
Hine, C. et al. Endogenous hydrogen sulfide production is essential for dietary restriction benefits. Cell 160, 132–144 (2015).
Tyshkovskiy, A. et al. Identification and application of gene expression signatures associated with lifespan extension. Cell Metab. 30, 573–593.e8 (2019).
Shalayel, I. et al. Cysteine chemistry in connection with abiogenesis. Eur. J. Org. Chem. 2020, 3019–3023 (2020).
Kang, Y. P. et al. Non-canonical glutamate-cysteine ligase activity protects against ferroptosis. Cell Metab. 33, 174–189.e7 (2021).
Fujii, J., Osaki, T., Soma, Y. & Matsuda, Y. Critical roles of the cysteine-glutathione axis in the production of γ-glutamyl peptides in the nervous system. Int. J. Mol. Sci. 24, 8044 (2023).
OG, Lien Jr & Greenberg, D. M. Identification of α-aminobutyric acid enzymatically formed from threonine. J. Biol. Chem. 200, 367–371 (1953).
Seelig, G. F., Simondsen, R. P. & Meister, A. Reversible dissociation of gamma-glutamylcysteine synthetase into two subunits. J. Biol. Chem. 259, 9345–9347 (1984).
Huang, C. S., Chang, L. S., Anderson, M. E. & Meister, A. Catalytic and regulatory properties of the heavy subunit of rat kidney γ-glutamylcysteine synthetase. J. Biol. Chem. 268, 19675–19680 (1993).
Rouault, T. A. Mammalian iron-sulphur proteins: novel insights into biogenesis and function. Nat. Rev. Mol. Cell Biol. 16, 45–55 (2015).
Tajima, K. et al. Mitochondrial lipoylation integrates age-associated decline in brown fat thermogenesis. Nat. Metab. 1, 886–898 (2019).
Chouchani, E. T., Kazak, L. & Spiegelman, B. M. New advances in adaptive thermogenesis: UCP1 and beyond. Cell Metab. 29, 27–37 (2019).
Cannon, B. & Nedergaard, J. Brown adipose tissue: function and physiological significance. Physiol. Rev. 84, 277–359 (2004).
Emont, M. P. et al. A single-cell atlas of human and mouse white adipose tissue. Nature 603, 926–933 (2022).
Goldberg, E. L. et al. IL-33 causes thermogenic failure in aging by expanding dysfunctional adipose ILC2. Cell Metab. 33, 2277–2287 (2021).
Burl, R. B. et al. Deconstructing adipogenesis induced by β3-adrenergic receptor activation with single-cell expression profiling. Cell Metab. 28, 300–309.e (2018).
Merrick, D. et al. Identification of a mesenchymal progenitor cell hierarchy in adipose tissue. Science 364, eaav2501 (2019).
Marcelin, G., Silveira, A. L. M., Martins, L. B., Ferreira, A. V. & Clément, K. Deciphering the cellular interplays underlying obesity-induced adipose tissue fibrosis. J. Clin. Invest. 129, 4032–4040 (2019).
Berry, D. C., Jiang, Y. & Graff, J. M. Mouse strains to study cold-inducible beige progenitors and beige adipocyte formation and function. Nat. Commun. 7, 10184 (2016).
Oguri, Y. et al. CD81 controls beige fat progenitor cell growth and energy balance via FAK signaling. Cell 182, 563–577.e20 (2020).
Lee, Y. H., Petkova, A. P., Mottillo, E. P. & Granneman, J. G. In vivo identification of bipotential adipocyte progenitors recruited by β3-adrenoceptor activation and high-fat feeding. Cell Metab. 15, 480–491 (2012).
Zimmermann, R. et al. Fat mobilization in adipose tissue is promoted by adipose triglyceride lipase. Science 306, 1383–1386 (2004).
Morak, M. et al. Adipose triglyceride lipase (ATGL) and hormone-sensitive lipase (HSL) deficiencies affect expression of lipolytic activities in mouse adipose tissues. Mol. Cell Proteom. 11, 1777–1789 (2012).
Coman, D., Trubel, H. K. & Hyder, F. Brain temperature by biosensor imaging of redundant deviation in shifts (BIRDS): comparison between TmDOTP5- and TmDOTMA-. NMR Biomed. 23, 277–285 (2010).
Kliewer, S. A. & Mangelsdorf, D. J. A dozen years of discovery: insights into the physiology and pharmacology of FGF21. Cell Metab. 29, 246–253 (2019).
Hill, C. M. et al. FGF21 is required for protein restriction to extend lifespan and improve metabolic health in male mice. Nat. Commun. 13, 1897 (2022).
Patel, S. et al. GDF15 provides an endocrine signal of nutritional stress in mice and humans. Cell Metab. 29, 707–718.e8 (2019).
Warrier, M. et al. Homocysteine-induced endoplasmic reticulum stress activates FGF21 and is associated with browning and atrophy of white adipose tissue in Bhmt knockout mice. Heliyon 9, e13216 (2023).
Nicholls, D. G. Mitochondrial proton leaks and uncoupling proteins. Biochim. Biophys. Acta Bioenerg. 1862, 148428 (2021).
Kozak, L. P. & Harper, M. E. Mitochondrial uncoupling proteins in energy expenditure. Annu. Rev. Nutr. 20, 339–363 (2000).
Ukropec, J., Anunciado, R. P., Ravussin, Y., Hulver, M. W. & Kozak, L. P. UCP1 independent thermogenesis in white adipose tissue of cold-acclimated Ucp1-/- mice. J. Biol. Chem. 281, 31894–31908 (2006).
Kazak, L. et al. A creatine-driven substrate cycle enhances energy expenditure and thermogenesis in beige fat. Cell 163, 643–655 (2015).
Ikeda, K. et al. UCP1-independent signaling involving SERCA2b-mediated calcium cycling regulates beige fat thermogenesis and systemic glucose homeostasis. Nat. Med 23, 1454–1465 (2017).
Bal, N. C. et al. Sarcolipin is a newly identified regulator of muscle-based thermogenesis in mammals. Nat. Med. 18, 1575–1579 (2012).
Oeckl, J. et al. Loss of UCP1 function augments recruitment of futile lipid cycling for thermogenesis in murine brown fat. Mol. Metab. 61, 101499 (2022).
Renier, N. et al. iDISCO: a simple, rapid method to immunolabel large tissue samples for volume imaging. Cell 159, 896–910 (2014).
Renier, N. et al. Mapping of brain activity by automated volume analysis of immediate early genes. Cell 165, 1789–1802 (2016).
Nakamura, K. & Morrison, S. F. A thermosensory pathway that controls body temperature. Nat. Neurosci. 11, 62–71 (2008).
Tan, C. L. et al. Warm-sensitive neurons that control body temperature. Cell 167, 47–59.e15 (2016).
Tan, C. L. & Knight, Z. A. Regulation of body temperature by the nervous system. Neuron 98, 31–48 (2018).
Crestani, C. C. et al. Mechanisms in the bed nucleus of the stria terminalis involved in control of autonomic and neuroendocrine functions: a review. Curr. Neuropharmacol. 11, 141–159 (2013).
Zhao, Z. D. et al. A hypothalamic circuit that controls body temperature. Proc. Natl Acad. Sci. USA 114, 2042–2047 (2017).
Schneeberger, M. et al. Regulation of energy expenditure by brainstem GABA neurons. Cell 178, 672–685.e12 (2019).
Bartness, T. J. & Bamshad, M. Innervation of mammalian white adipose tissue: implications for the regulation of total body fat. Am. J. Physiol. 275, R1399–R1411 (1998).
Lee, A. H. & Dixit, V. D. Dietary regulation of immunity. Immunity 53, 510–523 (2020).
Fabbiano, S. et al. Caloric restriction leads to browning of white adipose tissue through type 2 immune signaling. Cell Metab. 24, 434–446 (2016).
Barquissau, V. et al. Caloric restriction and diet-induced weight loss do not induce browning of human subcutaneous white adipose tissue in women and men with obesity. Cell Rep. 22, 1079–1089 (2018).
Conti, B. et al. Transgenic mice with a reduced core body temperature have an increased life span. Science 314, 825–828 (2006).
Yang, G. et al. H2S as a physiologic vasorelaxant: hypertension in mice with deletion of cystathionine γ-lyase. Science 322, 587–590 (2008).
Paul, B. D. et al. Cystathionine γ-lyase deficiency mediates neurodegeneration in Huntington’s disease. Nature 509, 96–100 (2014).
Varghese, A. et al. Unravelling cysteine-deficiency-associated rapid weight loss. Nature https://doi.org/10.1038/s41586-025-08996-y (2025).
Richie, J. P. Jr et al. Dietary methionine and total sulfur amino acid restriction in healthy adults. J. Nutr. Health Aging 27, 111–123 (2023).
Rochon, J. et al. Design and conduct of the CALERIE study: comprehensive assessment of the long-term effects of reducing intake of energy. J. Gerontol. A https://doi.org/10.1093/gerona/glq168 (2011).
Trapnell, C. et al. The dynamics and regulators of cell fate decisions are revealed by pseudotemporal ordering of single cells. Nat. Biotechnol. 32, 381–386 (2014).
Schmidt, E. K., Clavarino, G., Ceppi, M. & Pierre, P. SUnSET, a nonradioactive method to monitor protein synthesis. Nat. Methods 6, 275–277 (2009).
Nakai, K., Kadiiska, M. B., Jiang, J. J., Stadler, K. & Mason, R. P. Free radical production requires both inducible nitric oxide synthase and xanthine oxidase in LPS-treated skin. Proc. Natl Acad. Sci. USA 103, 4616–4621 (2006).
Acknowledgements
We thank all investigators and staff involved in coordinating and executing CALERIE-II clinical trial and Yale comparative medicine pathology core led by C. Booth for support with autopsies and histology. We also thank University of Texas Southwestern Medical Center (UTSW), Dallas Metabolic Core facility (supported by National Institute of Diabetes and Digestive and Kidney diseases (NIDDK) P30DK127984–National Institutes of Health (NIH) NORC programme) for bomb calorimetry analysis.K.S. was supported by DK R01-137472. A.L. is a recipient of a Gruber and National Science Foundation (NSF) fellowship. M.S. acknowledges the support of the McCluskey family and the Interstellar Initiative (NYAS/AMED) and the NIDDK R00DK1208689 and P30DK045735 grants, the NIH Yale-Murine Tissue Mapping Center Grant U54 AG079759 and the NIH National Institutes of Aging Grant P30AG066508. The research in the Dixit Laboratory was supported in part by NIH grants AG031797, AG073969, AG068863 and P01AG051459. Schematics were created using BioRender.com.
Ethics declarations
Competing interests
The authors declare no competing interests.
Peer review
Peer review information
Nature Metabolism thanks the anonymous reviewers for their contribution to the peer review of this work. Primary Handling Editor: Revati Dewal, in collaboration with the Nature Metabolism team. This manuscript has been originally submitted and reviewed at another Springer Nature journal.
Additional information
Publisher’s note Springer Nature remains neutral with regard to jurisdictional claims in published maps and institutional affiliations.
Extended data
Extended Data Fig. 1 Cysteine depletion induces weight-loss in mice without overt pathology.
a) Cystathionine and homocysteine measurements by MS/MS in human SFAT at baseline (B) and after 12 months of caloric restriction (n = 14). AU: arbitrary units. b) Schematic of Cth−/− and Cthfl/fl mice generation (KOMP construct) used to cross to either Alb:cre or Adipoq:cre. c) Body weight of Cth+/+ and Cth−/− mice fed with CTRL or CysF diet for 6 days (n = 5 Cth+/+ CTRL, n = 6 Cth+/+ CysF, n = 4 Cth−/− CTRL, n = 5 Cth−/− CysF). d) Fat mass and lean mass measured by EchoMRI of male Cth+/+ and Cth−/− after 6 days of CTRL or CysF diet (n = 5 Cth+/+ CTRL, n = 12 Cth+/+ CysF, n = 8 Cth−/− CTRL, n = 17 Cth−/− CysF). e) Cth+/+ and Cth−/− mice were fed ad libitum (ad lib) or pair fed CTRL or CysF diet (n = 4 Cth+/+CysF ad lib, n = 5 Cth+/+CysF pair fed, n = 7 Cth−/−CTRL pair fed, n = 5 Cth−/− CysF pair fed). Percentage body weight change over 6 days of diet. f) Accumulated food intake of Cth+/+ and Cth−/− mice over 6 days of CysF feeding measured in metabolic cages (n = 10 Cth+/+ and n = 12 Cth−/−). Cage image and video show that Cth−/− mice on CysF diet at day 5 have normal activity. g) Qualitative assessment of nest building (score from 0 to 4) and presence (score=1) or absence (score=0) of kyphosis in WT and Cth−/− mice (n = 12/group). h) Gait assessment, ledge test and hindlimb clasping test were performed to measure motor coordination in WT and Cth−/− mice. Mice were scored from 0 (normal behaviour) to 1 (abnormal behaviour) (n = 12/group). i) Representative H&E-stained sections of kidney, lung, heart, and liver from female Cth−/− mice fed control diet or cystine-deficient diet for 6 days, lack notable pathologic changes and do not differ in microscopic changes by diet in the tissues examined. C = renal cortex, M = renal medulla A = airway, P = pulmonary artery, > = central vein, and * = portal triad. Kidney scale bars=200 μm, lung, heart, liver scale bars= 100μm. Data are expressed as mean±SEM. Statistical differences were calculated by 2-way ANOVA with Sidak’s correction for multiple comparisons, or by unpaired two-tailed t-tests. Panel b created with BioRender.com.
Extended Data Fig. 2 Cysteine depletion triggers metabolic rewiring without altering protein synthesis and iron-sulfur cluster maintenance.
a, b) Volcano plot of a) serum and b) subcutaneous adipose tissue (SFAT) metabolites identified by LC-MS/MS in Cth−/− mice after 6 days of CTRL or CysF diet (n = 4 CTRL and n = 5 CysF for serum, n = 6/group for SFAT). Transsulfuration pathway related metabolites are highlighted in red. Significantly increased or decreased metabolites (-log10(pvalue)>1.3 and ∣log2(FC)∣>1) are highlighted in blue and listed on the right. Cys: cysteine. Met: methionine. SAH: S-adenosyl homocysteine. SAM: S-adenosyl methionine. Cysteine and cysteine were not detectable in SFAT samples. See Supplementary Table 1 and 2 for the full list of metabolites. c) Serum L-methionine, L-homocysteine, glutamic acid quantified by mass spectrometry in Cth−/− mice fed with CTRL (n = 4) or CysF (n = 5) diet for 6 days. AU: arbitrary units. d) Total GSSG content in SFAT, brown adipose tissue (BAT) and liver samples of Cth−/− mice fed CTRL or CysF diet for 5 days, determined by colorimetric assay (n = 7/group). e) Surface sensing of translation (SUnSET) assay was performed to assess protein synthesis. Immunoblot detection of puromycin incorporation in neosynthesized proteins in SFAT, visceral adipose tissue (VFAT), BAT and liver samples of Cth−/− mice fed with CTRL or CysF diet for 5 days (n = 6/group). f) Heatmaps of RNA-seq based gene expression of genes involved in Fe-S cluster assembly in SFAT, VFAT and BAT of Cth+/+ and Cth−/− mice, fed with CTRL or CysF diet (n = 4/group). g) Representative EPR spectra of POBN-lipid radical adducts measured in Folch extracts of SFAT, VFAT and BAT tissues of Cth−/− mice fed with either CTRL or CysF diet. The six-line spectrum (red arrows) is consistent with carbon-centred lipid-derived radicals, indicative of lipid peroxidation (identified through hyperfine coupling constants aN = 15.75 ± 0.06 G and aβH = 2.77 ± 0.07 G). Data are expressed as mean±SEM. Box plots represent median value and extend to the 25th and 75th percentiles. Whiskers are plotted down to the minimum and up to the maximum value. Statistical differences were calculated by 2-way ANOVA with Sidak’s correction for multiple comparisons, or by unpaired two-tailed t-tests.
Extended Data Fig. 3 Cysteine starvation induces thermogenic reprogramming of adipose tissue transcriptome.
a) Representative subcutaneous (SFAT), visceral (VFAT), and brown adipose depots (BAT), indicated with white arrows, of Cth+/+ and Cth−/− after 6 days of CysF diet. b) Representative H&E-stained sections of VFAT of Cth−/− mice fed CTRL or CysF diet for 6 days or after Cys supplementation following CysF weight loss (scale bar=100 μm). c) Serum glycerol levels of Cth−/− mice fed with CTRL (n = 20) or CysF (n = 8) or switched to Cys-containing diet after CysF feeding (n = 10). d) Ucp1, Cidea and Pparg gene expression in Cth−/− pre-adipocytes differentiated in vitro and treated with increasing concentration of Cysteine for 48 h (n = 6/condition). e) Cumulative food intake during the initial two days of CysF feeding in Cth+/+ and Cth−/− mice (n = 10 Cth+/+ and n = 12 Cth−/−). f–j) Cth+/+ and Cth−/− mice were fed with CysF diet for 6 days and housed in metabolic cages (n = 10 Cth+/+ and n = 12 Cth−/−). f) Energy expenditure during CysF feeding. g) Linear regression analysis of unnormalized average energy expenditure measured by indirect calorimetry against body mass on days 4 and 5 of CysF diet. h) Locomotor activity. i) Respiratory exchange ratio (RER) and j) area under the curve (AUC) quantified for RER. k, l) Whole tissue RNA-seq of SFAT, VFAT, and BAT of Cth+/+ and Cth−/− fed 6 days of CTRL or CysF diet (n = 4/group). k) Heat map highlighting changes specifically occurring in cysteine deficiency. l) Selected top pathways being up- and down-regulated in Cth−/− CysF vs CTRL in SFAT after gene set enrichment analysis. m) Gene expression of selected thermogenesis markers confirmed by qPCR in SFAT, in Cth+/+ and Cth−/− mice fed with CysF diet (n = 8 Cth+/+ and n = 10 Cth−/−). Data are expressed as mean±SEM. Statistical differences were calculated by one-way ANOVA, or by 2-way ANOVA with Sidak’s correction for multiple comparisons, or by unpaired two-tailed t-tests.
Extended Data Fig. 4 Impact of cysteine depletion on transcriptional regulation of adipose tissue at single cell resolution.
a) Experimental design schematic of cell processing of subcutaneous adipose depot (SFAT) stromal vascular fraction (SVF) for scRNA-seq. b) t-SNE plot of scRNAseq from SFAT stromal vascular fraction with c) cluster identities. APCs: antigen presenting cells. ASCs: adipose-derived stromal cells. d) Heat map of normalized gene expression of selected markers to identify major cell lineages. e) Enrichment of CL-316,243 activated gene signature overlaid on all populations in all samples. f) t-SNE plots displaying Dpp4, Cd9, Icam1, Col5a3, F3, and Tagln expression in red across all populations in Cth−/− CTRL and Cth−/− CysF samples. g) Volcano plot of differentially expressed genes comparing Cth−/− CysF and Cth+/+ CysF in cluster 1. h) Orthogonal validation of adipocyte progenitor changes using FACS analysis of SFAT SVF in Cth+/+ and Cth−/− mice on CTRL and CysF diet for 4 days (n = 6 Cth+/+ CTRL and CysF, n = 5 Cth−/− CTRL and CysF). i) Selected top pathways from gene set enrichment comparing Cth−/− CysF vs. Cth+/+ CysF in cluster 1. j) Heatmap of gene expression of select stem and mature adipocyte genes in clusters 0, 1 and 2 showing the impact of cysteine depletion in mice. Data are expressed as mean±SEM. Statistical differences were calculated by 2-way ANOVA with Sidak’s correction for multiple comparisons, and by unpaired two-tailed t-tests. Panel a created with BioRender.com.
Extended Data Fig. 5 Cysteine-depletion mobilizes lipids for thermogenic response independently of thermoneutrality.
a) Quantification of ATGL immunoblot shown in Fig. 3a, Actin was used as a loading control. b, c) Tissue lipidomics of brown adipose depot (BAT) from Cth−/− mice fed CTRL (n = 4) or CysF diet (n = 5) for 6 days with b) triglycerides (TG) and c) diacylglycerol species highlighted. AU: arbitrary units. d) Core body temperature (CBT) measured in the peritoneal cavity by implantation of Star-Oddi logger of Cth−/− mice fed with CTRL or CysF diet over 6 days and e) average day and night CBT of Cth−/− mice fed with CTRL or CysF diet. Recordings were taken every 30 min (n = 11 Cth−/− CTRL, n = 12 Cth−/− CysF, 3 independent experiments pooled). f) Fgf21 gene expression in the liver of Cth+/+ and Cth−/− mice fed CTRL or CysF diet for 6 days (n = 8 Cth+/+ CTRL, n = 10 Cth+/+ CysF, n = 8 Cth−/− CTRL, n = 12 Cth−/− CysF). g, h) Serum levels of g) FGF21 and h) GDF15 in Cth−/− and Cth−/−CHOP−/− mice after 5 days of CysF feeding, measured by ELISA (n = 9 Cth−/− and n = 7 Cth−/−CHOP−/−). i) SFAT, VFAT and BAT weight normalized to body weight of Cth−/− and Fgf21−/−Cth−/− mice after CysF feeding (n = 5/group). j) Respiratory exchange ratio (RER) of Cth−/− and Fgf21−/−Cth−/− mice upon CysF feeding, measured at day 3 and 4 in metabolic cages (n = 5/group). k) Ucp1 gene expression in SFAT of Cth−/− and Fgf21−/−Cth−/− mice after 6 days of CysF feeding (n = 11 Cth−/− and n = 12 Fgf21−/−Cth−/−). l) Representative H&E histology images of SFAT showing increased browning at day 6 in Cth+/+ and Cth−/− mice fed CysF diet and housed at 20 °C or at 30 °C. m) Ucp1 gene expression measured by qPCR in BAT of Cth+/+ and Cth−/− mice fed CysF diet and housed at 20 °C or at 30 °C for 6 days (n = 3 Cth+/+20 C, n = 4 Cth+/+30 C and Cth−/−20C, n = 5 Cth−/−30C). Data are expressed as mean±SEM. Box plots represent median value and extend to the 25th and 75th percentiles. Whiskers are plotted down to the minimum and up to the maximum value. Statistical differences were calculated by 2-way ANOVA with Sidak’s correction for multiple comparisons, and by unpaired two-tailed t-tests.
Extended Data Fig. 6 Systemic cysteine depletion-induced weight-loss is independent of microbiota and canonical thermogenic pathways.
a) Immunoblot analysis of CTH in liver, kidney, subcutaneous (SFAT), visceral (VFAT), brown (BAT) adipose depots, lung, heart, spleen, and thymus. b) Immunoblot analysis of CTH in kidney samples from male and female Cthf/f;Alb-Cre- and Cthf/f;Alb-Cre+ mice and in liver samples from male and female Cthf/f;Adipoq-Cre- and Cthf/f;Adipoq-Cre+ mice. Actin is used as a loading control. c, d) Cysteine serum levels of c) Cthf/f and Alb-Cre;Cthf/f mice (n = 4 Cthf/f CysF, n = 5 Cthf/f CTRL, Alb-Cre;Cthf/f CTRL and CysF) and d) Cthf/f and Adipoq-Cre;Cthf/f (n = 4 Cthf/f CTRL and CysF, Adipoq-Cre;Cthf/f CTRL and n = 5 Adipoq-Cre;Cthf/f CysF) mice after 6 days of CTRL or CysF diet. e–i) Alb-Cre;Cthf/f mice were fed CTRL or CysF diet for 6 days. Schematic summary of changes in the metabolites in the e) serum and in the f) liver. g) Volcano plot of metabolites identified by MS/MS in the liver. h) Schematic summary of changes in the metabolites and i) volcano plot of metabolites identified by MS/MS in the SFAT. Transsulfuration pathway related metabolites are highlighted in red. Significantly increased or decreased metabolites (-log10(pvalue)>1.3 and ∣log2(FC)∣>1) are highlighted in blue and listed on the right. Cys: cysteine. Homocys: homocysteine. Met: methionine. SAM: S-adenosyl methionine. SAH: S-adenosyl homocysteine. j) Schematic summary of changes in serum metabolites of Adipoq-Cre;Cthf/f fed with CTRL or CysF diet for 6 days. Blue lines represent measured, but unchanged metabolites, red and green arrows indicate significantly decreased or increased metabolites, respectively (p < 0.05). See Supplementary Table 6 for the full list of metabolites. k) Percentage body weight change of Cth+/+ and Cth−/− mice that were co-housed and fed CysF diet for 6 days (n = 4/group). l) Accumulated food intake of Cth−/− and Cth−/− Ucp1−/− mice during 6 days of CysF diet (n = 7 Cth−/− and n = 8 Cth−/− Ucp1−/−). m, n) RNA-seq based expression of genes associated with m) futile creatine cycle (Slc6a8, Gatm, Gamt, Ckmt2, Alpl and Ckb) and n) futile calcium cycle (Atp2a2 and Ryr2) in the SFAT of Cth+/+ and Cth−/− mice fed CTRL or CysF diet for 6 days (n = 4/group). o) qPCR gene expression of Sarcolipin and Atp2a2 in the soleus of Cth+/+ and Cth−/− mice fed CTRL or CysF diet for 6 days (n = 3 Cth+/+CTRL, n = 6 Cth+/+CysF, n = 3 Cth+/+CTRL and n = 5 Cth+/+CysF). p) RNA-seq based expression of genes associated with triglyceride and fatty acid metabolism (Dgat1, Pnpla2, Lipe, Gk) in the SFAT of Cth+/+ and Cth−/− mice fed CTRL or CysF diet for 6 days (n = 4/group). q–r) Heatmaps of gene expression of genes involved in creatine, calcium and lipid futile cycles in q) BAT and r) SFAT of Cth−/− and Cth−/−Ucp1−/− mice fed a CysF diet for 6 days (n = 16 Cth−/−, n = 15 Cth−/− Ucp1−/−), quantified by qPCR. Data are expressed as mean±SEM. Box plots represent median value and extend to the 25th and 75th percentiles. Whiskers are plotted down to the minimum and up to the maximum value. Statistical differences were calculated by 2-way ANOVA with Sidak’s correction for multiple comparisons, and by unpaired two-tailed t-tests. Panels e, f, h and j created with BioRender.com.
Extended Data Fig. 7 Cysteine starvation induced browning requires adrenergic signalling and reverses high-fat diet induced obesity in mice.
a) Imaging mass spectrometry of noradrenaline in the BAT of Cth+/+ and Cth−/− fed 6 days of CTRL or CysF diet. b) qPCR gene expression of Comt in SFAT of Cth+/+ (n = 8) and Cth−/− (n = 10) mice fed with CysF diet for 6 days. c) Cumulative food intake during CysF feeding of Cth−/− treated with L748337, a β-3 adrenergic receptor antagonist or vehicle (PBS) for 5 days (n = 6 PBS and n = 4 L748337). d) Body composition measured by Echo-MRI on day 6 post diet switch (n = 6 Cth−/− HFD-CTRL and n = 4 Cth−/− HFD-CysF). e) The glucose tolerance test (GTT) in Cth−/− mice fed CTRL or cysF diet for 4 days (n = 5 CTRL and n = 6 CysF). Glucose dose was based on lean mass. f) Linear regression analysis of energy expenditure (EE) against body mass during dark cycle of Cth−/− mice fed with HFD-CTRL or HFD-CysF, average values of nights 4 and 5 of diet switch. Data are expressed as mean±SEM. Statistical differences were calculated by 2-way ANOVA with Sidak’s correction for multiple comparisons, and by unpaired two-tailed t-tests.
Supplementary information
Supplementary Video 1
Cth−/− display normal activity and behaviour.
Supplementary Tables 1–7
Table 1: metabolite list of Cth−/− serum. Table 2: metabolite list of Cth−/− SFAT. Table 3: metabolite list of Alb-Cre Cthf/f serum. Table 4: metabolite list of Alb-Cre Cthf/f serum. Table 5: metabolite list of Alb-Cre Cthf/f SFAT. Table 6: metabolite list of Adipo-Cre Cthf/f serum. Table 7: primer list.
Rights and permissions
Open Access This article is licensed under a Creative Commons Attribution-NonCommercial-NoDerivatives 4.0 International License, which permits any non-commercial use, sharing, distribution and reproduction in any medium or format, as long as you give appropriate credit to the original author(s) and the source, provide a link to the Creative Commons licence, and indicate if you modified the licensed material. You do not have permission under this licence to share adapted material derived from this article or parts of it. The images or other third party material in this article are included in the article’s Creative Commons licence, unless indicated otherwise in a credit line to the material. If material is not included in the article’s Creative Commons licence and your intended use is not permitted by statutory regulation or exceeds the permitted use, you will need to obtain permission directly from the copyright holder. To view a copy of this licence, visit http://creativecommons.org/licenses/by-nc-nd/4.0/.
About this article
Cite this article
Lee, A.H., Orliaguet, L., Youm, YH. et al. Cysteine depletion triggers adipose tissue thermogenesis and weight loss. Nat Metab (2025). https://doi.org/10.1038/s42255-025-01297-8
Received: 22 January 2025
Accepted: 09 April 2025
Published: 03 June 2025
DOI: https://doi.org/10.1038/s42255-025-01297-8

