.png)

Over the past year, On Data and Democracy has used data to cut through the political noise and illuminate the shifts reshaping the American political landscape. We’ve tracked the flow of money, the weaponization of institutions, and the behavior of voters to reveal a system under immense strain. This roundup gathers 29 data visualizations that tell a broader narrative about a democracy in the balance.
I’ve always used data to find a little clarity in all the political noise, but I usually kept the charts I made to myself or included them in lecture slides. In these tense, unsettling times, the best way I know how to respond is to map out what’s happening with clear, data-driven evidence. It’s my way of making sense of the forces shaping our country, glimpsing what might come next, and charting a path to somewhere better. The data may not always be pretty, but it is not without its bright spots.
It turns out that this little window I built to see things more clearly was a view many of you were looking for, too. It has been a true privilege to document these turbulent times with you. Thank you for looking through it with me.
A System Under Siege: The core institutions of American democracy, from federal agencies to the courts, are being systematically reshaped by ideological forces.
The Courts as a Battleground: The judiciary has become a primary arena for political conflict, with lower courts resisting executive actions while the Supreme Court increasingly intervenes on behalf of the administration.
Elite Control of Political Funding: A tiny group of mega-donors now provides the majority of all campaign funding, fundamentally altering political accountability.
The Generational Power Gap: Political power is heavily concentrated among older Americans, creating a disconnect between those making decisions and the younger generations who will live with the outcomes.
The Cost of Billionaire Power: The immense wealth of a small number of individuals and their tax avoidance strategies deprive public services of critical resources.
A Mobilization Crisis: The Democratic party’s primary challenge is not a need for ideological moderation but a struggle to mobilize millions of its own registered voters who are not turning out.
We Are Not Alone: Historical and global data show that the challenges facing American democracy are not unique, and they reveal proven strategies for democratic resilience and resistance.
A quick note: All of the data visualizations in this roundup are free to use as common content. You are welcome to share and republish them.
Let’s begin with data that reveals coordinated efforts to reshape American democracy’s core institutions. Federal agencies, law firms, and even the courts themselves have become targets in an ideological campaign.
When political norms erode and institutions are tested, the bedrock of democracy itself is exposed. The data reveals a system under coordinated assault: from the ideological purging of the civil service to a judiciary at war with itself. This is a story told through court rulings, executive orders, and budget choices—the paper trail of democratic decay.
The Trump administration’s approach to federal agencies and the private sector reveals a pattern of ideological targeting. These visualizations document systematic efforts to reshape institutions based on political alignment.
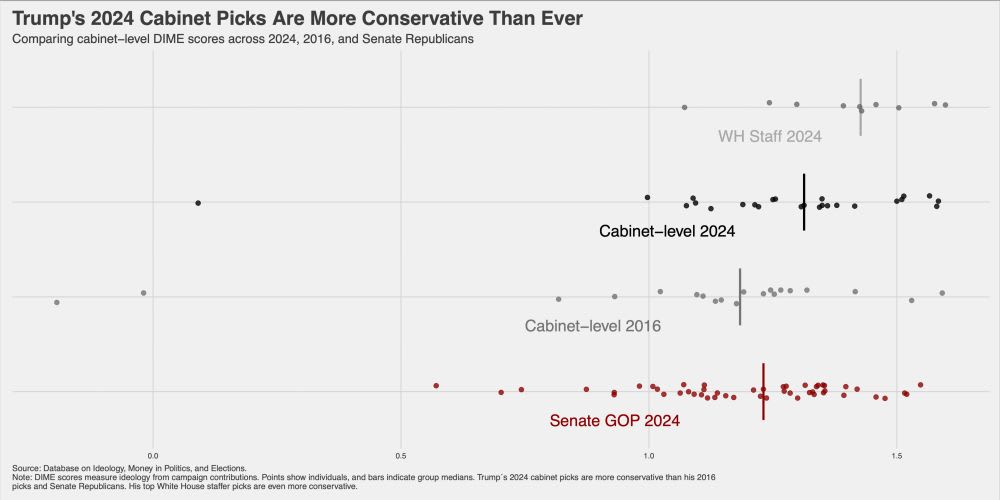
1. Ideologically Purity of Trump Administration Appointees
Takeaway: Trump’s 2024 White House staff and cabinet nominees have more conservative ideological scores than his 2016 appointments. These data ran counter to early media narratives that Trump’s incoming cabinet would be the most “ideologically diverse” in recent memory. (original source)
2. Federal Agency Layoffs and Budget Changes by Ideological Leaning
Takeaway: Layoffs under the DOGE initiative have disproportionately targeted agencies perceived as liberal, while 100% of proposed Republican budget increases went to conservative-leaning agencies. This pattern suggests the efficiency initiative functions more as ideological restructuring than genuine government reform, systematically weakening agencies that typically provide regulatory oversight and social services. (original source)

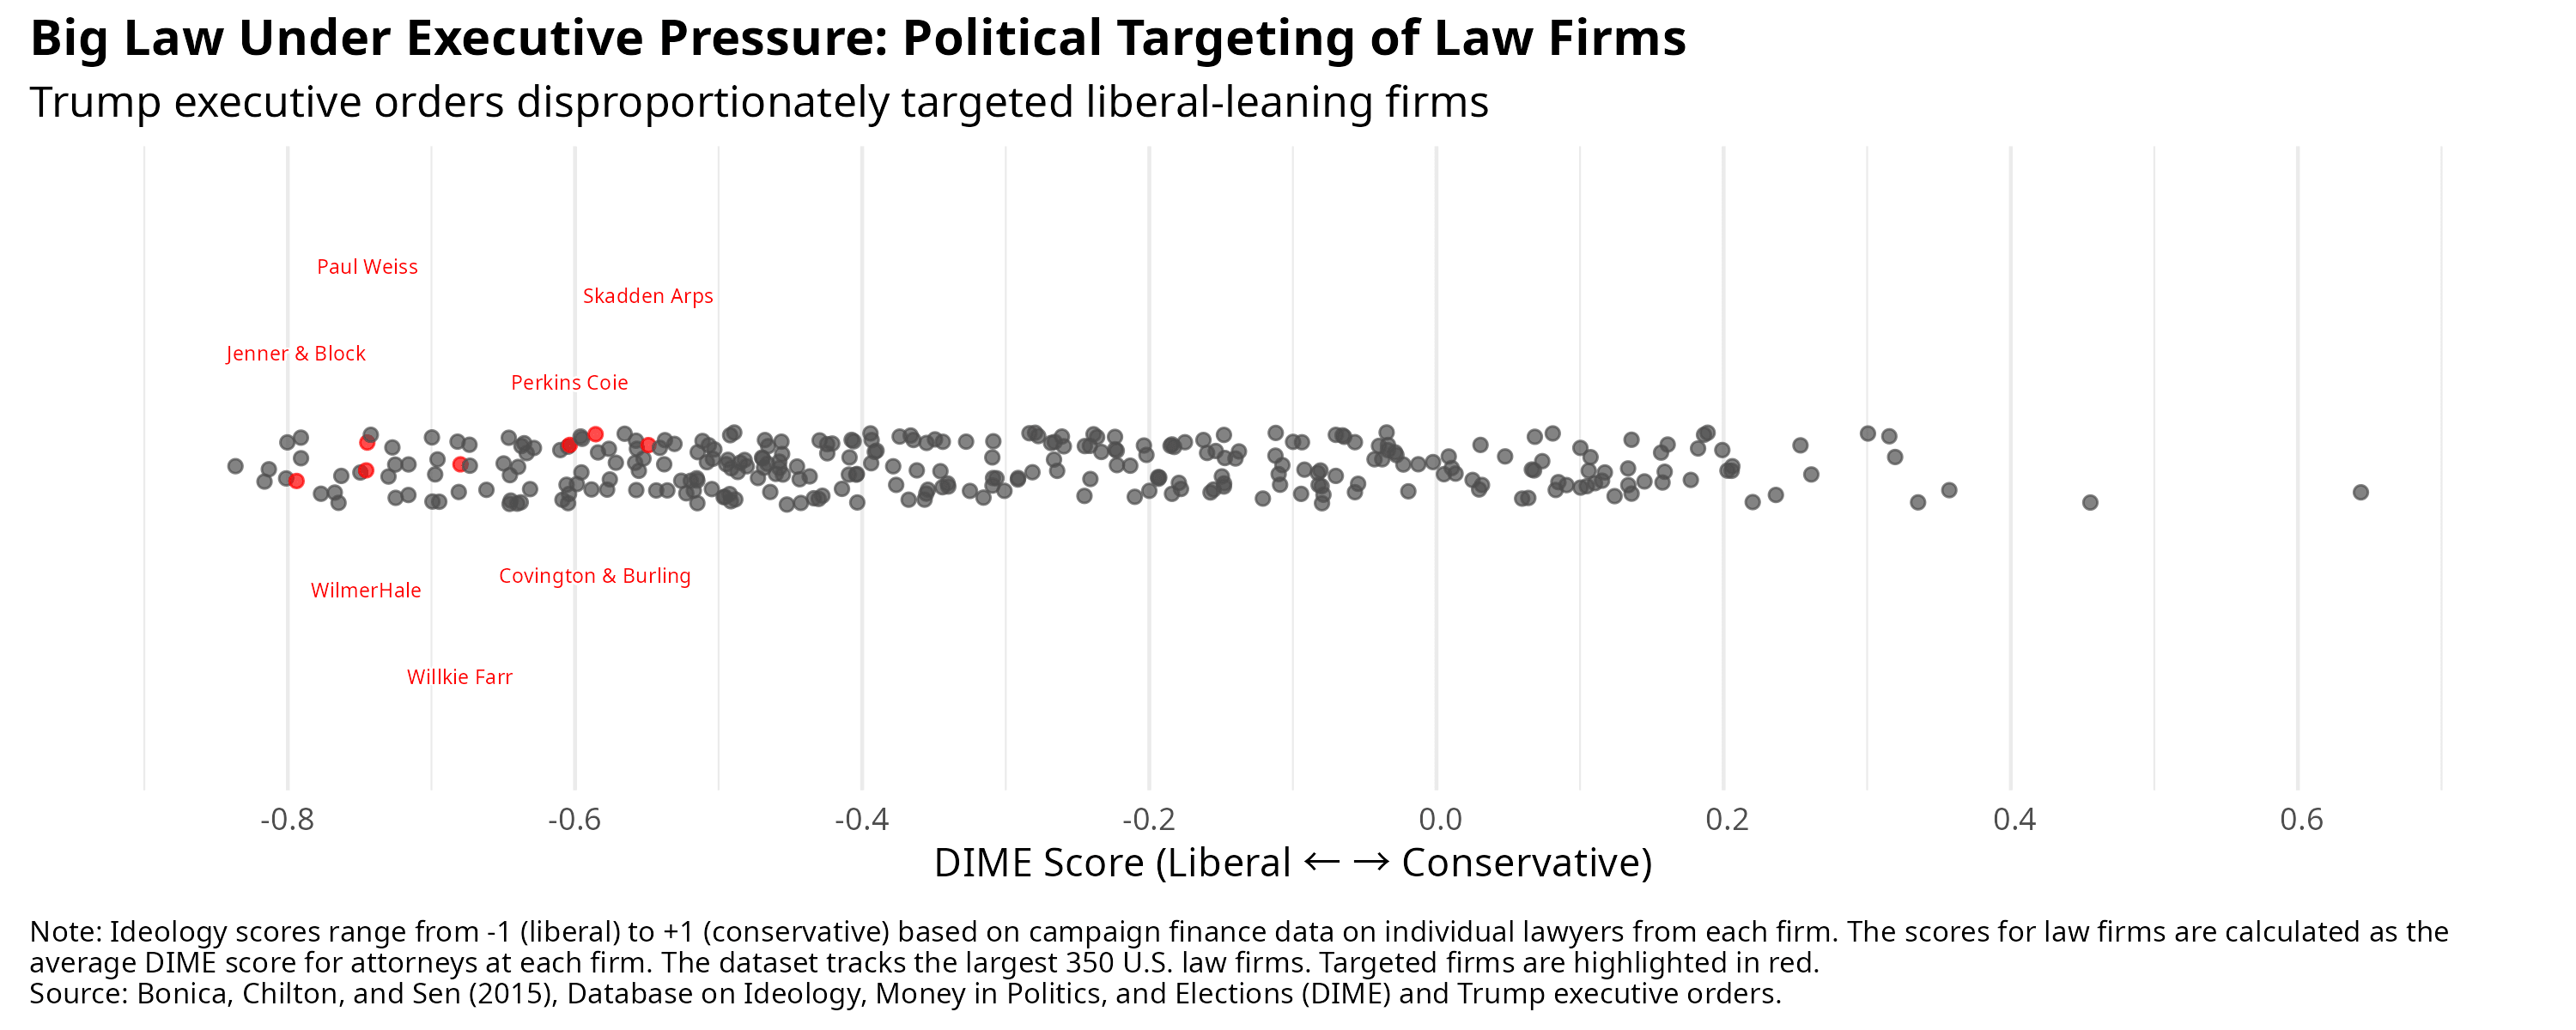
3. Law Firms Targeted by Executive Orders, by Political Leaning
Takeaway: Executive orders disproportionately targeted law firms whose attorneys donate to Democratic candidates, based on analysis of political contributions from the 350 largest U.S. law firms. (original source)
The federal judiciary has become a battleground where different levels of courts take dramatically different positions on administration policies. These visualizations reveal a judiciary in conflict with itself, where the traditional role of courts as a check on executive power faces systematic undermining from the Supreme Court, while also confronting a coordinated assault from the executive branch.
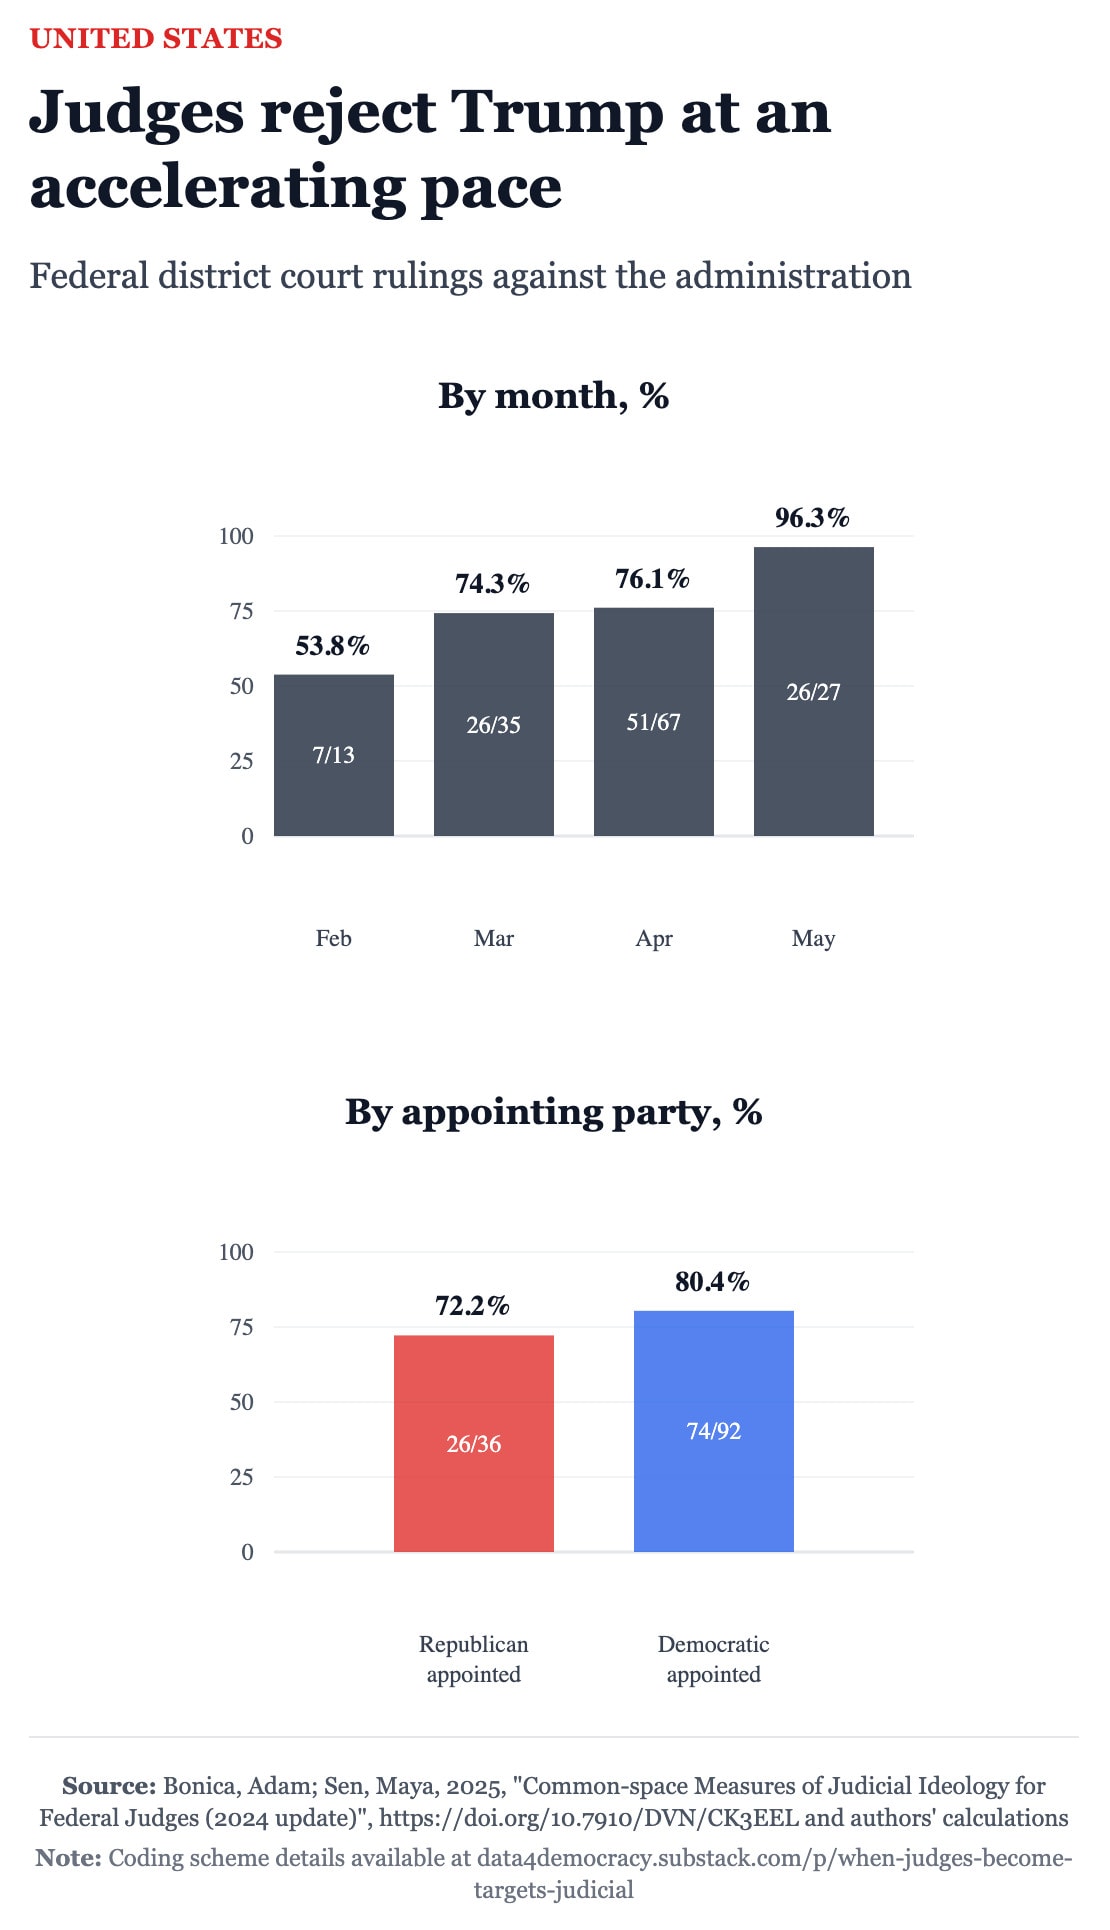
4. Federal District Court Rulings on Trump Policies, by Judge Ideology
Takeaway: Federal district courts have ruled against Trump administration policies at rates reaching 96% in May 2025, with resistance spanning the ideological spectrum. Even conservative Republican-appointed judges have joined this judicial rebellion, suggesting the administration's legal arguments are so weak and its overreach so plain that judges are choosing professional integrity over political alignment. (original source).
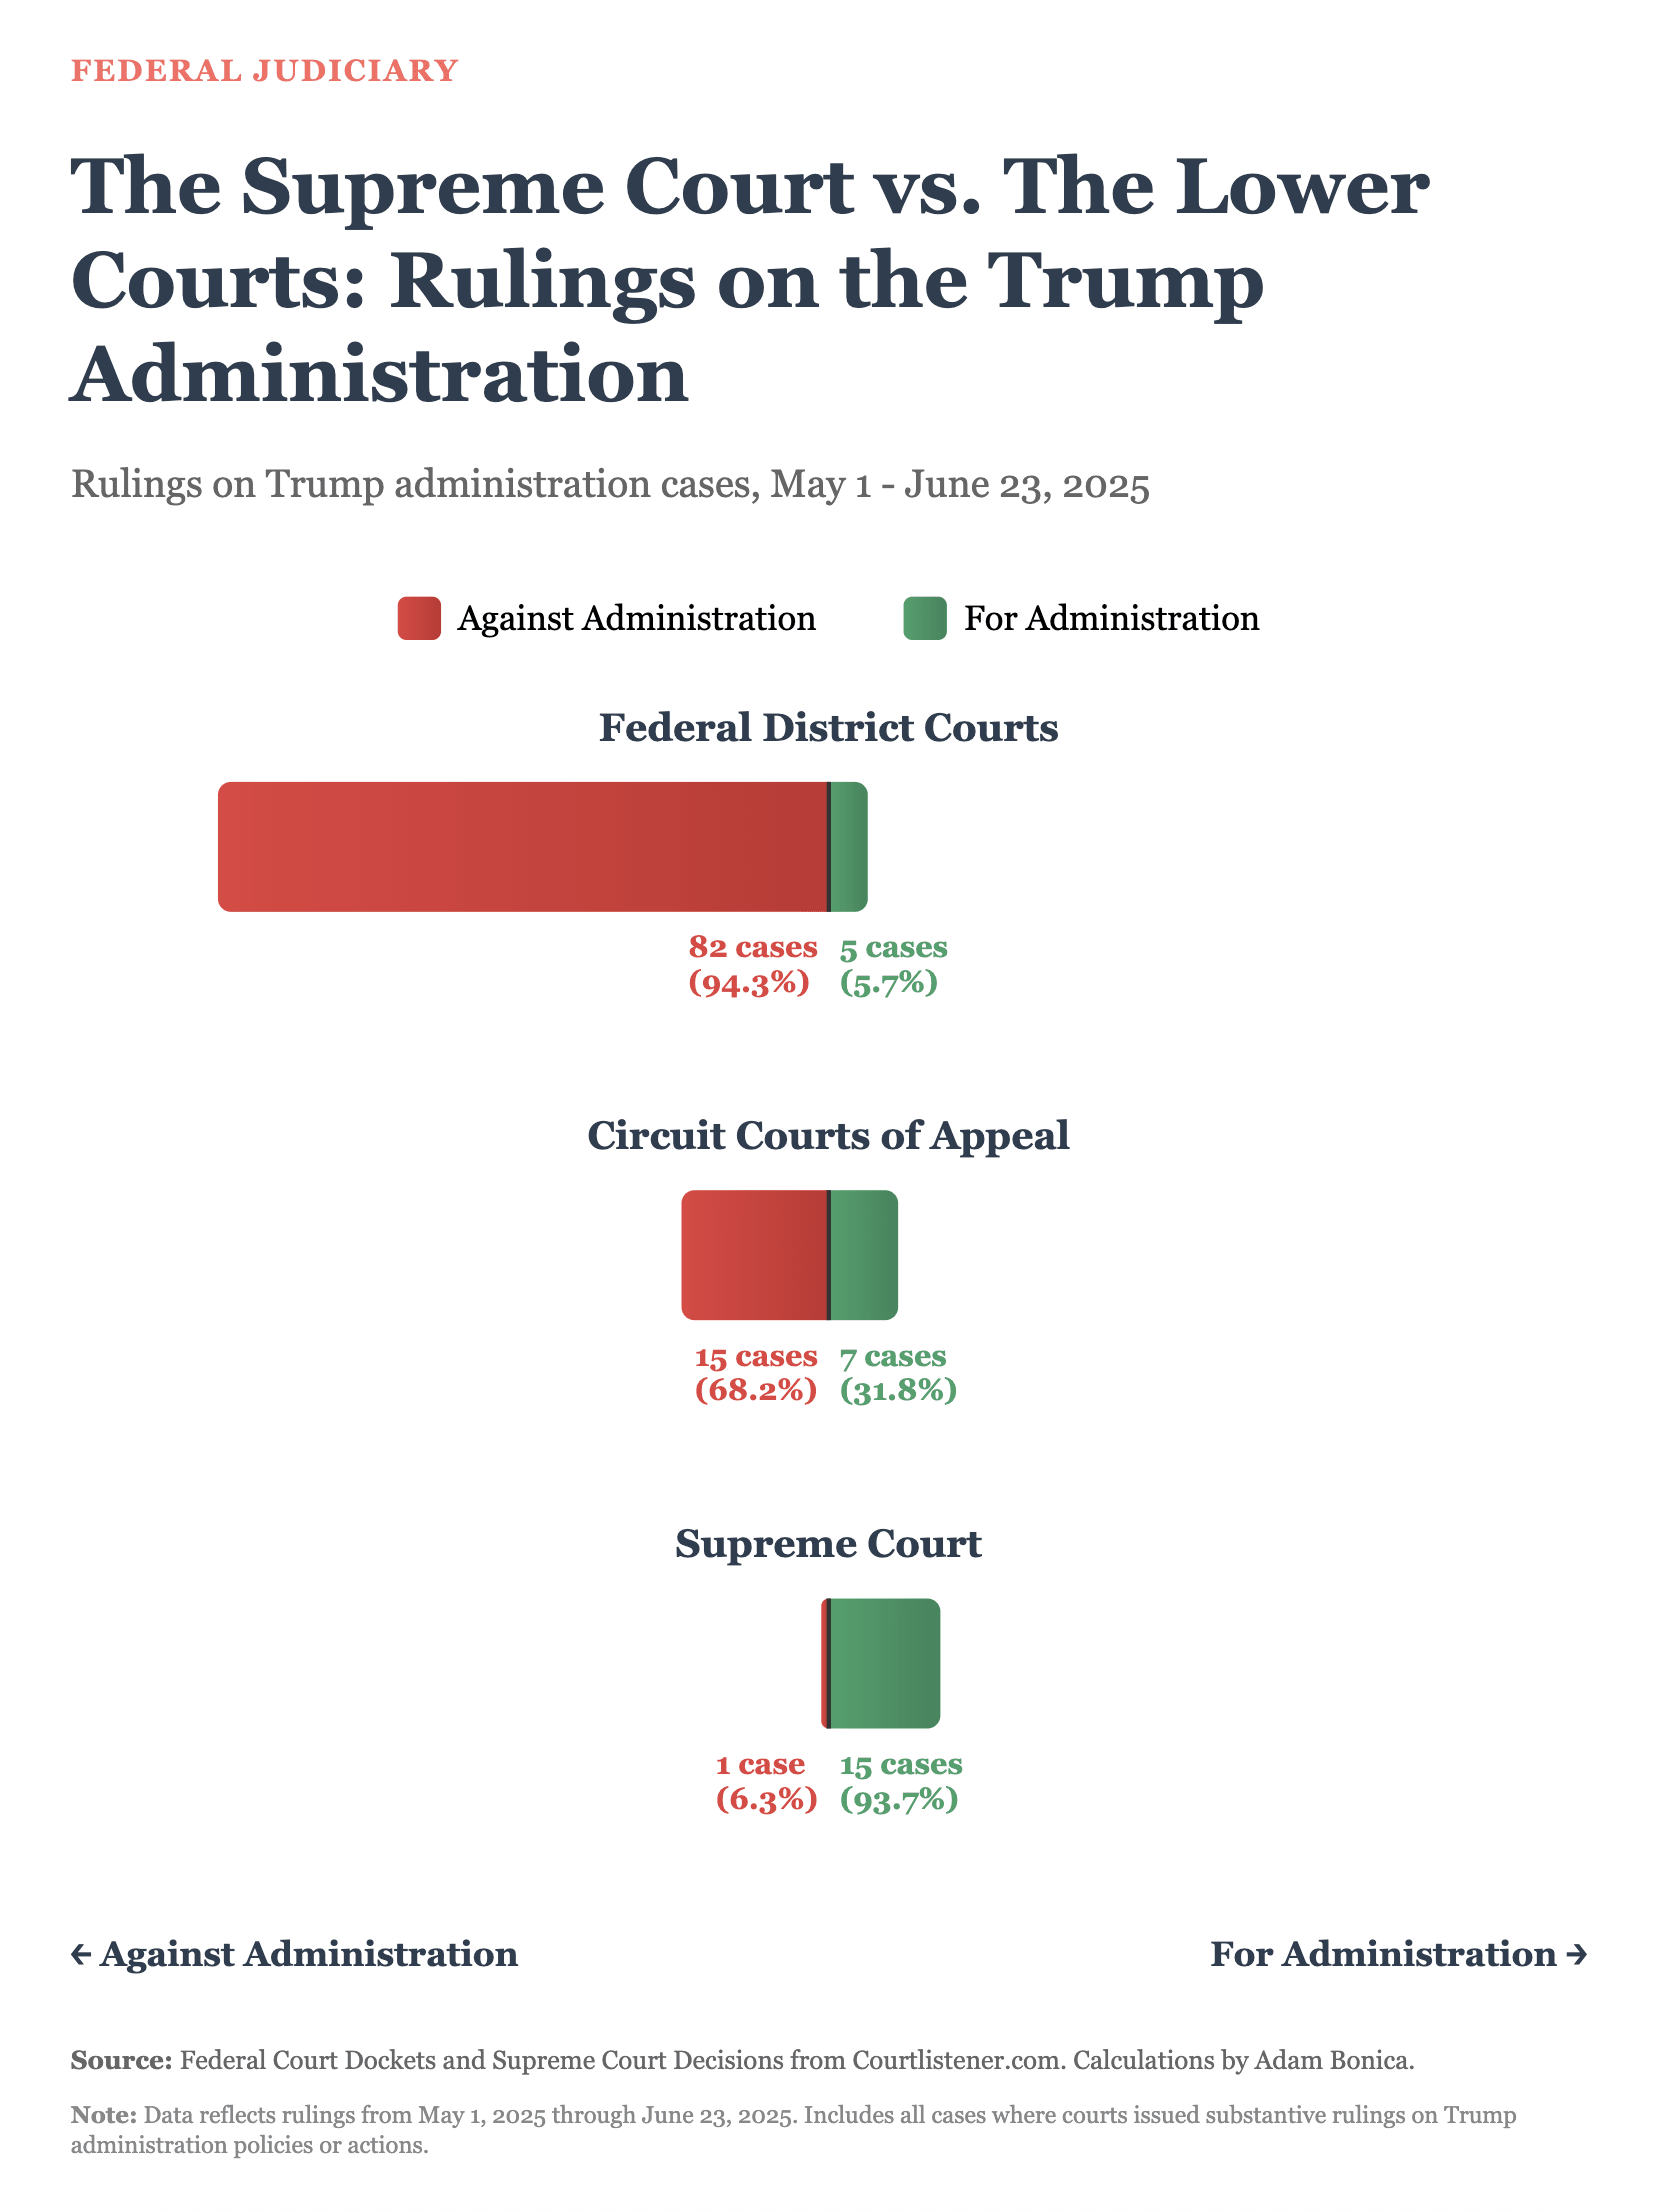
5. Court Rulings by Level: District vs. Circuit vs. Supreme Court
Takeaway: Lower courts ruled against Trump administration policies 94.3% of the time, while the Supreme Court ruled in favor 93.7% of the time during the same period. This near-perfect inversion suggests the Supreme Court is operating by different legal standards than the rest of the federal judiciary, potentially prioritizing political outcomes over consistent application of law. (original source)
6. Supreme Court Emergency Interventions by Administration
Takeaway: The Supreme Court lifted 77% of lower court injunctions against Trump administration policies through emergency orders, compared to 14% for Biden administration policies. This pattern exemplifies what scholars call "autocratic legalism"—the systematic weaponization of legal institutions to consolidate power while maintaining the appearance of legal process. (original source)

The concentration of political money has reached unprecedented levels, fundamentally reshaping American democracy. A handful of mega-donors now provides the majority of campaign funding, creating two different political parties with vastly different funding structures and accountability mechanisms.
7. Share of Campaign Contributions from Top 0.01% of Donors
Takeaway: The top 0.01% of donors (about 26,000 people) contributed over 50% of all federal campaign funds in 2024, up from under 10% in the 1980s. In a nation of 330 million, fewer people than would fill a small stadium now provide the majority of campaign funding, giving them vastly disproportionate influence over which candidates can run competitive campaigns. (original source)

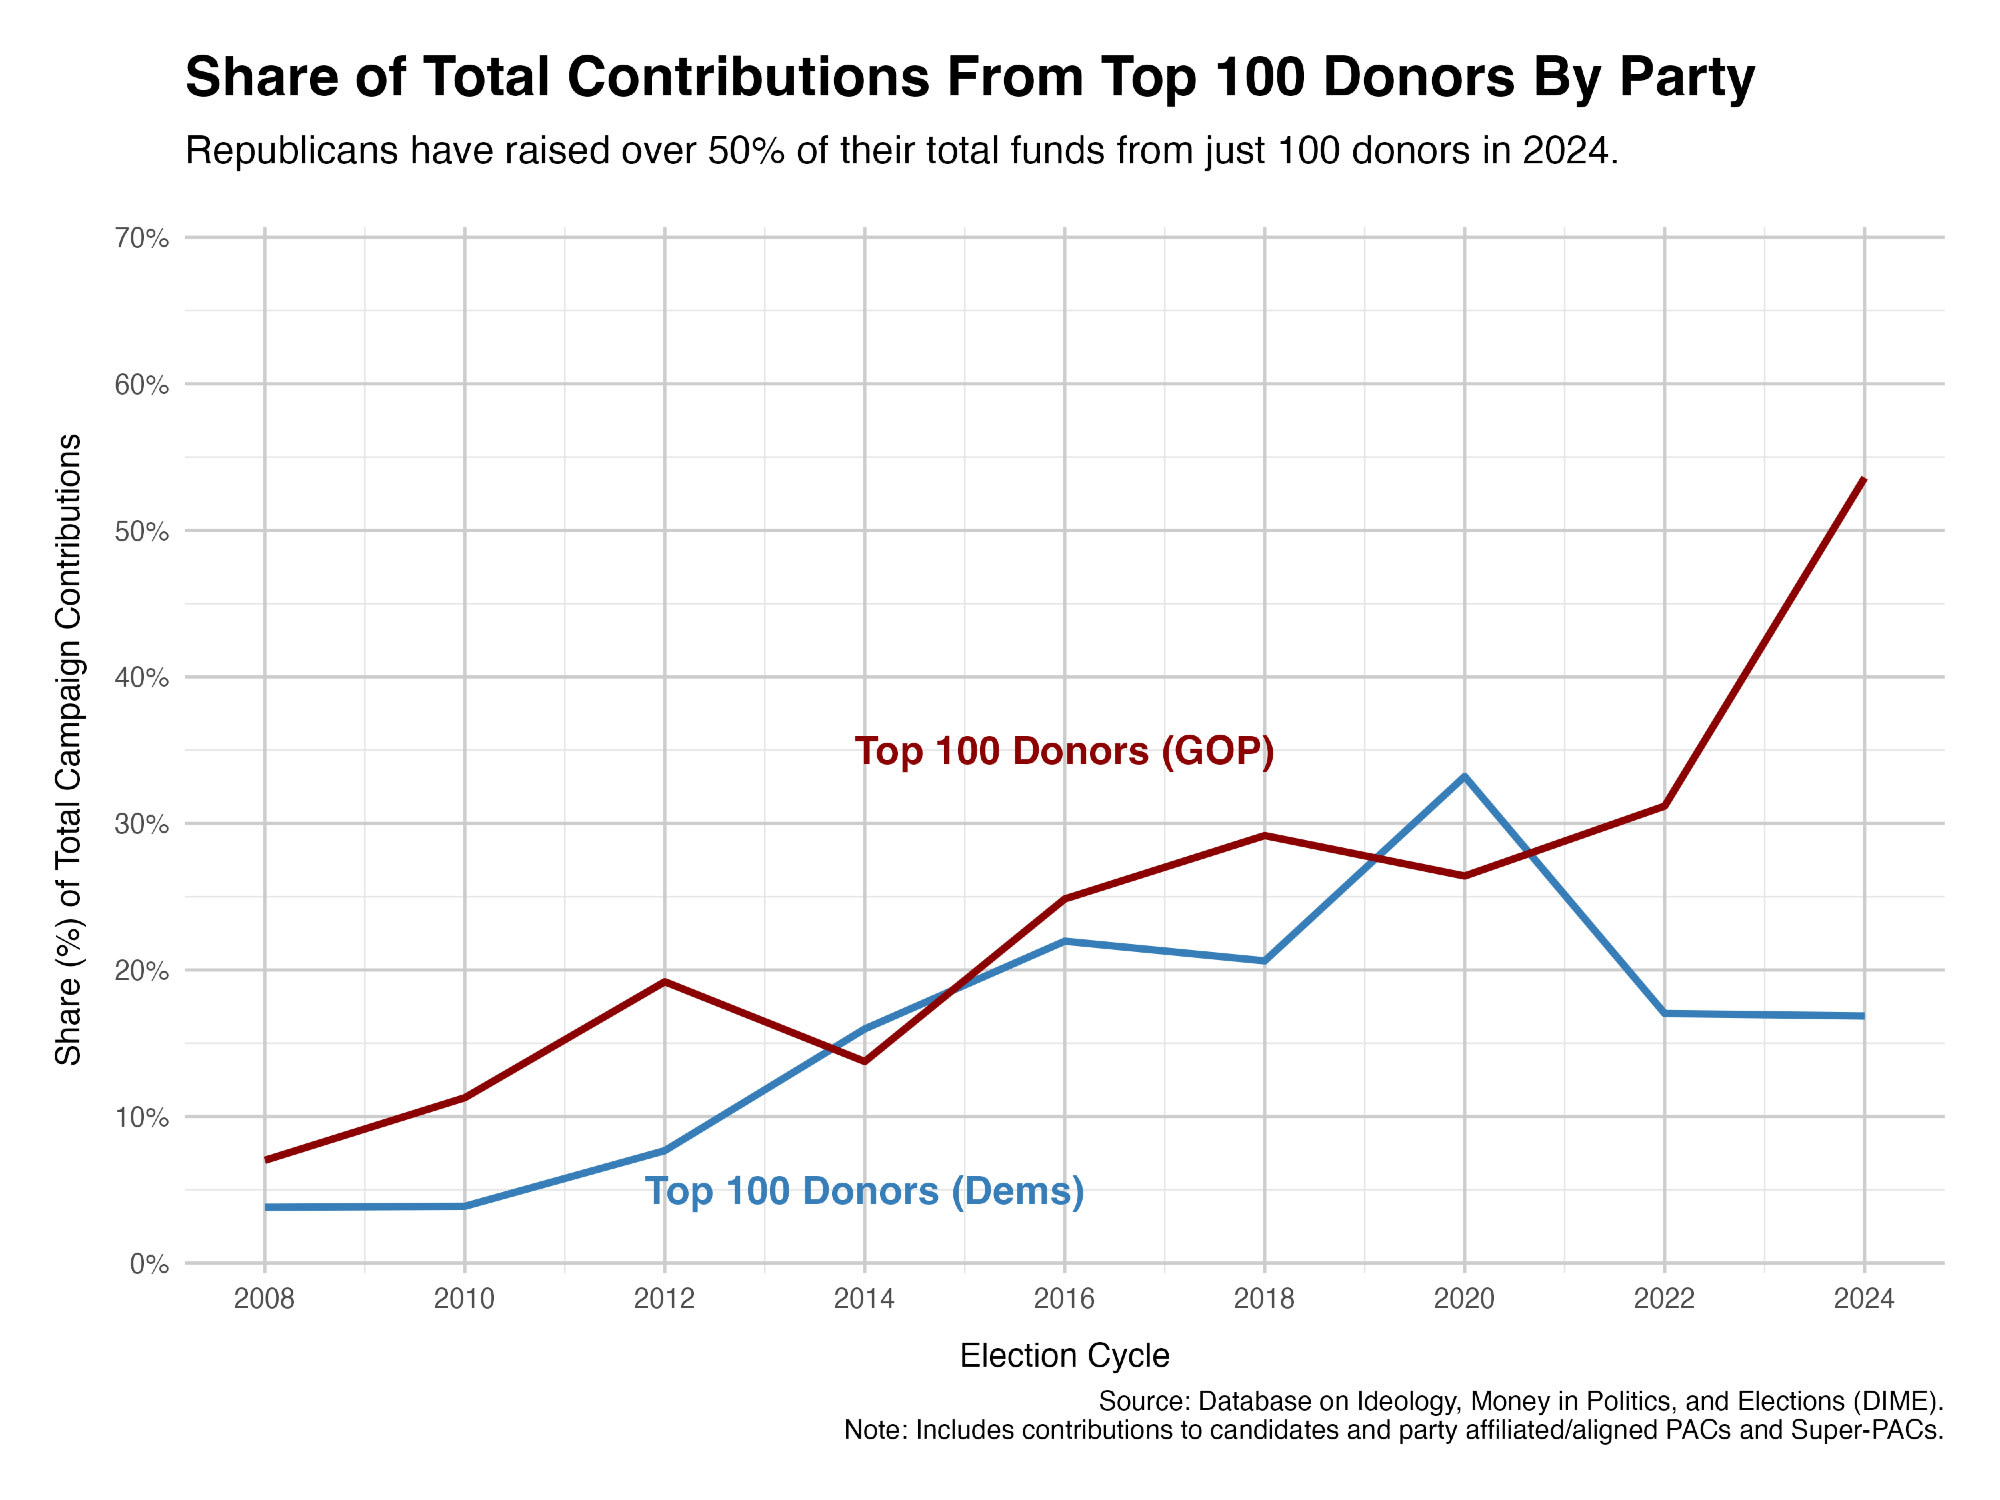
8. Republican Funding from Top 100 Donors by Year
Takeaway: In 2024, the Republican Party received 54% of its total funding from just its top 100 donors, compared to 17% for Democrats from their top 100 donors. (original source)
9. Campaign Funding Sources by Party and Donation Size
Takeaway: Republicans received 56% of their 2024 funds from donations over $1 million. Only 18% of Democratic funds came from $1M+ donors, while they maintained strong support across small and medium-dollar categories. (original source)


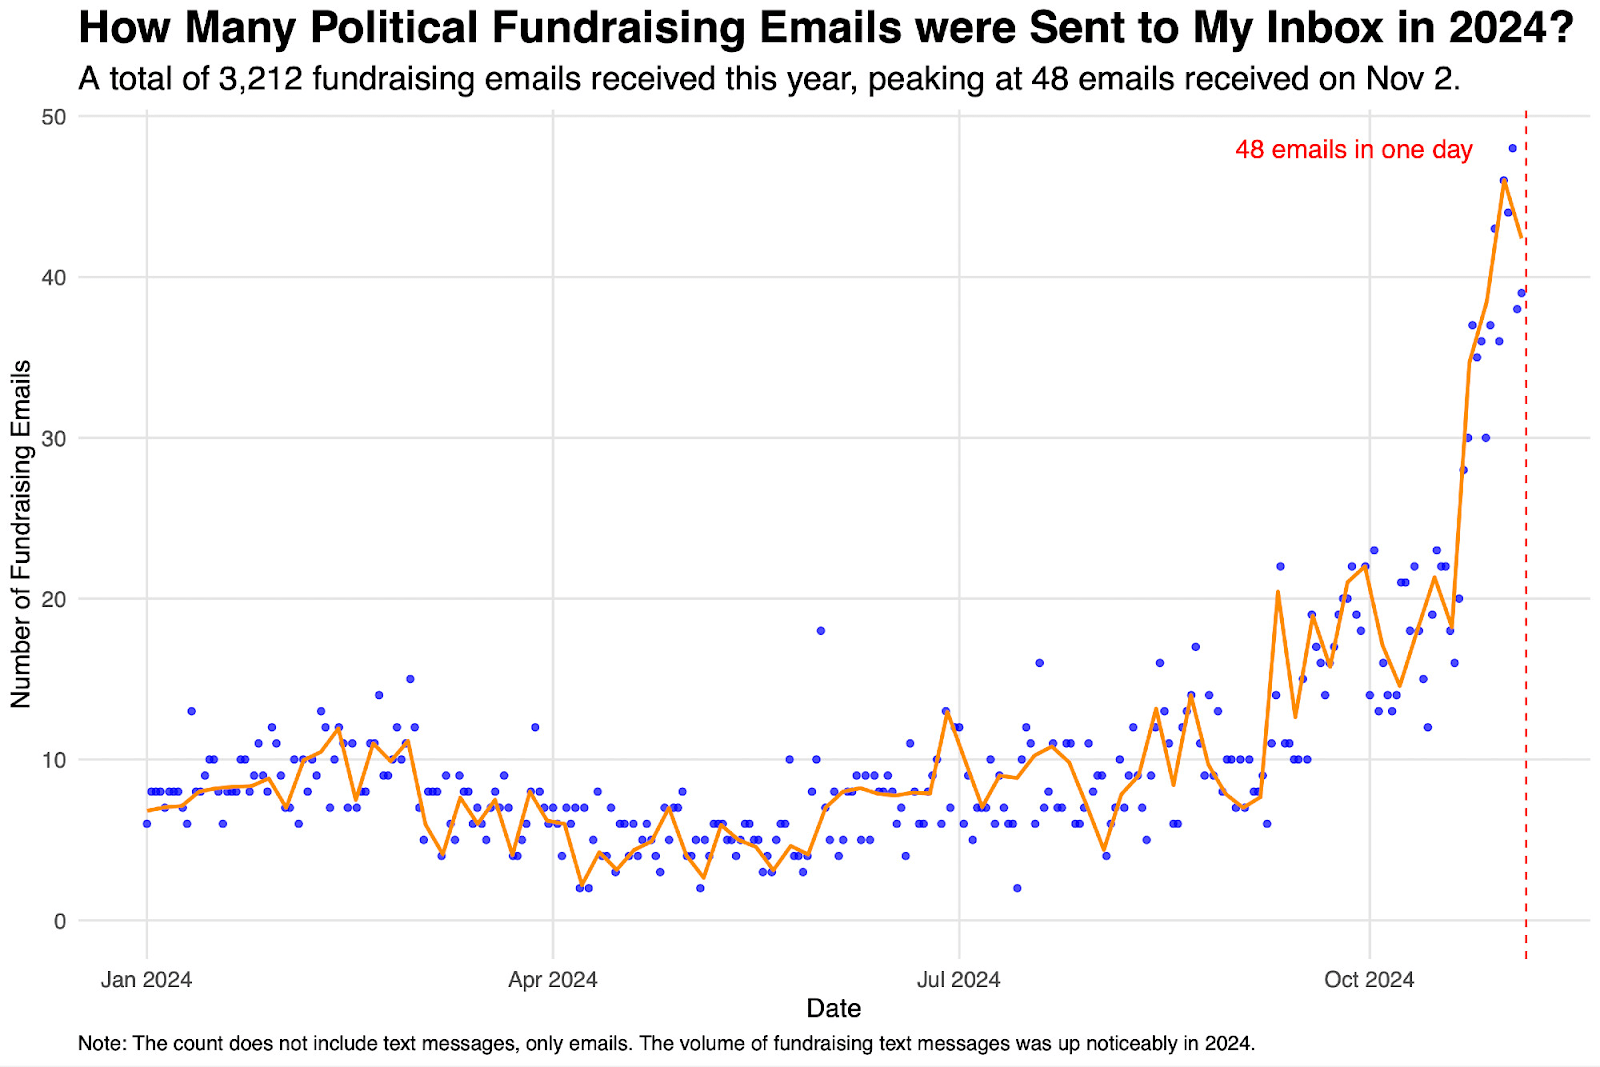
10. For the Rest of Us: Digital Fundraising Appeals Crowd Out Party Messaging and Sap Goodwill
Take-away: Modern political fundraising tactics are a relentless barrage of disrespectful and off-putting emails and texts. Here I tracked the number of fundraising emails I received each day in 2024. With a peak of 48 fundraising emails hitting my inbox in a single day, the sheer volume of appeals reflects a fundraising-at-all-costs mentality that risks alienating and exhausting the very grassroots supporters parties depend on.
The wealth accumulated by America's richest individuals dwarfs entire government budgets, while their tax avoidance strategies deprive public services of resources. This concentration of wealth creates a political class whose personal fortunes exceed the scope of democratic institutions designed to govern them.
11. Forbes 400 Wealth Growth Under Different Presidential Administrations
Takeaway: Billionaire wealth grew an average of 57.1% under Democratic administrations compared to 16.5% under Republican administrations over the past 40 years. This counterintuitive pattern suggests many billionaire political donors prioritize immediate tax cuts over the stronger economic growth that historically occurs under Democratic policies. (original source)
, and values represent cumulative percentage changes in total Forbes 400 wealth during each presidency.")
12. Comparing Billionaire Wealth Gains to Federal Spending
Takeaway: The top 100 billionaires gained $1.094 trillion in wealth in 2024, exceeding the entire federal defense budget and the combined salaries of all federal workers and teachers. (original source)

• Teacher salaries: $214B ($1,702/HH)
• Gasoline: $307B ($2,449/HH)
• Groceries: $664B ($5,278/HH)
• Defense budget: $824B ($6,553/HH)
• 100 billionaires: $1,094B ($8,700/HH)
A red banner at the bottom reads: “If we can’t afford groceries, we definitely can’t afford billionaires.”
Sources listed include HUD, NEA, BLS, USDA, OPM, and Bloomberg (Dec. 31, 2024).")
13. What Costs More: Billionaire Tax Avoidance or Federal Workers?
Takeaway: Based on reported tax rates, one billionaire's tax avoidance (i.e. “tax privileges”) could fund approximately 677,000 federal employee salaries, representing nearly 30% of the federal workforce.
:
• Cost of Musk’s Tax Avoidance (smallest bar, purple)
• Cost of Top 100 Billionaires’ Tax Avoidance (largest bar, red)
• Total Federal Workforce Salaries (mid-sized bar, green)
X-axis ranges from $0B to $380B, showing that billionaire tax avoidance covers a significant portion of federal workforce salaries.
Impact on Federal Workforce:
• Average Federal Salary: $106,000
• Jobs Musk’s Avoidance Could Fund: 677,782 (29.5% of all federal employees)
Federal Workforce Breakdown (Pie Chart):
• A segment representing 29.5% of the workforce highlights the share Musk’s avoided taxes could fund, labeled “Share Equal to Musk’s Avoided Taxes: 29.5%”.
Sources:
• Musk’s Tax Rate: ProPublica
• Billionaire Gains: Bloomberg Billionaires Index (Dec. 31, 2024)
• Federal Employee Data: USAFacts")
The concentration of political donations among the ultra-wealthy reflects a broader pattern in American society. Political power increasingly belongs to older Americans who have accumulated both wealth and influence over their lifetimes. This creates a profound generational disconnect between those who make decisions and those who must live with the consequences.
14. Average Age of Lawmakers Compared to Population Age by Country
Takeaway: The United States has the largest gap between lawmaker age and population age among developed democracies. American lawmakers average nearly 60 years old while the median American is under 40. This 20-year gap means those making decisions about climate change, technology regulation, and student debt often have limited personal stake in long-term consequences.

15. Age Distribution: Democratic Senators vs. Democratic Voters
Takeaway: Half of Democratic senators are over 67 years old, while half of registered Democratic voters are under 50. This 17-year gap shows a significant age mismatch between representatives and constituents. (original source)
 vs. registered Republican voters (more evenly distributed, median age 57). Bottom graph shows Democratic senators (peak around age 70) vs. registered Democratic voters (more evenly distributed, median age 50). Vertical lines mark where half of each population falls. Democratic senators have a much larger age gap from their voters than Republicans do.")
16. Age Distribution: U.S. Senate vs. The Villages Retirement Community
Takeaway: The U.S. Senate's age distribution closely resembles that of The Villages, America's largest retirement community, with both populations clustering in the 65-80 age range. This comparison illustrates how unrepresentative the Senate is—a body making decisions for all Americans has the age profile of a community specifically designed for retirees. (original source)
 closely matches that of The Villages residents (in orange), both peaking around age 70, highlighting the advanced age of the Senate.")
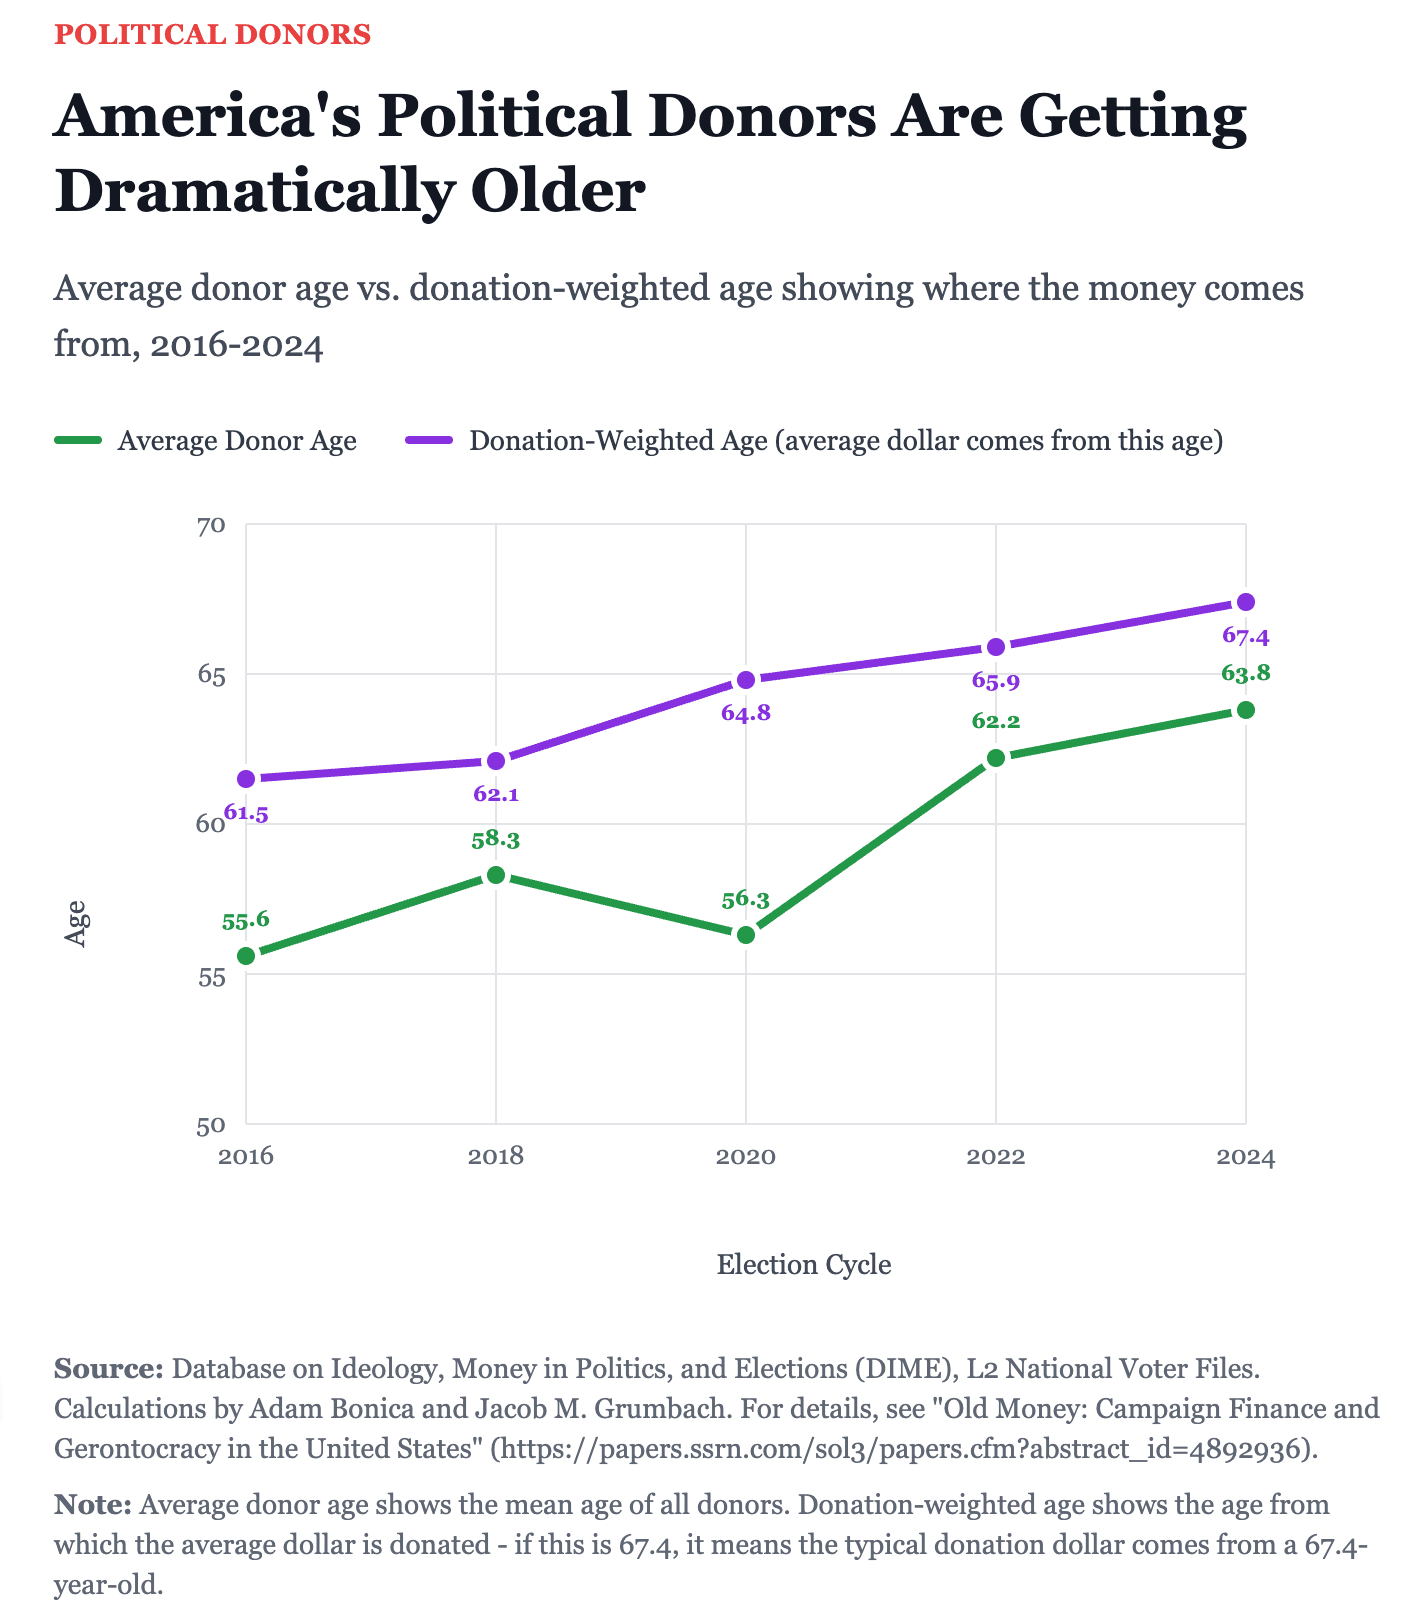
17. Average Age of Political Donors and Donation Sources (2016-2024)
Takeaway: While the average donor age increased from 55.6 to 63.8 years, the age of the average dollar donated jumped from 61.5 to 67.4 years between 2016 and 2024. This shows that older donors are contributing disproportionately more money, creating powerful headwinds against generational change in representation. (original source)
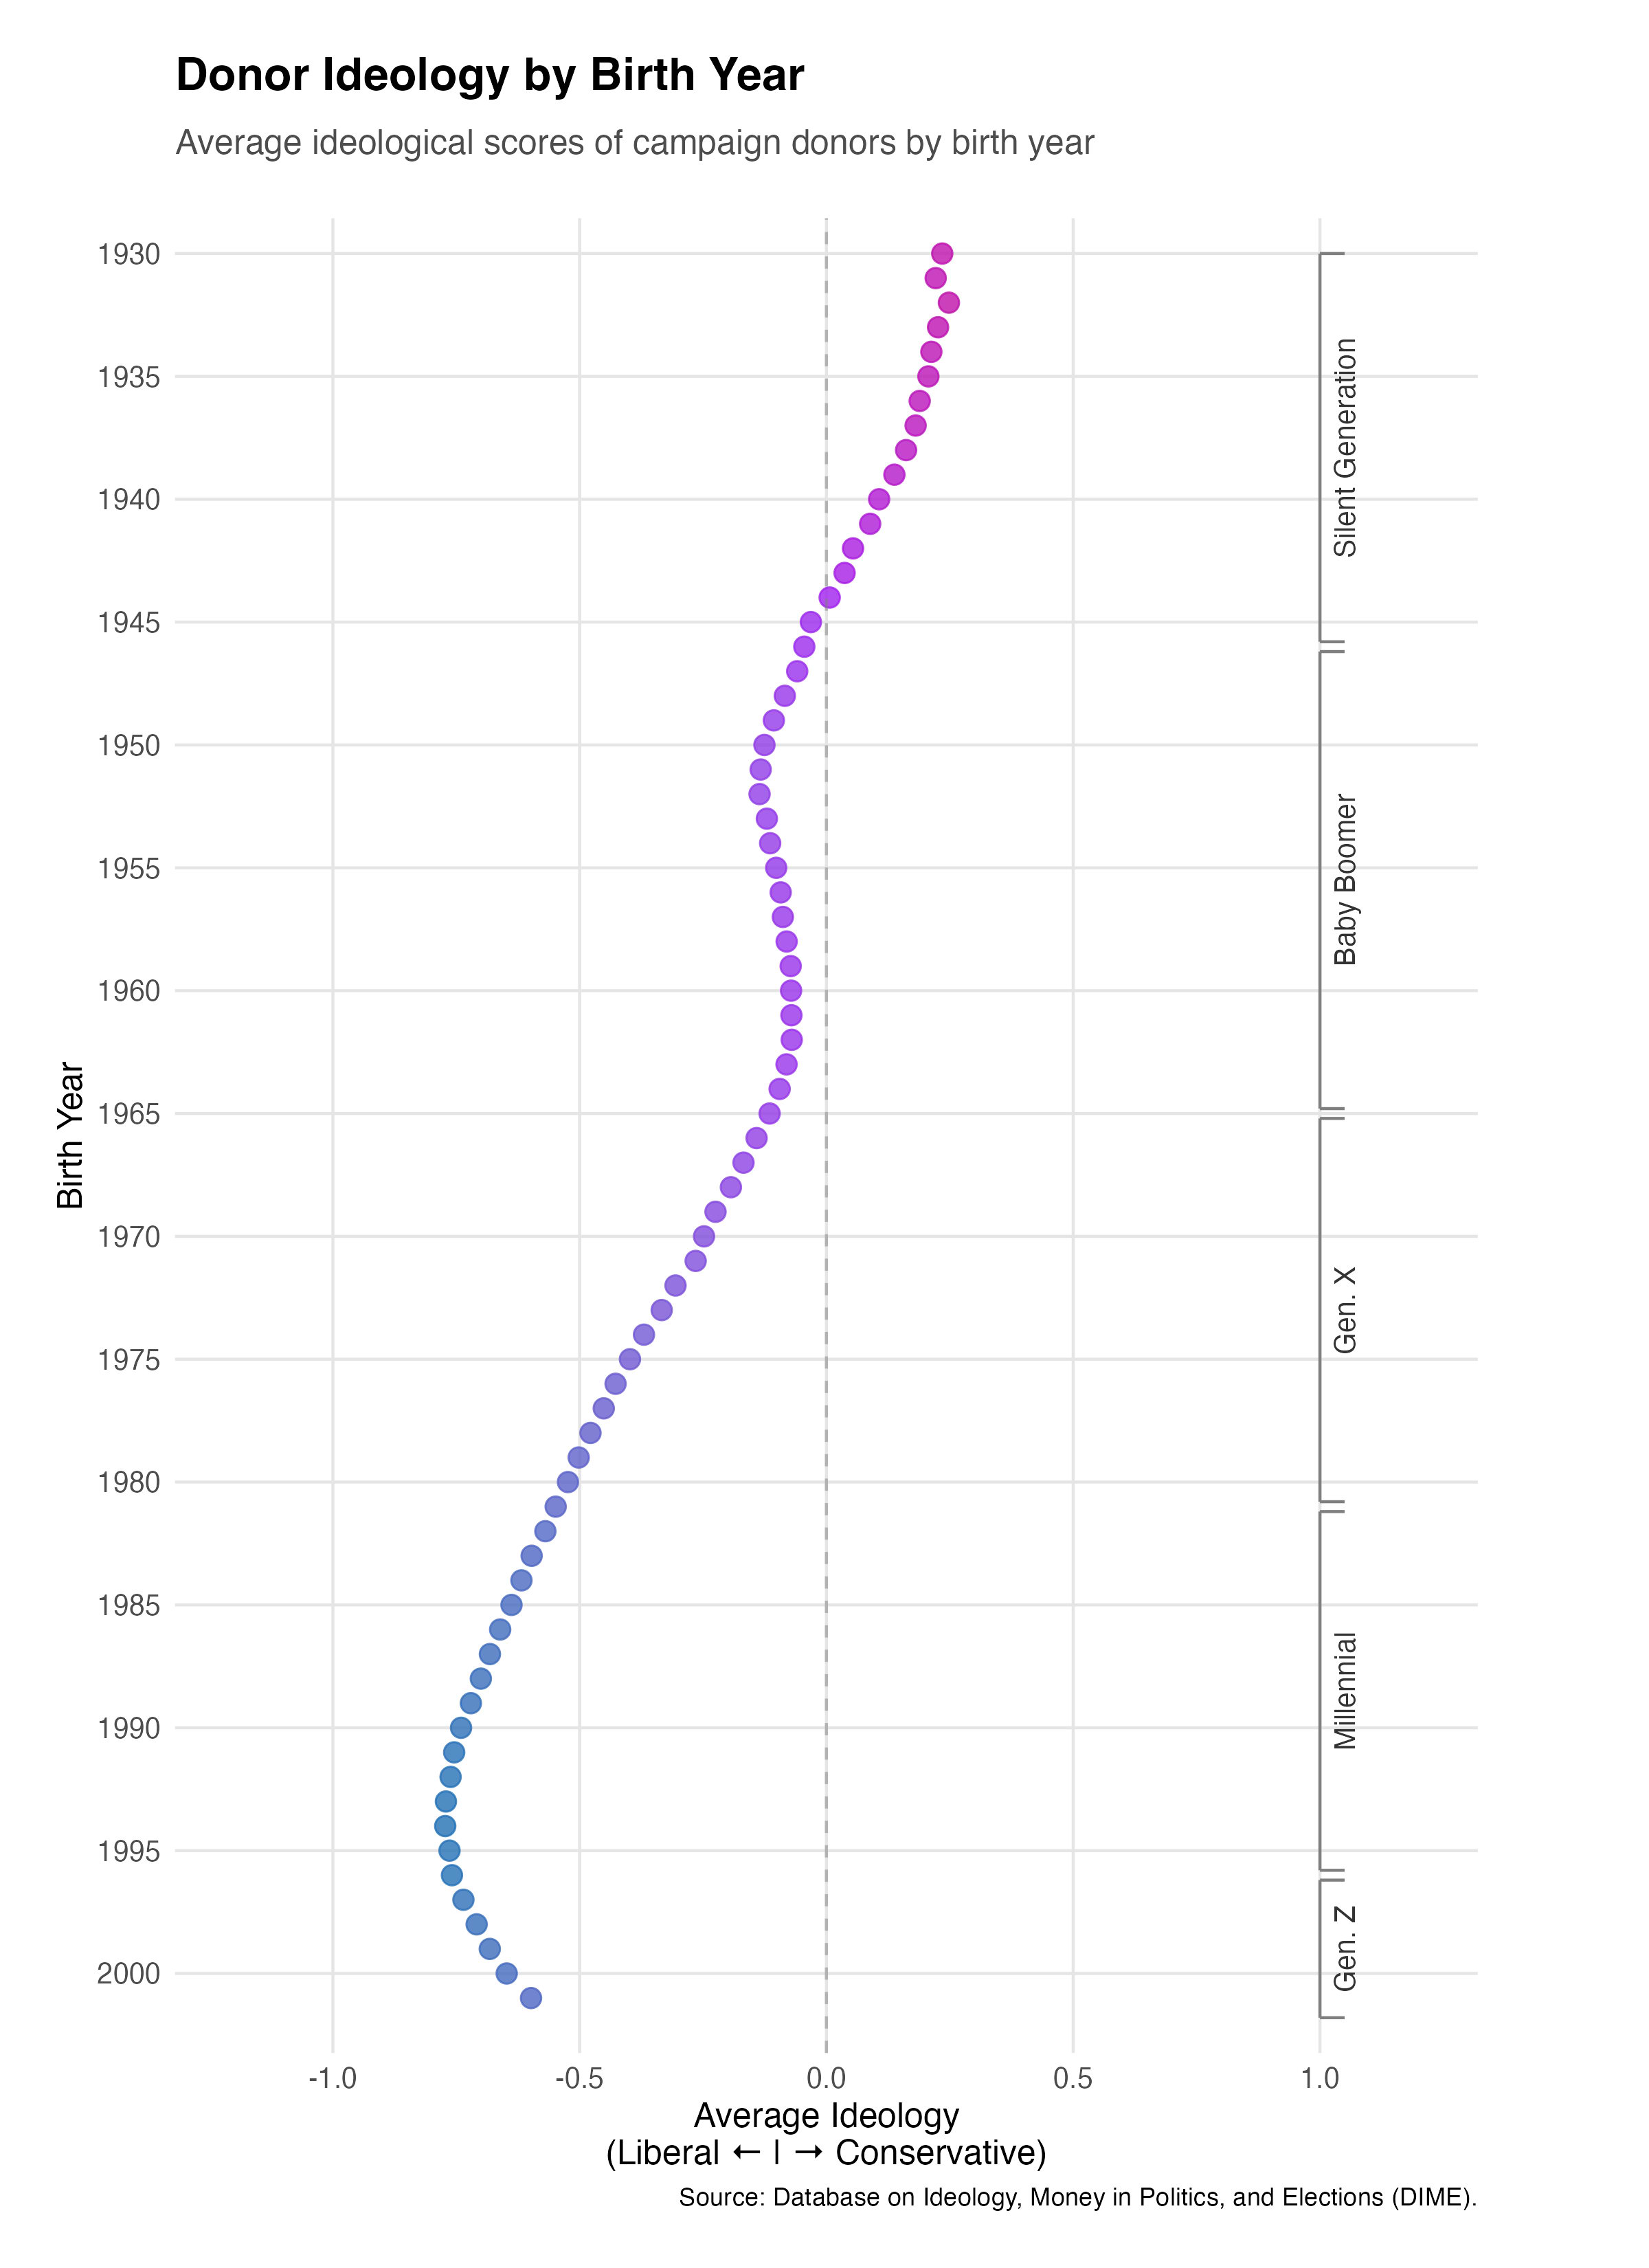
18. Political Donor Ideology by Generation
Takeaway: Younger donors lean heavily Democratic. Approximately 85% of Millennial and Gen Z donors support left-of-center candidates, compared to roughly 40% of Silent Generation donors. This generational divide in donor ideology suggests Democrats have a long-term structural advantage if they can convert young donors' enthusiasm into sustained political power before wealth further concentrates among older conservatives. (original source)
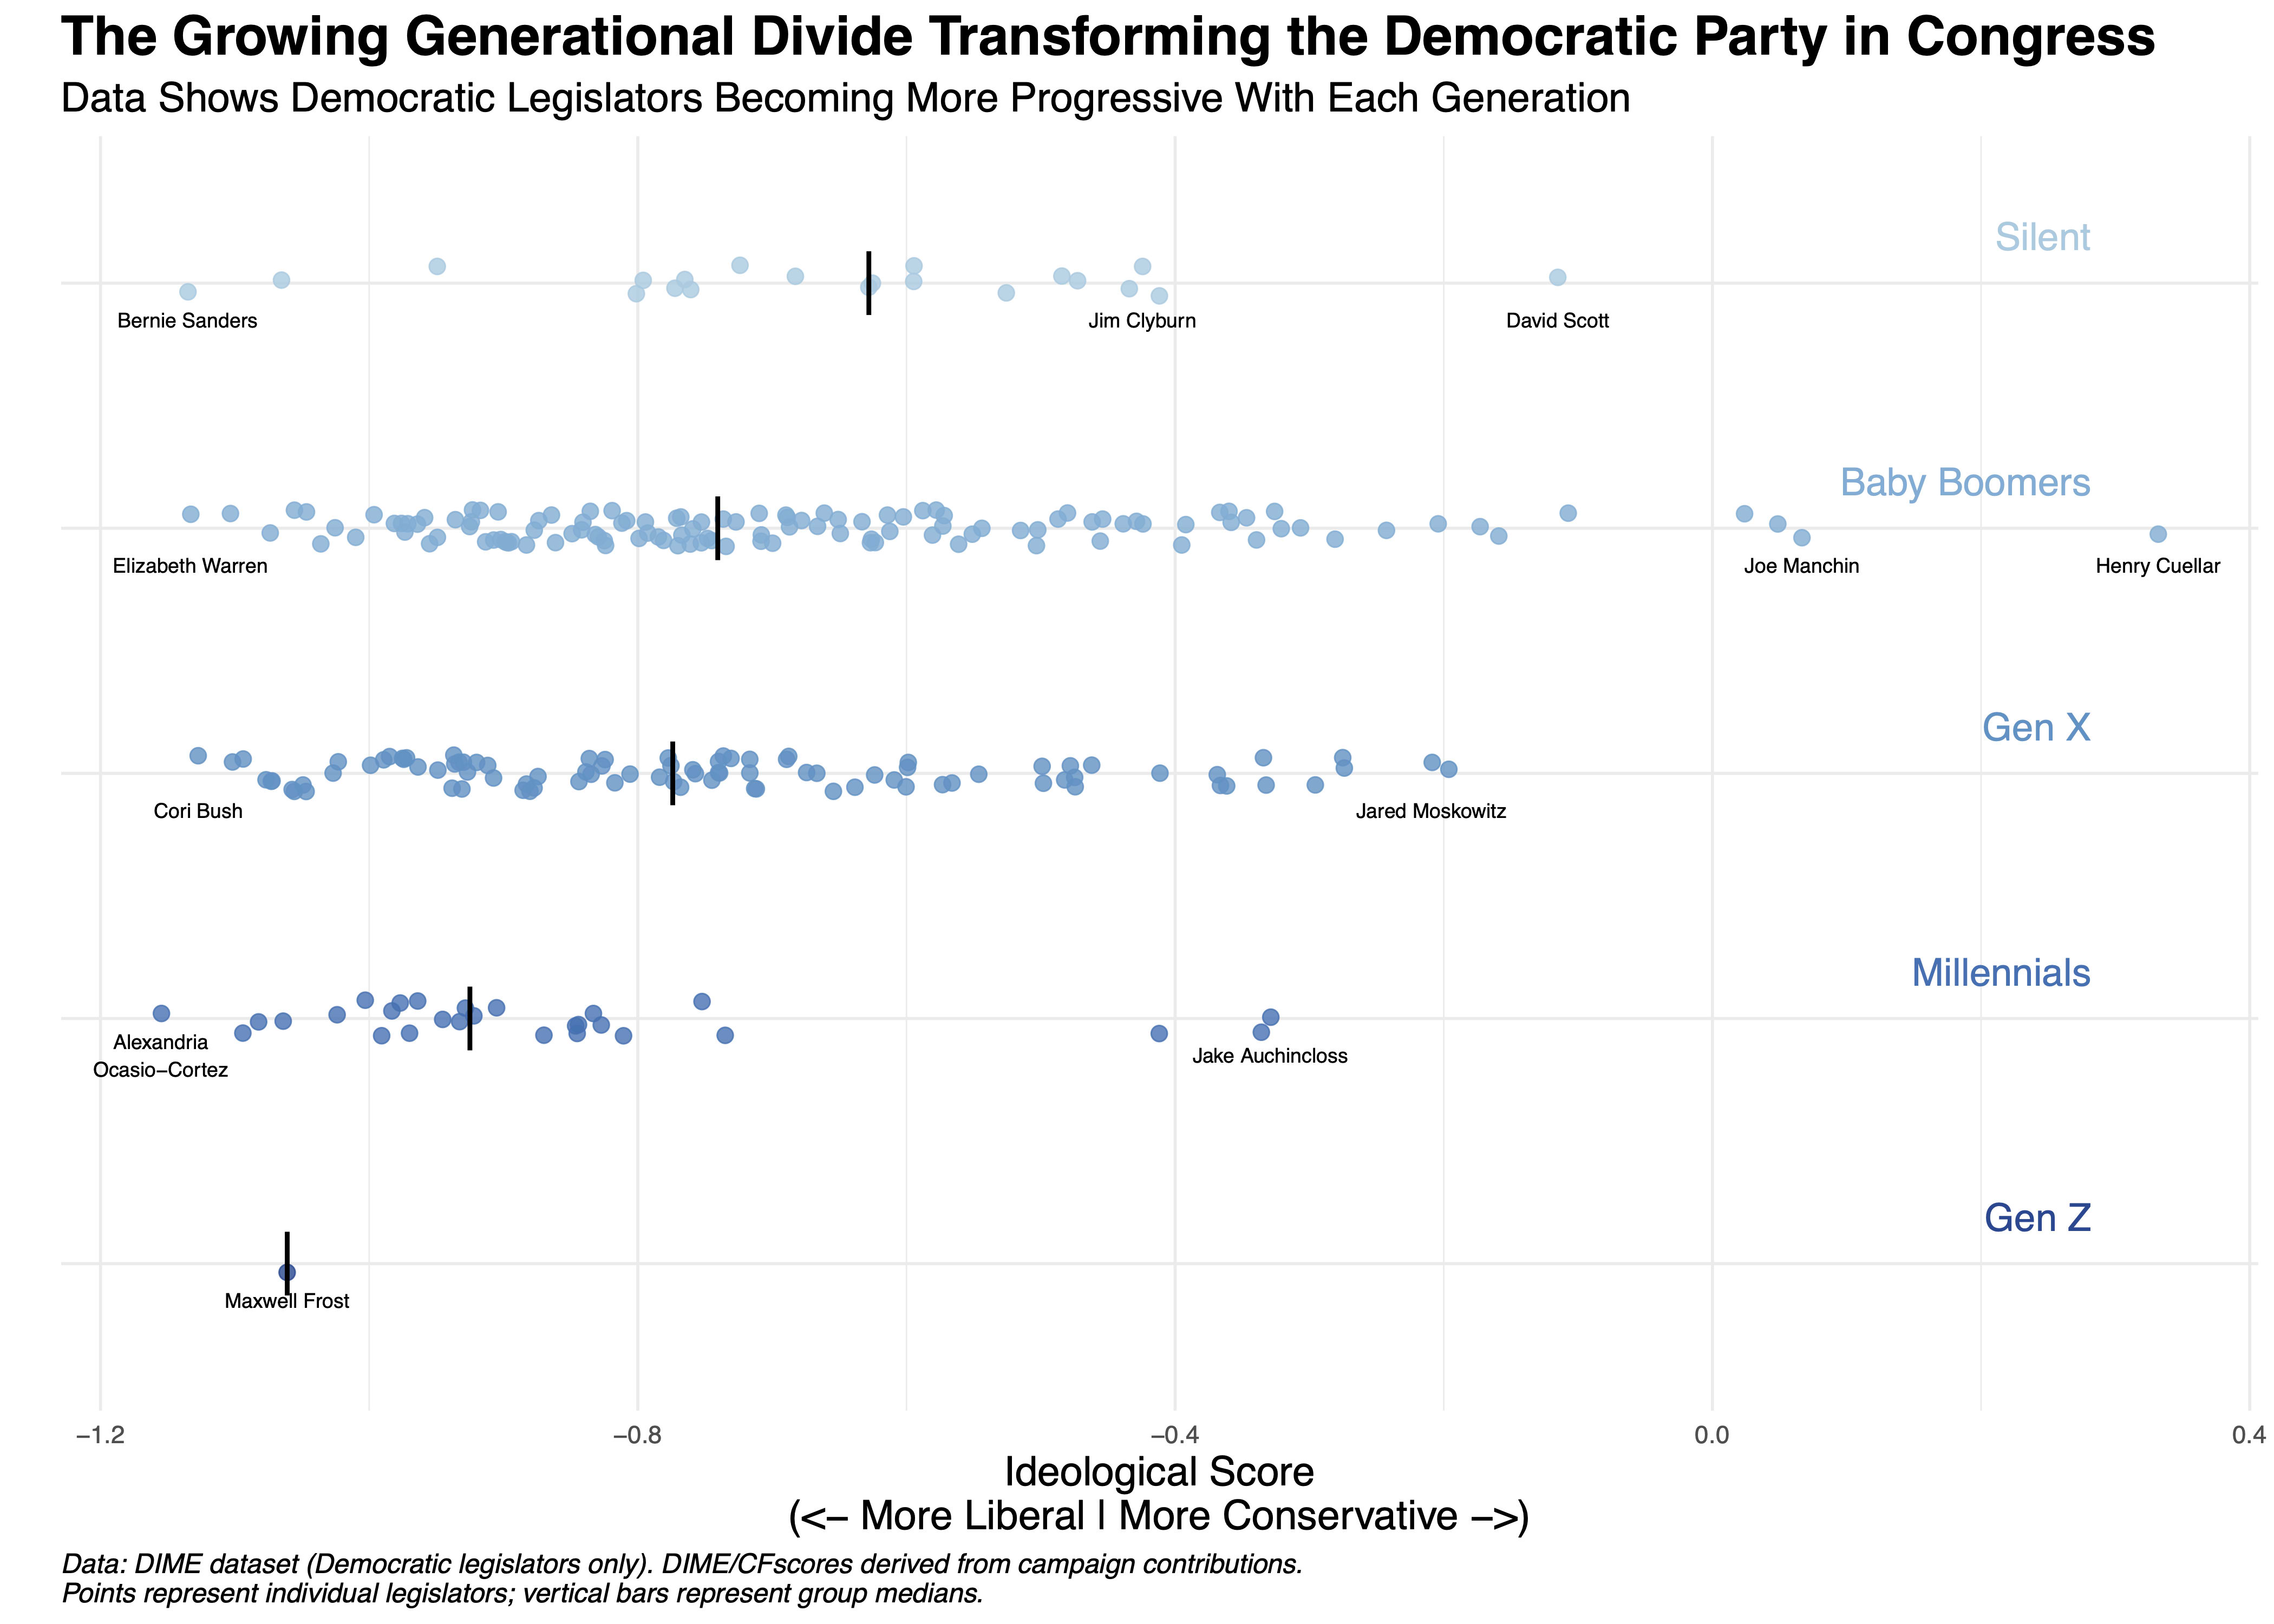
19. Ideological Positions of Democratic Congress Members by Generation
Takeaway: Younger Democratic members of Congress hold more progressive positions than their older colleagues. Millennial and Gen Z members cluster on the left side of the party's ideological spectrum. (original source)
20. Support for Medicaid Work Requirements by Age
Takeaway: Support for adding work requirements to Medicaid increases sharply at age 65, when people become eligible for Medicare and would not be as affected by such requirements. This pattern illustrates how age-based political power can lead to policies that impose costs on younger generations while protecting older Americans' benefits. (original source)

To understand American politics, we must first understand the American voter—and, just as importantly, the non-voter. The data reveals a complex landscape where conventional wisdom about turnout and ideology often fails. The evidence suggests that Democratic success depends less on moving to the center and more on mobilizing the millions of supporters who are already registered but simply not voting.
The Democratic Turnout Deficit
These visualizations document the scale and impact of differential turnout between parties, revealing millions of potential votes left on the table and a Democratic Party struggling to mobilize its base.
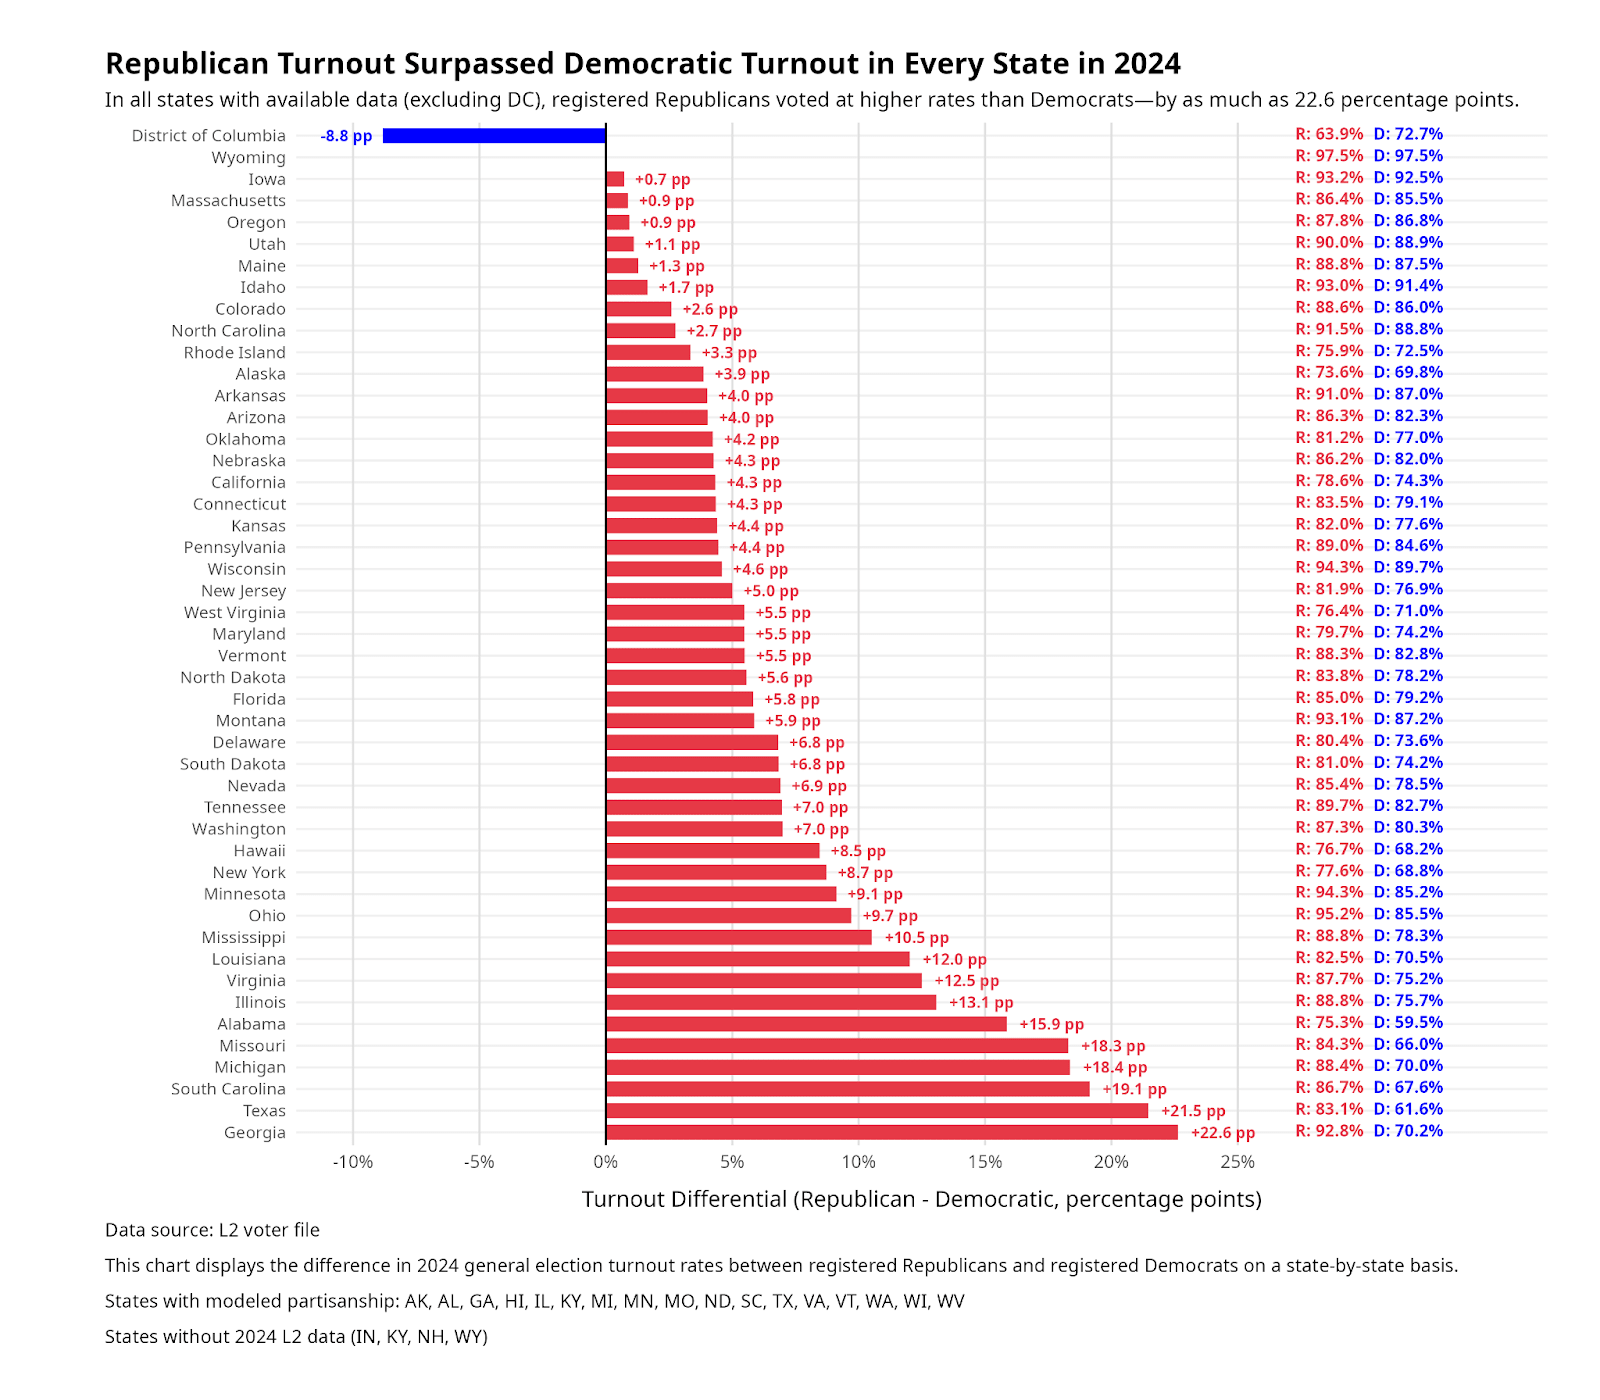
21. Turnout Rates by Party Registration in Each State (2024)
Takeaway: Registered Republicans voted at higher rates than registered Democrats in every state with available data. The gap ranged from 4.8 percentage points in Wisconsin to 22.6 percentage points in Georgia. (original source)
22. Number of Registered Voters Who Didn't Vote, by Party (2024 Swing States)
Takeaway: In swing states, 7.3 million registered Democrats didn't vote, compared to 3.3 million registered Republicans. This 4 million vote gap represents more than the margin of victory in every swing state combined, meaning Democrats' path to victory runs through mobilizing people already registered rather than persuading undecided voters.

23. Potential Democratic Votes at Republican Turnout Rates
Takeaway: If Democrats had matched Republican turnout rates, they would have gained approximately 5.7 million additional votes across three voter categories: those who voted in 2020, those who didn't vote in 2020, and newly registered voters. (original source)

24. Change in Turnout Rates by Generation and Party (2020 to 2024)
Takeaway: Turnout declined for both parties between 2020 and 2024, but the decline was steeper for Democrats in every generation. Gen Z Democrats showed the largest drop at 13.7 percentage points.

25. Political Preferences of Registered Non-Voters (CES 2024 Survey)
Takeaway: Among registered voters who didn't vote in 2024, 53.1% leaned Democratic versus 28.5% leaning Republican, according to Cooperative Election Study survey data. This 24.6-point Democratic advantage among registered non-voters challenges claims that non-voters have shifted Republican and suggests the path to victory runs through turning out existing supporters. When combining registered and unregistered nonvoters, the nonvoting population is more balanced. However, when focusing on registered voters who sat out the election, the story is quite different. (original source)

The Minimal Returns of Ideological Moderation
Parties face strategic choices about ideological positioning. The following data examines whether moving to the center actually helps win elections, challenging conventional wisdom about moderation and electoral success.
26. Comparing Two Strategic Approaches: Turnout vs. Ideology
Takeaway: The analysis shows centrist positioning has not consistently improved Democratic performance. What has improved electoral success is getting registered Democrats to turn out at the same rates as registered Republicans. These results are part of a much larger research project analyzing the effects of ideological positioning on vote shares.

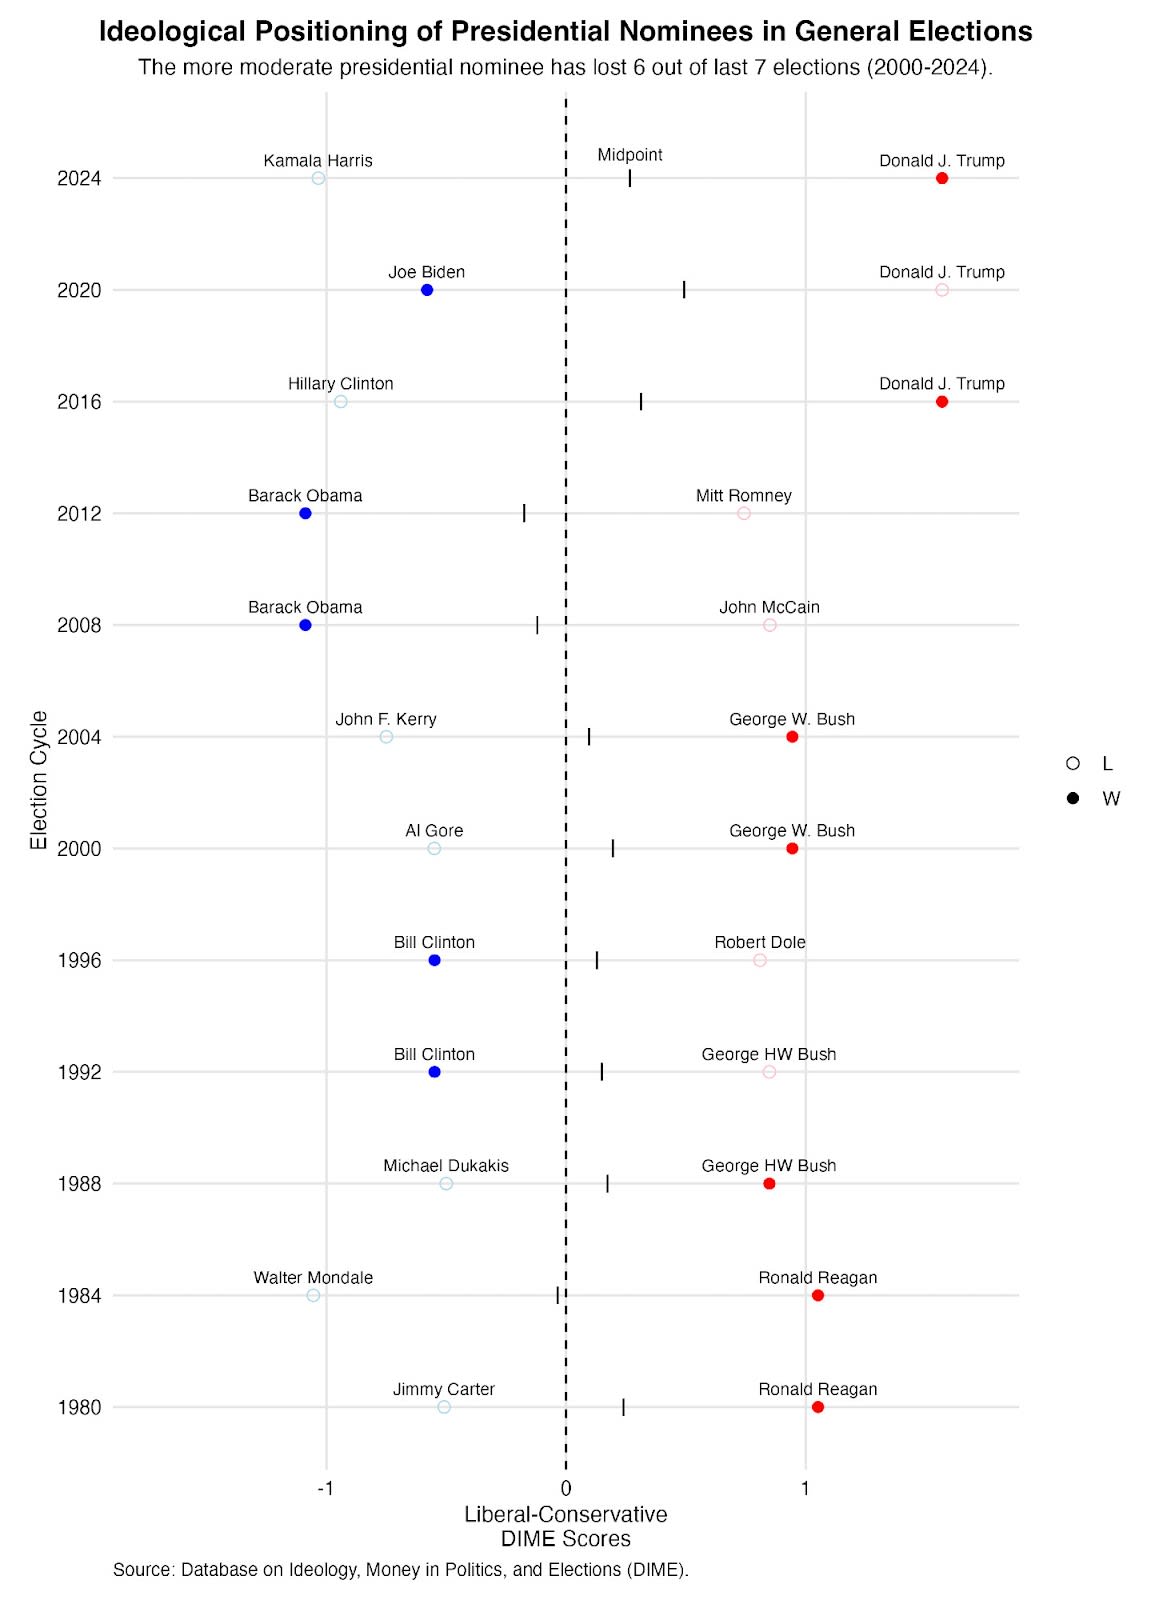
27. Presidential Election Winners and Ideological Positioning (2000-2024)
Takeaway: In six of the last seven presidential elections, the more ideologically moderate candidate lost. (original source)
American democracy does not exist in a vacuum. By examining global trends and historical precedents, we can see the familiar patterns of authoritarian consolidation and learn from the proven strategies of democratic resistance. History provides a playbook—for both the autocrat and the citizen.
28. Timeline of Student-Led Democratic Movements Worldwide (1955-2025)
Takeaway: Student-led protests have played central roles in democratic transitions globally, from South Korea's April Revolution to the Arab Spring, with varying degrees of success. This pattern demonstrates that organized citizen movements can successfully challenge authoritarian power, even when facing seemingly insurmountable odds. (original source)

29. Criminal Prosecutions of Former National Leaders Since 2010
Takeaway: Since 2010, democratic countries have convicted or banned from office dozens of former presidents and prime ministers, showing that prosecuting former leaders for criminal behavior is common practice globally. This undermines claims that such prosecutions represent unprecedented political weaponization and demonstrates that accountability for leaders is a normal feature of healthy democracies. While not a visualization, this final point provides crucial global context, demonstrating that accountability for leaders is a normal feature of healthy democracies. (original source)
These data visualizations tell a story of American democracy under unprecedented strain. Institutions designed to check executive power face systematic assault from above and below. A tiny elite has captured the political funding system, while an aging leadership makes decisions for a younger population that will live with the consequences. Courts have become battlegrounds where different levels of the judiciary operate by different rules.
Yet the data also reveals reasons for hope. Millions of Democratic-leaning Americans remain unengaged but could be mobilized. History shows that student movements and citizen resistance have successfully defended democracy before. The prosecution of corrupt leaders is normal in healthy democracies, not unprecedented.
The evidence points to clear strategic choices: mobilization over moderation, accountability over accommodation, and democratic participation over resignation. The patterns are familiar from other times and places where democracy faced similar threats. What happens next depends on whether Americans choose to act on what the data reveals.
Democracy's survival has never been guaranteed. But neither has its failure. The numbers show both the depth of the crisis and the potential paths forward. The choice, as always, remains with the citizens.