.png)

Main
Driven by the increased consumption of simple sugar and fat, the prevalence of metabolic diseases, including obesity, diabetes and metabolic dysfunction-associated steatotic liver disease (MASLD), has risen alarmingly over the past few decades1. High-fat-containing diets have been extensively used in animal models to study the mechanism of obesity-associated MASLD2,3. Importantly, ~25% of patients with MASLD do not have obesity, but they show even higher risks than patients with obesity of developing severe metabolic dysfunction-associated steatohepatitis (MASH), cirrhosis and hepatocellular carcinoma4 because they miss timely screening owing to their normal body weights. Moreover, although patients with MASLD exhibit a twofold higher risk of developing almost all types of cancers, this risk is not observed in patients with MASLD who are not obese5,6, further underscoring the importance of studying MASLD irrespective of obesity.
High fructose corn syrup (HFCS) consumption, especially in liquid form (for example, soft drinks, juice), is an established risk factor for lean MASLD, MASH, cirrhosis and hepatocellular carcinoma7,8,9,10. Prior studies with various nutritional interventions and genetic animal models revealed many harmful effects of fructose on bodily health, mainly through metabolic alterations in the liver, gastrointestinal system and colonic gut microbiota, where most fructose catabolism occurs11,12,13,14,15,16. This toxic feature of fructose is associated with its unique metabolism in mammals17. Unlike glycolysis, which possesses several rate-limiting enzymes and product feedback inhibitions, fructolysis is mediated by ketohexokinase, which is not allosterically regulated, and triokinase18,19. Therefore, when tissues that express ketohexokinase encounter fructose, they rapidly phosphorylate fructose to fructose 1-phosphate and deplete intracellular ATP. Moreover, cleavage of fructose 1-phosphate generates glyceraldehyde, a reactive metabolite that can induce oxidative stress and damage DNA, RNA and proteins20,21. In addition, compared to glucose, fructose is a much more potent transcriptional activator of lipogenesis in the liver, inducing hepatic steatosis and insulin resistance22,23,24. Finally, excessive fructose intake is linked to intestinal abnormalities, including extended intestinal villi, impaired barrier functions and gut dysbiosis25,26,27.
In contrast to the monomeric sugar fructose, inulin, a fructose polymer (see Fig. 1a), has been used as a prebiotic fibre that can improve insulin sensitivity in patients with diabetes and reduce cholesterol and triglyceride levels in individuals with obesity28,29,30. Consistently, mice fed inulin with a MASH-inducing diet exhibit less severe steatohepatitis phenotypes than mice fed the MASH diet alone31. Given that the gut microbiome, primarily in the large intestine, is responsible for digesting inulin, many studies have focused on changes in colonic microbiome composition induced by inulin31,32, which increases short-chain fatty acid (SCFA) production and has beneficial effects33. However, SCFAs are also copiously produced from many other nutrients, including proteins and fructose15,34, and excessive SCFAs can contribute to hepatic lipogenesis and worsen metabolic disorders through the gut–brain axis15,35. Thus, the protective effects of inulin probably involve further mechanisms in addition to colonic microbial changes and SCFA production.
Using in vivo isotope tracing, metabolomics and transcriptomics analysis in mice, we report that inulin induces the small intestinal microbiome to clear dietary fructose, thereby reducing the detrimental effects of fructose on the host. In addition, inulin redirects fructose-derived carbons toward de novo serine and glutathione synthesis in the liver to suppress lipid peroxidation induced by fructose. Finally, through microbiome sequencing, antibiotic treatment, gut microbiota transplantation and bacterial inoculation experiments, we verified the essential role of the gut microbiome in these multiple effects of inulin and identified Bacteroides acidifaciens as a key mediator. Our findings thus provide a previously unrecognized mechanism by which the fibre-modulated gut microbiome can eliminate deleterious dietary nutrients and protect the host.
Results
Reversal of fructose-induced metabolic dysfunctions by inulin supplementation
To recapitulate the phenotype of lean patients with MASLD, we fed mice HFCS-containing drinking water with standard chow. In parallel, to determine the effect of inulin supplementation on HFCS-elicited pathologies, we used an open-source diet, a control diet used in many nutritional studies36,37,38, and formulated an inulin-enriched diet by replacing a small portion of corn starch (10% w/w) with inulin, as in previous studies39,40,41 (Supplementary Table 1). This amount of inulin is higher than the ~4% w/w that is typically tolerated by humans42, whereas rodent studies use 10% or even higher (15%)43,44,45,46, given that the metabolic rate and food consumption are higher in rodents than humans47. We also sought to test whether delayed inulin supplementation can reverse already established MASLD (CIF group in Fig. 1b). To achieve this goal, we first fed mice a control diet with HFCS-water for 16 weeks to induce hepatic steatosis (Fig. 1c). We then switched the diet to the inulin-supplemented diet with continual HFCS provision for an additional 14 weeks.
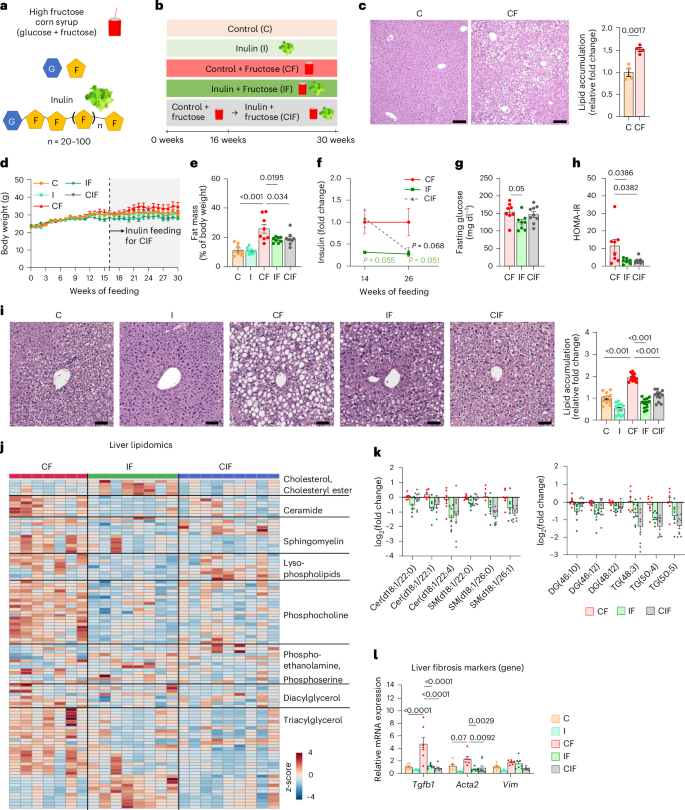
a, Chemical structures of HFCS and inulin. G, glucose; F, fructose. b, Experimental groups. Mice received a control (C) or inulin-supplemented (I) diet with or without HFCS (F) in drinking water. For the CIF group, mice first received a control diet with HFCS and then an inulin diet with HFCS from week 16. c, Representative liver H&E staining and quantitation of lipid accumulation. Scale bars, 200 μm (n = 4, 4 mice). d,e, Body weight (d) and fat mass (e) (n = 8, 8, 8, 8, 9 mice). f–h, Fasting insulin on weeks 14 and 26 (f) (n = 8, 7, 8 mice), fasting glucose on week 26 (g) (n = 8, 8, 9 mice) and HOMA-IR on week 26 (h) (n = 7, 7, 8 mice). i, Representative liver H&E staining and quantitation of lipid accumulation. Staining was performed in three mice per group, and lipid accumulation was quantified in four randomly selected areas per liver. Scale bars, 50 μm. j, Liver lipidomics (n = 7, 8, 9 mice). k, Abundances of the indicated hepatic lipid species normalized to the CF group (n = 7, 8, 9 mice). Cer, ceramide; SM, sphingomyelin; DG, diacylglycerol; TG, triacylglycerol. Numbers in brackets denote total number of carbon atoms and number of double bonds. l, Liver fibrosis marker gene expression (n = 8, 8, 7, 7, 9 mice). Data are means; error bars, s.e.m. P values determined by one-way ANOVA with Tukey’s honestly significant difference (HSD) test (e–l) or two-sided unpaired Student’s t-test (c). Illustrations in a and b created with BioRender.com.
Substituting corn starch for inulin resulted in ~7% fewer calories (Supplementary Table 1). However, calculation of total calorie intake based on the consumption of chow and HFCS (Extended Data Fig. 1a,b) indicated no significant difference in total calorie intake between the three groups that received HFCS (Extended Data Fig. 1c). Consistent with previous reports16,48, without a high-fat diet provision, HFCS drinking alone did not increase body weight substantially (Fig. 1d), although it increased the per cent fat mass (Fig. 1e) and decreased per cent lean mass (Extended Data Fig. 1d) compared to the control diet alone. Intriguingly, both simultaneous and delayed inulin supplementation suppressed the HFCS-induced fat–lean mass imbalance (Fig. 1e and Extended Data Fig. 1d). However, this effect of inulin was not a result of changes in locomotive activity, heat production, metabolic rates or respiratory exchange ratio (Extended Data Fig. 1e–i).
We next examined the effect of simultaneous and delayed inulin supplementation on insulin resistance and hepatic steatosis elicited by HFCS drinking. Compared to HFCS feeding alone, HFCS and inulin co-feeding showed decreased trends in fasting insulin and glucose levels (Fig. 1f,g). Switching the control diet to the inulin-enriched diet (the CIF group), despite continued HFCS drinking, also tended to decrease fasting insulin levels (Fig. 1f) without affecting fasting glucose levels (Fig. 1g). Driven by the decreased insulin levels, delayed inulin supplementation reduced the homoeostatic model assessment of insulin resistance (HOMA-IR) as much as simultaneous inulin supplementation did (Fig. 1h).
Next, we examined the effect of inulin on the liver. Simultaneous and delayed inulin supplementation suppressed or reversed HFCS-induced hepatic lipid accumulation (Fig. 1i). Liver lipidomics analysis also revealed that inulin provision reduced hepatic lipid species, including ceramide, sphingomyelin, diacylglycerol and triacylglycerol (Fig. 1j,k). In patients with MASLD, mitochondrial DNA levels are generally increased as a compensatory mechanism in response to mitochondrial damage49,50. Inulin supplementation decreased mitochondrial DNA levels, suggesting low mitochondrial damage (Extended Data Fig. 1j). Although HFCS feeding alone did not induce advanced stages of fibrosis detectable by histological analysis (Extended Data Fig. 1k), qPCR analysis indicated downregulated gene expression of HFCS-induced liver fibrosis markers by simultaneous or delayed inulin supplementation (Fig. 1l). Thus, even delayed inulin intake can reverse HFCS-induced systemic metabolic dysfunctions and liver damage.
The effect of inulin on hepatic lipid synthesis and oxidation
In patients with MASLD, hepatic de novo lipogenesis (DNL) is a major contributor to steatosis development, and fructose is a potent DNL inducer22,24,51,52. Therefore, we sought to determine the effect of simultaneous and delayed inulin provision on hepatic DNL using a deuterated water (2H2O) tracer throughout the diet interventions (Fig. 2a). We first measured circulating levels of 2H-labelled saponified fatty acids that reflect hepatic DNL. Mice fed HFCS alone for 14 weeks showed significantly increased 2H-labelled fatty acids (Fig. 2b). Simultaneous or delayed inulin supplementation suppressed or reversed such induction (Fig. 2b,c). These results motivated us to quantitatively analyse hepatic DNL flux by calculating the appearance rate of 2H-labelled saponified palmitate per cent in blood after normalization to body water enrichment53 (Extended Data Fig. 1l). This analysis revealed that both simultaneous and delayed inulin supplementation significantly reduced HFCS-induced DNL (Fig. 2d). We also noticed a significant reduction both in circulating saponified palmitate following inulin supplementation (Extended Data Fig. 1m) and 2H-labelled palmitate levels normalized to body water enrichment (Fig. 2e). Considering that most circulating palmitate reflects triglycerides released from the liver, these data suggest that inulin not only decreases hepatic DNL but also affects other processes, such as hepatic secretion of triglycerides or clearance of circulating triglycerides.
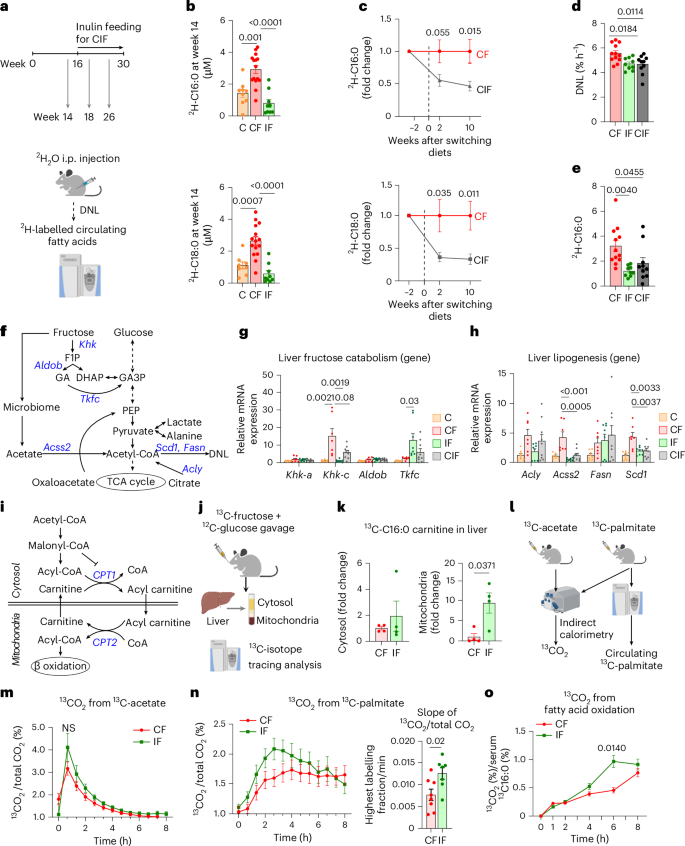
a, Schematic of lipogenesis measurements using 2H2O tracing. i.p., intraperitoneal b, 2H-labelled fatty acids in circulating lipids on week 14 (n = 9, 16, 9 mice). c, 2H-labelled fatty acids in circulating lipids before and after switching diets for the CIF group. Data are fold changes relative to CF (n = 9, 9 mice). d, DNL rate measured by 2H2O tracing after normalization to body water enrichment (n = 12, 9, 10 mice). See Methods for more details. e, 2H-labelled palmitate concentration normalized to body water enrichment (n = 12, 10, 10 mice). f, Fructose catabolism and lipogenesis pathways. GA, glyceraldehyde; GA3P, glyceraldehyde-3-phosphate. PEP, phosphoenolpyruvate. g, Liver fructose catabolism gene expression (n = 8, 7, 8, 9 mice). h, Liver lipogenesis gene expression (n = 8, 7, 8, 9 mice). i, FAO pathway. j, Schematic of 13C-fructose tracing and hepatic cytosol and mitochondria fractionation. k, 13C-labelled C16:0 carnitine levels in cytosol versus mitochondria fraction of liver (n = 4, 4 mice). l, Schematic of whole-body fatty acid oxidation measurements using 13C-acetate and 13C-palmitate tracing. m, The ratio of 13CO2 to unlabelled CO2 over time after 13C-acetate administration (n = 8, 7 mice). n, The ratio of 13CO2 to unlabelled CO2 over time (left) and slope up to the maximum point (right) after 13C-palmitate administration (n = 8, 7 mice). o, 13CO2 from 13C-palmitate after normalization to circulating 13C-palmitate (n = 8, 7 mice). Data are means; error bars, s.e.m. P values determined by one-way ANOVA with Tukey’s HSD test (b,d–h), two-way ANOVA with Tukey’s HSD test (m,o) or two-sided unpaired Student’s t-test (c,k,n). NS, not significant. Illustrations in a, j, and l created with BioRender.com.
Excessive fructose catabolism in the liver has been shown to drive the gene expression of DNL enzymes22,23. We therefore measured hepatic gene expression of enzymes for fructose catabolism and DNL (Fig. 2f). As previously reported54, HFCS feeding strongly induced the active isoform of Khk (Khk-c) (Fig. 2g). Simultaneous and delayed inulin supplementation blocked such induction (Fig. 2g). Intriguingly, Tkfc, an enzyme that converts fructose-derived toxic glyceraldehyde to glyceraldehyde-3-phosphate (Fig. 2f), was only induced when mice were fed both HFCS and inulin (Fig. 2g). Given that glyceraldehyde is a reactive metabolite that generates glycation products, which can damage DNA, RNA and proteins and induce hepatocyte cell death55, the induction of Tkfc expression by inulin may exert hepato-protective effects. In terms of DNL enzymes, HFCS induced gene expression of Acly (ATP citrate lyase), Acss2 (acyl-CoA synthetase short-chain family member 2), Fasn (fatty acid synthase) and Scd1 (stearoyl-coenzyme A desaturase 1) (Fig. 2h). Simultaneous and delayed inulin supplementation suppressed gene expression of Acss2 and Scd1 (Fig. 2h). Therefore, we conclude that inulin-induced mitigation or reversal of hepatic pathologies is in part attributed to the suppression of excessive hepatic fructose catabolism and DNL.
Next, we investigated the effect of inulin on fatty acid oxidation (FAO), which is normally suppressed by DNL through malonyl-CoA-mediated carnitine palmitoyltransferase 1 (CPT1) inhibition (Fig. 2i). Given the effect of inulin on suppressing DNL, we speculated that inulin activates FAO, thereby contributing to the reversal of HFCS-induced steatosis. During FAO, cytosolic fatty acids should be first conjugated with carnitine, forming acylcarnitine for their import into mitochondria (Fig. 2i). To measure newly synthesized acylcarnitine from fructose, we orally provided mice with a 13C-fructose tracer and fractionated the cytosol and mitochondria from fresh liver (Fig. 2j and Extended Data Fig. 1n,o). We found that inulin feeding significantly increased the levels of 13C-labelled acylcarnitine in the mitochondria but not in the cytosol (Fig. 2k). These data suggest that compared to HFCS feeding alone, HFCS with inulin feeding increased hepatic fructose carbon use to generate mitochondrial acylcarnitine for FAO.
To more quantitatively assess systemic FAO, we compared the oxidation of orally provided 13C-palmitate versus 13C-acetate (fully oxidizable) into 13CO2 using indirect calorimetry (Fig. 2l). This comparison is critical because CO2 fixation reactions (by pyruvate carboxylase, urea carboxylase and so forth) affect total 13CO2 exhalation56,57. We did not observe significant differences in 13CO2 production from 13C-acetate (Fig. 2m). By contrast, upon 13C-palmitate administration, inulin-fed mice showed accelerated exhalation of 13CO2 (Fig. 2n). Given that orally provided 13C-palmitate is mixed with unlabelled palmitate from triglycerides in blood, we measured blood 13C-palmitate enrichment and normalized 13CO2 production to estimate the total circulating palmitate oxidation (Extended Data Fig. 1p)58. Inulin-fed mice showed significantly increased 13CO2 production (Fig. 2o). These results suggest that inulin suppresses lipogenesis but boosts FAO, which contributes to the prevention or reversal of HFCS-induced hepatic steatosis.
The impact of inulin on preventing fructose spillover to liver and colon
Previous studies have shown that fructose catabolism in the small intestine reduces fructose spillover to the liver and colonic microbiome, thereby suppressing hepatic DNL, liver steatosis and gut dysbiosis14,15,59. To determine how inulin affects small intestinal fructose catabolism and fructose spillover, we orally provided mice with a 13C-fructose tracer (with unlabelled glucose) (Fig. 3a). Inulin did not affect the production of labelled fructose 1-phosphate (Extended Data Fig. 2a), the metabolite marker of fructose catabolism (Fig. 2f), or the gene expression of fructose transporters and catabolic enzymes in the small intestine (Extended Data Fig. 2b). Moreover, inulin did not affect the amount of fructose reaching the small intestine, as shown by similar concentrations of 13C-fructose in the jejunal and ileal contents between groups (Fig. 3b). However, 13C-fructose was nearly absent in the caecum of inulin-fed mice (Fig. 3b). By comparison, glucose levels were similar in the caecum between groups (Extended Data Fig. 2c). These data suggest reduced fructose spillover to the colon in inulin-fed mice.
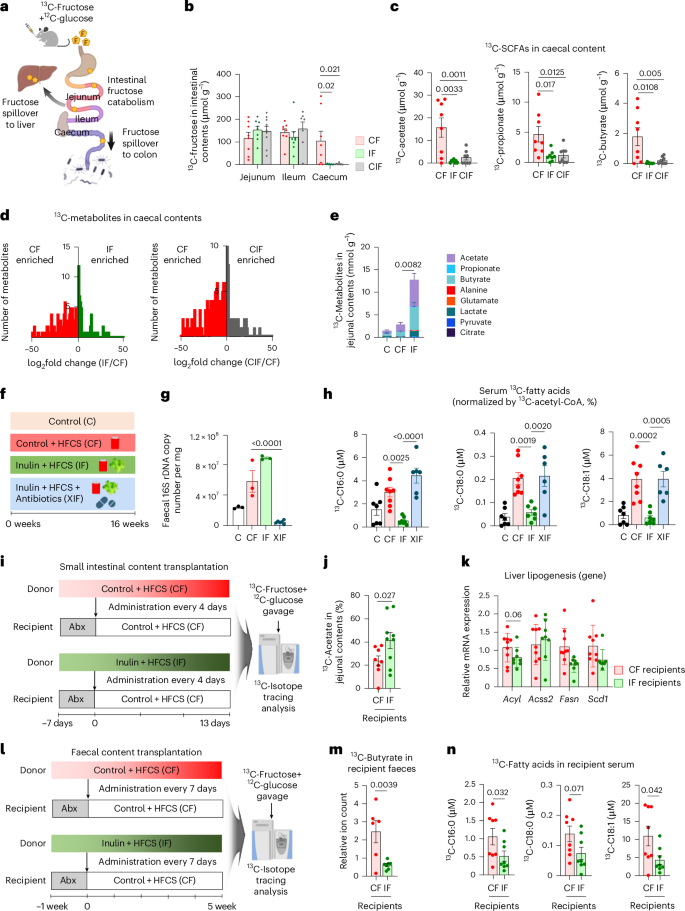
a, Schematic of dietary fructose catabolism by the host organs and gut microbiome. The small intestine first catabolizes fructose, and the leftover fructose spills over to the liver or colon and induces lipogenesis and gut dysbiosis. b, 13C-fructose levels in various intestinal contents 30 min after oral provision of HFCS with 13C-labelled fructose (n = 8, 8, 9 mice). c, 13C-labelled SCFAs in caecal contents (n = 8, 8, 8 mice). d, Comparison of labelled metabolite abundances in caecal contents between CF versus IF (left) (n = 8, 8 mice) or CF versus CIF (right) (n = 8, 8 mice). e, 13C-labelled metabolites in jejunal contents (n = 7, 7, 7 mice). f, Dietary intervention groups. XIF, antibiotics-treated group. g, Faecal 16S rDNA copy number (n = 3, 3, 3, 6 mice). h, 13C-labelled circulating saponified fatty acids normalized to hepatic 13C-acetyl CoA fraction, 1 h after provision of HFCS with 13C-labelled fructose (n = 7, 8, 8, 6 mice). i, Schematic of small intestinal microbiome transplantation experiments from donors (CF or IF) to recipients (CF after antibiotics). j,k, 13C-labelled acetate fraction in jejunal content (j) and liver lipogenesis gene expression (k) in recipient mice, 1 h after provision of HFCS with 13C-labelled fructose (n = 9, 9 mice). l, Schematic of faecal transplantation experiments. m,n, 13C-labelled butyrate in faeces (m) and 13C-labelled circulating saponified fatty acids (n) in recipient mice 1 h after provision of HFCS with 13C-labelled fructose (n = 8, 8 mice). Data are means; error bars, s.e.m. P values determined by one-way ANOVA with Tukey’s HSD test (b,c,e,g,h), two-sided unpaired Student’s t-test (d) or one-sided unpaired Student’s t-test (j,k,m,n). Illustrations in a, i and j created with BioRender.com.
The absence of fructose in the caecum of inulin-fed mice can also reflect faster removal of fructose by the gut microbiome (thus, fructose disappeared quickly). To examine this possibility, we measured caecal labelled SCFAs, the most abundant metabolic products of microbial fructose catabolism15. Labelled SCFAs in caecal contents displayed similar depletion in inulin-fed mice (Fig. 3c), excluding the possibility of fast fructose catabolism by the colonic microbiome. Further supporting this notion, global untargeted metabolomics also revealed overall diminished fructose-derived labelled metabolites in the caecum of mice fed fructose and inulin (Fig. 3d). Therefore, we conclude that inulin supplementation blocks fructose spillover to the colon.
Interestingly, although fructose-derived SCFA production was reduced in the caecum of mice fed fructose and inulin (Fig. 3c), it was increased in the jejunal contents of the same mice, especially for acetate and butyrate (Fig. 3e). By comparison, neither labelled SCFAs nor total SCFAs were increased in the portal blood of mice fed both fructose and inulin from two independent mouse cohorts (Extended Data Fig. 2d,e). SCFAs such as butyrate have been suggested as host-beneficial products of microbial nutrient catabolism60. Although previous studies have shown an increase in portal SCFA levels after inulin feeding61,62,63, our data suggest that simultaneous feeding of fructose, which alters the host organs and intestinal microbial community64,65, appears to counteract this inulin effect. Together, these data suggest that inulin supplementation enhances fructose catabolism by the microbiome of the small intestine, without affecting the host’s small intestine fructose catabolism. This can lead to reduced fructose spillover to liver and colon. Given that inulin is a fructose polymer, gut microbiome using inulin as a carbon source may also boost fructose catabolism66, lowering the host’s exposure to dietary fructose.
Gut microbiome mediates inulin’s effects on reducing fructose spillover
To determine whether the gut microbiome is critical for the effects of inulin on reducing fructose spillover, we treated mice fed both inulin and fructose with an antibiotic cocktail (XIF group) (Fig. 3f). Faecal 16S rDNA copy numbers confirmed successful microbiome depletion by antibiotics treatment (Fig. 3g), without affecting body weight gain, food, water or total calorie intake (Extended Data Fig. 3a–d). We first aimed to determine whether antibiotic treatment affects hepatic fructose carbon usage for fatty acid synthesis. After oral 13C-fructose provision, 13C enrichment of hepatic acetyl CoA, the primary precursor for fatty acid synthesis, was similar between the groups (Extended Data Fig. 3e). However, circulating 13C-labelled fatty acids normalized to hepatic acetyl CoA 13C enrichment revealed that antibiotics abolished inulin’s suppressive effect on fatty acid synthesis using fructose carbons (Fig. 3h and Extended Data Fig. 3f). Liver lipidomics and qPCR analysis also indicated that antibiotic treatment reversed the impact of inulin on decreasing liver lipid contents and gene expression of DNL enzymes and fibrosis markers (Extended Data Fig. 3g–i). These data suggest that the gut microbiome mediates the advantageous impacts of inulin.
We next conducted gut microbiota transplantation experiments to determine whether inulin-mediated effects are transmittable. Donor mice were fed HFCS alone (CF) or with inulin (IF) for 1 month to ensure the adaptation of the microbiome to each diet. In the meantime, recipient mice were fed only HFCS for 1 month to induce basal DNL. Then, after treatment of antibiotics to recipient mice for 1 week, the jejunal microbiome was transplanted from each donor group to recipients every 4 days for 13 days (Fig. 3i). After the fourth transplantation, we performed 16S rRNA sequencing in the small intestinal contents of the donor versus recipient mice to compare their gut microbiome profiles. Beta diversity comparison by non-metric multidimensional scaling (NMDS) based on the Bray-Curtis index showed that CF and IF recipients resemble their respective donors on NMDS2. On the other hand, NMDS1 separates donors from recipients, probably reflecting the antibiotics pre-treatment effects on recipients (Extended Data Fig. 3j). These microbiome analysis data suggest that our jejunal microbiome transplant was successful.
Importantly, 13C-fructose tracing revealed that IF recipients exhibited higher fructose catabolism in the jejunum than CF recipients (Fig. 3j). IF recipients also showed a trend of decreased lipogenic gene expression in the liver (Fig. 3k). Given that faecal transplant is more feasible for human applications, we also examined whether the effect of inulin is transmittable by faecal microbiome. We transplanted faecal microbiome from each donor group to recipients weekly for 5 weeks, followed by oral 13C-fructose tracing in recipient mice at the terminal endpoint (Fig. 3l). IF recipients exhibited substantially lowered fructose spillover to the colon compared to CF recipients (Fig. 3m). Concomitantly, IF recipients displayed lowered production of labelled fatty acids from fructose compared to CF recipients (Fig. 3n). Therefore, the effect of inulin on suppressing colonic fructose spillover and DNL (reflecting hepatic fructose spillover) is transferable by the gut microbiome.
Hepatic metabolic rewiring by inulin under HFCS consumption
Given that inulin-fed mice showed less fructose carbon usage for fatty acid synthesis23 (Fig. 3h), we were curious about the fate of fructose carbons in their livers. To answer this question, we provided 13C-fructose (with unlabelled glucose) and performed metabolomics-based unbiased analysis in the liver to survey metabolic products derived from fructose (Fig. 4a). Unexpectedly, mice fed HFCS with inulin exhibited high labelling of glycine, serine and several serine-containing metabolites from 13C-fructose (Fig. 4b and Supplementary Table 2). Likewise, delayed inulin supplementation also exhibited an increased trend of hepatic serine and glycine synthesis from fructose (Fig. 4c). The proportions of newly synthesized serine and glycine made from fructose in inulin-fed mouse livers were substantial, at ~30% and ~15%, respectively (Fig. 4d).
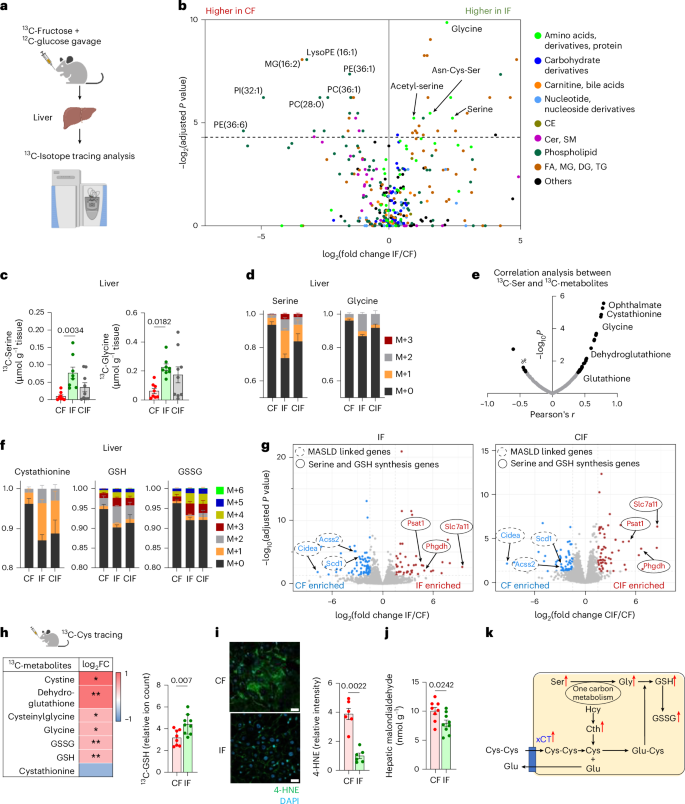
a, Schematic of 13C-fructose tracing and untargeted metabolomics in liver. b, Comparison of hepatic 13C-labelling (%) of metabolites between IF and CF, 30 min after oral provision of HFCS with 13C-labelled fructose, by Student’s t-test followed by false discovery rate correction. Different colours indicate metabolite categories. CE, cholesteryl ester; FA, fatty acid; MG, monoacylglycerol (n = 8, 8 mice). c,d, 13C-labelled abundances (c) and labelling fractions (d) of serine and glycine in liver (n = 8, 8, 9 mice). M, isotopologue. e, Correlation coefficient (r) and P values between 13C-labelled serine ion count and the indicated labelled metabolite ion counts. f, 13C-labelled fractions of the indicated metabolites in liver. GSSG, oxidized GSH (n = 8, 8, 9 mice). g, Comparison of hepatic gene expression between CF and IF (left) (n = 5, 5 mice) or CF and CIF (right) (n = 5, 4 mice). h, Comparison of 13C-labelled ion counts of the indicated metabolites between CF and IF in liver, 30 min after oral provision of 13C-Cys. *P < 0.05, **P < 0.01 (n = 8, 9 mice). FC, fold change. i, Immunofluorescence staining and quantitation of liver 4-HNE, a lipid peroxidation marker. Scale bars, 20 μm (n = 6, 6 mice). j, Hepatic malondialdehyde levels measured by TBARS assay (n = 8, 9 mice). k, Schematic of the GSH synthesis pathway. Red arrows indicate that metabolites and Slc7a11 gene (which encodes xCT) are significantly upregulated in IF compared to CF. Hcy, homocysteine; Cth, cystathionine. Data are means; error bars, s.e.m. P values determined by one-way ANOVA with Tukey’s HSD test (c), Student’s t-test followed by false discovery rate correction (b,g) or two-sided unpaired Student’s t-test (h–j). Illustrations in a and h were created with BioRender.com.
Next, we sought to determine the biological implications of activated serine and glycine synthesis in the livers of inulin-fed mice. To this end, we performed a correlation-based unbiased analysis to identify metabolites most significantly associated with increased serine synthesis. This analysis identified several metabolites in the glutathione (GSH) synthesis pathway (Fig. 4e). Indeed, liver cystathionine, GSH and oxidized GSH showed higher labelling from fructose in mice fed inulin with HFCS compared to mice fed HFCS alone (Fig. 4f).
Serine and glycine can be de novo synthesized from the glycolytic intermediate, 3-phosphoglycerate, through Phgdh (3-phosphoglycerate dehydrogenase) and Psat1 (phosphoserine aminotransferase 1)67 (Extended Data Fig. 4a). GSH, a tripeptide composed of glycine, glutamate and cysteine, requires both glycine synthesis and cystine uptake as the rate-limiting steps68,69. RNA sequencing (RNA-seq) revealed a drastic induction of cystine transporter Slc7a11 (which encodes xCT) (~41-fold), Phgdh (~tenfold) and Psat1 (~ninefold) in mice fed HFCS and inulin compared to mice fed HFCS alone (Fig. 4g and Supplementary Table 3). Delayed inulin supplementation exerted even more profound induction of Slc7a11 (~53-fold), Phgdh (~22-fold) and Psat1 (~11-fold) (Fig. 4g and Supplementary Table 3). Consistently, unsupervised pathway analysis captured glycine, serine and cysteine metabolism as one of the top upregulated pathways in mice fed HFCS with simultaneous or delayed inulin supplementation (Extended Data Fig. 4b,c). By contrast, MASLD-linked genes (including Acss2 and Scd1) and Cidea (cell death-inducing DNA fragmentation factor) were decreased by inulin supplementation (Fig. 4g and Supplementary Table 3).
To directly examine GSH synthesis, we performed oral 13C-cysteine tracing experiments. The resulting data revealed enhanced hepatic synthesis of GSH and associated metabolites from cysteine in mice fed both inulin and HFCS compared to mice fed HFCS alone (Fig. 4h). GSH is critical for resolving oxidative stress and lipid peroxidation-mediated ferroptosis. Indeed, inulin-fed mice showed decreased hepatic lipid peroxidation markers, including 4-hydroxynonenal (4-HNE), malondialdehyde70 (Fig. 4i,j and Extended Data Fig. 4d) and dihydroethidium staining (Extended Data Fig. 4e). Therefore, we concluded that inulin supplementation activates both serine and glycine synthesis and cystine uptake in liver to augment GSH synthesis and mitigate HFCS-elicited hepatic lipid peroxidation (Fig. 4k).
Inulin induces liver serine synthesis via the gut microbiome
We next sought to determine whether the effect of inulin on inducing liver serine synthesis is mediated by the gut microbiome. We performed 13C-fructose tracing after antibiotics treatment and measured liver serine synthesis (Fig. 5a). Inulin supplementation to HFCS-fed mice increased liver synthesis of serine and glycine using fructose carbons, but the effect was abolished by antibiotics (Fig. 5b,c). Moreover, antibiotics also blocked the inulin-elicited induction of serine biosynthesis genes Phgdh and Psat1 (Fig. 5d).
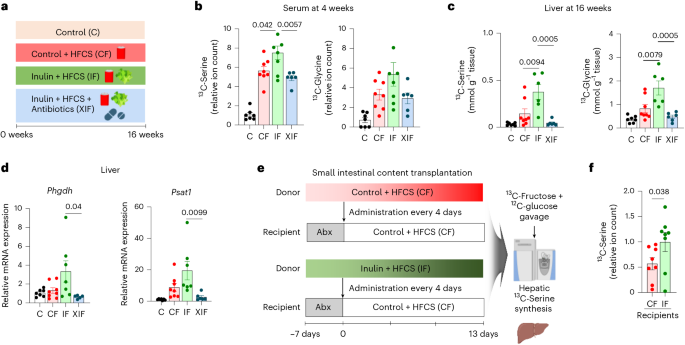
a, Experimental groups including the antibiotics-treated group (XIF). b,c, 13C-labelled abundances of serine and glycine in serum on week 4 (b) and liver on week 16 (c), 1 h after oral provision of HFCS with 13C-labelled fructose (n = 7, 8, 7, 6 mice). d, Serine synthesis gene expression in liver (n = 7, 8, 7, 6 mice). e, Schematic of jejunal microbiome transplantation experiments from donors (CF or IF) to recipients (CF after antibiotics). Abx, antibiotics. f, 13C-labelled serine abundances in liver of recipient mice (n = 8, 8 mice). Data are means; error bars, s.e.m. P values were determined by one-way ANOVA with Tukey’s HSD test (b–d) or one-sided unpaired Student’s t-test (f). Illustrations in a and e created with BioRender.com.
To further determine whether the effect of inulin on liver serine synthesis is transmittable via the microbiome, we conducted small intestinal microbiota transplant experiments from donors fed HFCS with or without inulin to recipients fed HFCS alone following antibiotics treatment (Fig. 5e). 13C-fructose tracing at the end of transplantation cycles revealed that mice that received gut microbiome from the donor mice fed HFCS with inulin showed significantly higher serine synthesis than mice that received gut microbiome from the donor mice fed HFCS alone (Fig. 5f). Therefore, the gut microbiome is both necessary and sufficient for the inulin-induced serine synthesis.
We were curious whether inulin-mediated lipogenesis reduction and serine production are mechanistically linked. To test this idea, we implemented our previously reported intestine-specific Khk-C transgenic mice, which exhibit reduced hepatic lipogenesis owing to enhanced intestinal clearance of dietary fructose16. However, we found no increase in serine synthesis in these mice (Extended Data Fig. 4f), suggesting that these two biological processes (lipogenesis suppression and serine production induction by inulin) are driven through distinct mechanisms (for example, different gut microbiome species).
B. acidifaciens contributes to inulin effects
Finally, to identify gut microbiota species that mediate inulin’s effects, we performed 16S rRNA sequencing of the contents of both the small and large intestines of mice fed control water, HFCS alone or HFCS with inulin. Linear discriminant analysis effect size revealed marked differences in the microbial composition at each taxonomic level across the groups, with a maximum depth to genus level (Fig. 6a,b). As previously reported, inulin supplementation enriched Bacteroidetes in the large intestine, which is known to be the primary degrader of polysaccharides71,72. Interestingly, consumption of either HFCS alone or with inulin increased total bacterial contents in the small intestine (Extended Data Fig. 5a). Alpha diversity or the Firmicutes to Bacteroidetes ratio was not changed (Extended Data Fig. 5a). In the large intestine, compared to mice fed HFCS alone, mice fed both HFCS and inulin showed increased total bacterial contents, with no change in alpha diversity but a decreased Firmicutes to Bacteroidetes ratio (Extended Data Fig. 5b). This suggests improved gut microbiome health by inulin, given that an increased Firmicutes to Bacteroidetes ratio is a marker of microbiome dysbiosis in patients with metabolic disease73,74,75. Therefore, reduced fructose spillover by inulin-adapted small intestinal gut microbiome may contribute to a healthy microbiome in the large intestine.
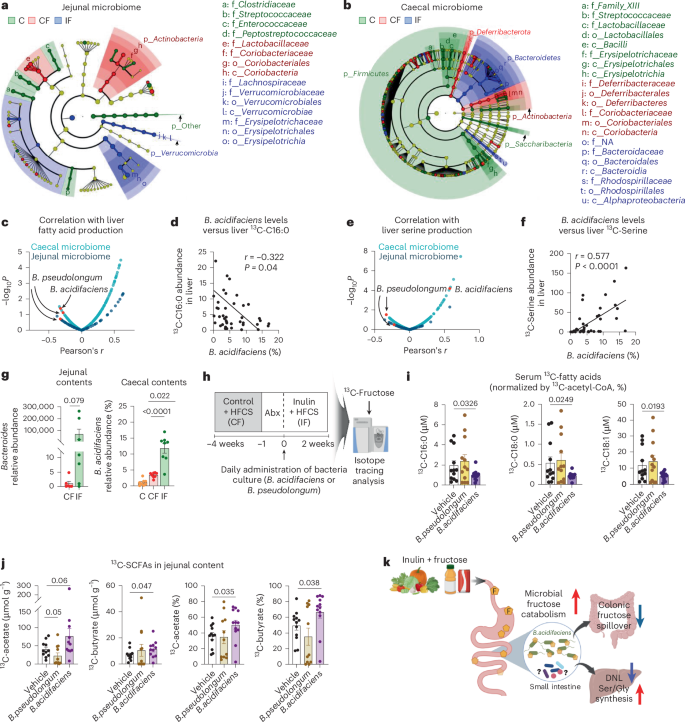
a,b, Linear discriminant analysis effect size analysis of jejunal (a) and caecal (b) microbial taxa. The cladogram shows the taxa with significant differences in abundance (from phylum to genus level) (n = 8, 8, 8 mice). c–f, Pearson correlation analysis between bacterial abundances and hepatic lipogenesis or serine synthesis. g, Relative abundance of Bacteroides spp. in jejunal contents (n = 6, 7 mice) and B. acidifaciens in caecal contents (n = 8, 8, 8 mice). h, Schematic of single-bacteria inoculation experiments. Recipient mice were fed HFCS alone for 4 weeks, followed by antibiotic treatment for 1 week. Anaerobically cultured bacteria were orally delivered to the recipient mice every day for 2 weeks while the mice received HFCS with inulin to promote bacteria survival and inulin usage. i, 13C-labelled circulating saponified fatty acids normalized to hepatic 13C-acetyl CoA fraction in the recipient mice, 1 h after oral provision of HFCS with 13C-labelled fructose (n = 12, 12, 12 mice). j, 13C-labelled concentrations (left two) and carbon fractions (right two) of the indicated SCFAs in the jejunal contents of the recipient mice, 1 h after oral provision of HFCS with 13C-labelled fructose (n = 12, 11, 12 mice). k, Proposed model of inulin’s multi-modal effects on stimulating small intestinal microbial breakdown of dietary fructose, reducing fructose spillover to colon, reducing hepatic lipogenesis and augmenting hepatic serine and GSH synthesis. Data are means; error bars, s.e.m. P values determined by one-way ANOVA with Tukey’s HSD test (g, right panel, i,j) or by one-sided unpaired Student’s t-test (g, left panel). Illustrations in k were created with BioRender.com.
From this global sequencing analysis, we next sought to identify the bacterial species contributing to inulin-induced metabolic changes in the liver. We performed a correlation-based unbiased analysis between the abundance of each bacterial species and hepatic DNL (Fig. 6c,d) or serine production (Fig. 6e,f). Although most bacterial species showed positive correlations with hepatic DNL (Fig. 6c), B. acidifaciens and Bifidobacterium pseudolongum exhibited a strong negative correlation with hepatic DNL (Fig. 6c,d), and B. acidifaciens showed a significant positive correlation with liver serine synthesis (Fig. 6e, f). Moreover, the abundance of B. acidifaciens was increased in both small and large intestines of mice fed HFCS and inulin (Fig. 6g). B. pseudolongum did not show a clear pattern (Extended Data Fig. 5c).
To determine whether these candidate gut bacteria can recapitulate inulin’s effects, we performed single-bacteria inoculation experiments. Recipient mice were fed HFCS alone for 4 weeks to induce basal DNL, followed by antibiotics treatment for 1 week (Fig. 6h). Then, each anaerobically cultured bacteria or vehicle-alone control was orally delivered to the recipient mice every day for 2 weeks while the diet was switched to HFCS with inulin to promote not only the survival of the inoculated bacteria but also their inulin usage. On the last day, we performed 13C-fructose tracing. Measurements of circulating 13C-labelled fatty acids normalized to hepatic 13C enrichment of acetyl CoA (Extended Data Fig. 5d,e) revealed that treatment with B. acidifaciens, but not B. pseudolongum or vehicle treatment, significantly decreased fatty acid synthesis from fructose (Fig. 6i). Similarly, treatment with B. acidifaciens, but not B. pseudolongum or vehicle treatment, increased 13C-labelled acetate and butyrate in the contents of the small intestine (Fig. 6j), suggesting enhanced fructose catabolism by B. acidifaciens in the small intestine. However, B. acidifaciens treatment did not affect hepatic lipid accumulation, fibrosis or serine production (Extended Data Fig. 5f–h), suggesting that other bacterial species are involved or that the treatment duration was not sufficiently long.
Lastly, we investigated whether inulin supports the growth of B. acidifaciens. Indeed, inulin provision increased the growth of B. acidifaciens more than glucose (Extended Data Fig. 5i). Additionally, B. acidifaciens grown in inulin-containing media showed enhanced fructose catabolism and subsequent production of SCFAs (Extended Data Fig. 5j). Thus, inulin-adapted B. acidifaciens boosts fructose catabolism, which can mitigate the host’s exposure to excessive fructose. Altogether, our results support the conclusion that B. acidifaciens mediates, at least in part, inulin’s effect in suppressing HFCS-induced hepatic DNL by breaking down dietary fructose in the small intestine (Fig. 6k).
Discussion
One of the clinical concerns of HFCS-induced pathologies is lean MASLD, which poses diagnostic challenges owing to the absence of significant weight gain. Lean patients with MASLD, therefore, have high risks of disease progression to MASH, cirrhosis and HCC without timely disease management. The causal mechanisms between excessive fructose consumption and lean MASLD have been extensively studied in animal models16,48,76. By contrast, studies on protective factors such as dietary fibres like inulin have been primarily performed in epidemiology or focused on the microbiome, specifically in the colon or faeces77,78,79. Upon investigating the interactions between these two common dietary components (fructose and inulin), we identified an unexpected microbe–host interaction mechanism by which inulin enhances fructose breakdown by the small intestinal microbiota (Fig. 6k). Even after hepatic steatosis has developed owing to HFCS through increased DNL and suppressed FAO via CPT1 (ref. 80), delayed inulin supplementation is sufficient to reverse it. Further human studies will be critical to determine the optimal amount of inulin in the diet and consumption durations that exhibit these protective effects.
Chemically, inulin is a soluble dietary fibre composed of one glucose molecule and numerous (~20–100) fructose molecules. Accordingly, when bacteria use inulin as a carbon source, they must activate enzyme machinery to break down fructose after cleaving inulin into monomeric fructose molecules. Indeed, in vitro cultured gut bacteria grown with inulin increase enzymes required for fructose degradation, such as β-fructofuranosidase, sucrose-6-phosphatase and phosphofructokinase66,81. Similarly, our in vivo and in vitro data suggest that when inulin-adapted gut microbiota encounter monomeric fructose, they effectively catabolize it, thereby reducing the host’s fructose exposure and mitigating metabolic consequences.
Through gut microbiome sequencing, in vivo isotope tracing and a correlation-based, unbiased approach, we identified B. acidifaciens as one of the contributors to these inulin-mediated effects. The abundance of B. acidifaciens was shown to be increased in the faeces of an inulin-fed MASH mouse model31. Our data suggest that B. acidifaciens also increases in both the small and large intestines after consumption of inulin and HFCS. This may indicate that B. acidifaciens can outgrow in the inulin-enriched intestinal microenvironment, even in the presence of incoming dietary HFCS. Intriguingly, B. acidifaciens has been found to prevent obesity in mice by promoting various hormones, including glucagon-like peptide 1 (GLP-1)82 and to alleviate concanavalin A-induced liver injury by blocking CD95 signalling83, although these studies have been performed in the absence of HFCS feeding. Our study suggests a mechanism by which inulin-adapted B. acidifaciens eliminates dietary fructose, thereby suppressing metabolic dysfunctions, regardless of obesity or exposure to hepatotoxic drugs.
In addition to fructose catabolism in the intestine, inulin supplementation also changes the fate of fructose carbons in the liver by redirecting the usage of fructose carbons to serine, glycine and GSH synthesis. Previous studies have observed lower glycine levels in individuals with MASLD84,85. In addition, depletion of glycine results in GSH deficiency, increasing susceptibility to oxidative stress and hepatic steatosis86. Given that hepatic glycine homoeostasis is regulated by Shmt2 (serine hydroxymethyltransferase 2)87, these and other studies have focused on the role of Shmt2 in MASLD86,87,88. Intriguingly, our RNA-seq data indicated that inulin supplementation does not affect the gene expression of Shmt2. Instead, inulin supplementation, in a microbiome-dependent manner, drastically increases Phgdh and Psat1, the key de novo serine synthesis pathway enzymes. Furthermore, inulin also activates transcription of Slc7a11, the cystine transporter, which can enhance GSH synthesis and block hepatic lipid peroxidation.
We then asked what mechanism might underlie serine biosynthesis induced by inulin. Decreased fructose spillover to the liver or lipogenesis is less likely to be the mechanism because intestine-specific Khk-C transgenic mice that exhibit lower fructose spillover and lipogenesis do not show increased serine synthesis (Extended Data Fig. 4f)16. Notably, antibiotics block inulin-induced serine synthesis, while B. acidifaciens suppresses lipogenesis without inducing serine synthesis. Therefore, other inulin-dependent microbiome species may signal to the liver to boost serine synthesis. Another remaining question surrounds the relative contribution of reduced lipogenesis and enhanced serine synthesis to inulin-mediated protective effects. Determining the contributions of each pathway would require future studies using genetically modified mouse models such as hepatocyte-specific Phgdh knockout mice.
Ultimately, it will be crucial to determine whether long-term provision of B. acidifaciens is sufficient to reverse hepatic steatosis and fibrosis and whether sexual dimorphism exists in inulin action, as our study used only males. To summarize, our findings on the effects of inulin in shifting fructose catabolism away from host organs and toward the small intestinal microbiome pave the way for protecting the host’s health by allowing the gut microbiome to consume toxic dietary nutrients.
Methods
Mouse studies
Animal studies followed protocols approved by the Institutional Animal Care and Use Committee of the University of California, Irvine (AUP-22-121). Male C57BL/6 mice (8 weeks old) were purchased from Jackson Laboratory. The duration of each experiment (for example, diet feeding) is indicated in the figure legends. In this study, only males were used because MASLD is more prevalent in men than women. Generation of Khk-C transgenic mice was previously reported in ref. 16. Mice were group-housed on a normal light–dark cycle (07:00–19:00 h) with free access to chow and water. We modified the open-source diet (Research Diets, D11112201) to reduce dextrose in the diet and replace corn starch with inulin. Mice were fed either a control (Research Diets, D21050401) or 10% (gm%) inulin diet (Research Diets, D21050402). The composition of both diets is shown in Supplementary Table 1. For HFCS provision, mice were provided either normal drinking water or 15% (weight/weight) fructose and 15% glucose mixture in drinking water. Animals were randomly assigned to experimental groups, and no specific method of randomization was used. No statistical methods were used to pre-determine sample sizes, but our sample sizes are similar to those reported in previous publications15,16. Unless otherwise indicated, experiments were replicated independently at least twice.
Daily water and food intake were determined by measuring the total consumption in a cage divided by the number of mice in the cage. For antibiotic treatment, a cocktail of antibiotics, including 0.5 g l−1 ampicillin, neomycin, metronidazole and 0.25 g l−1 vancomycin, was dissolved in HFCS-water. For gut bacteria transplantation, faecal or small intestinal contents (200 mg) were freshly collected from donor mice at 09:00–10:00 h using sterilized utensils and microcentrifuge tubes. The samples were immediately dissolved in 2 ml of sterilized anaerobic PBS containing 0.1 g l−1 of l-cysteine. The materials were then homogenized using sterilized pellet pestles and centrifuged at 500g for 3 min at 20 °C to remove particulate matter, based on studies by others that performed gut bacteria transplantation89,90,91. The resulting bacterial supernatant was supplemented with 10% sterilized glycerol and then transferred to antibiotic-treated recipient mice by oral gavage (200 µl per mouse) with a plastic feeding tube (Instech Laboratories) on the same day. The remaining solution was stored at −80 °C until use for oral gavage. Gut bacteria transplantation was performed weekly for 5 weeks for faeces (five times) and every 4 days for 13 days for jejunal contents (four times). For measurement of circulating levels of 2H-labelled fatty acid using 2H2O, mice received 2H2O dissolved in 0.9% NaCl by intraperitoneal injection (30 µl g−1) at 10:00 h. Mice were transferred to new cages without food. At 16:00 h, serum was collected by tail snip. For measurement of DNL flux, mice received 2H2O dissolved in 0.9% NaCl by intraperitoneal injection (30 µl g−1) at 18:00 h and serum was collected via tail snip at 09:00 h the following morning. For 13C-fructose tracing, mice received a solution of unlabelled glucose and 13C-fructose (2 g kg−1 body weight each) by oral gavage (10 µl g−1 body weight) at 09:00 h. For 13C-cysteine tracing, mice received a solution of 0.2 M 13C-cysteine by oral gavage (5 µl g−1 body weight) at 09:00 h. At 10:00 h, tail blood and tissues were collected. Intestine-specific Khk-C transgenic mice received a solution of unlabelled glucose and 13C-fructose (2 g kg−1 body weight each) by oral gavage (10 µl g−1 body weight) at 09:00 h, and liver tissues were collected at 10:00 h. Tail blood was collected by tail snip to measure circulating metabolites after different durations. Tissues were quickly dissected and snap-frozen in liquid nitrogen with a pre-cooled Wollenberger clamp. Multiple cohorts were used, and data were combined if there was no statistical difference between cohorts. For fasting glucose and insulin measurements, serum was collected after 10 h of fasting (08:00–18:00 h) by tail snip, glucose was measured using liquid chromatography–mass spectrometry (LC–MS) and insulin was measured using an Ultra Sensitive Mouse Insulin ELISA Kit (cat. no. 90080; Crystal Chem).
Bacterial culture
B. acidifaciens (DSM 15896) was purchased from a German collection of microorganisms and cell cultures. B. pseudolongum (ATCC 25526) was obtained from American Type Culture Collection. B. acidifaciens was cultured on Columbia CNA agar medium containing sheep blood (Thermo Scientific) and chopped meat medium (CMM; Fisher Scientific) at 37 °C in the EZ Anaerobe Container System (BD). B. pseudolongum was cultured on modified BHI agar and broth (BD) at 37 °C in the EZ Anaerobe Container System (BD). To measure the growth of B. acidifaciens in response to inulin, PBS, 0.4 g l−1 glucose (Sigma-Aldrich) or 0.4 g l−1 inulin (Sigma-Aldrich) was added to 60% v/v CMM. B. acidifaciens was inoculated, and optical density at 600 nm was measured using a microplate reader (Victor). To measure the fructose catabolic activity of B. acidifaciens, the bacterium was cultured in CMM + glucose or CMM + inulin until the early stationary phase, washed with PBS and then the bacterial pellets were resuspended to the same optical density in CMM + glucose or CMM + inulin supplemented with 0.1 g l−1 13C-fructose for a 3 day culture. To prepare a bacterial solution for oral delivery to mice, bacterial cultures were centrifuged and washed with PBS after 72 h of incubation. The bacterial pellets were resuspended in 25% (v/v) glycerol and stored at −80 °C before oral gavage to mice; 25% glycerol without any bacterium was used for the control. After HFCS provision and antibiotics treatment as described above, 200 µl of bacteria solution and glycerol were transferred to recipient mice by oral gavage (200 µl per mouse) with a plastic feeding tube (Instech Laboratories) every day for 2 weeks.
Histology
Freshly collected liver tissues were fixed in 4% paraformaldehyde overnight, embedded in paraffin, sectioned and stained with haematoxylin and eosin (H&E). Tissues were submitted to the Experimental Tissue Shared Resource Facility at the University of California Irvine. For trichrome staining, Gomori’s Trichrome Stain Kit (Polysciences) was used. Images were captured with a high-resolution image scanner (Ventana DP200, Roche). Hepatic lipid accumulation was quantified by analysing the digital slides using QuPath (v.0.4.4)92. A pixel classifier was trained from representative images among the groups. This pixel classifier was then applied to annotations of the same size within each slide. These regions were measured, and the area values (in μm2) for the regions classified as lipids were used.
Indirect calorimetry, 13C FAO analysis and echo magnetic resonance imaging
O2 consumption, CO2 release, respiratory exchange ratio, locomotor activity and heat production were monitored for individually housed mice using Phenomaster metabolic cages (TSE Systems). The climate chamber was set to 21 °C and 50% humidity, with a 12–12 h light–dark cycle (07:00–19:00 h) as the home-cage environment. Animals were entrained for 24 h in the metabolic cages before the start of each experiment to allow for environmental acclimation. Data were collected at 40 min intervals, and each cage was recorded for 3.25 min before time point collection. For measuring 13CO2, environmental levels of 13CO2 and total CO2 in the sealed cages were calibrated to ±1.1% 13CO2, as the natural abundance of 13C. Body composition was measured using an EchoMRI Whole Body Composition Analyzer, which provides whole-body fat and lean mass measurements. To account for potential changes in 13CO2 loss caused by CO2 fixation reactions (for example, those catalysed by pyruvate carboxylase or urea carboxylase)56,57, 13CO2 production was measured using indirect calorimetry after 13C-acetate administration. In brief, mice were fasted for 6 h and administered 13C-acetate by oral gavage (0.3 mg g−1 body weight), and 13CO2 recovery was measured for individually housed mice using Phenomaster metabolic cages (TSE Systems). Under the same conditions, we performed oral 13C-palmitate administration and 13CO2 measurements. To estimate the oxidation of the total circulating palmitate pool from circulating triglycerides and exogenous 13C-palmitate, we measured circulating un-esterified 13C-palmitate enrichment (%) in serial time points and used these values to normalize 13CO2 (ref. 58).
Quantitative PCR with reverse transcription
RNA samples were prepared using TRIzol Reagent (Invitrogen) according to the manufacturer’s instructions. RNA was reverse-transcribed to cDNA using the iScript kit (Bio-Rad). The resulting cDNA was analysed by qPCR with reverse transcription using SYBR green master mix (Life Technologies) on a QuantStudio6 Real-Time PCR system (Life Technologies). Relative mRNA expression was calculated from the comparative threshold cycle values relative to housekeeping genes Actin, 36b4 and Tbp. Primer sequences were: Tgfb1 (forward, CTCCCGTGGCTTCTAGTGC; reverse, GCCTTAGTTTGGACAGGATCTG), Acta2 (forward, ATGCTCCCAGGGCTGTTTTCCCAT; reverse, GTGGTGCCAGATCTTTTCCATGTCG), Vim (forward, TTTCTCTGCCTCTGCCAAC; reverse, TCTCATTGATCACCTGTCCATC), Col1a1 (forward, GCTCCTCTTAGGGGCCACT; reverse, CCACGTCTCACCATTGGGG), Mmp13 (forward, CTTCTTCTTGTTGAGCTGGACTC; reverse, CTGTGGAGGTCACTGTAGACT), Glut5 (forward, TCTTTGTGGTAGAGCTTTGGG; reverse, GACAATGACACAGACAATGCTG), Khk-a (forward, TTGCCGATTTTGTCCTGGAT; reverse, CCTCGGTCTGAAGGACCACAT), Khk-c (forward, TGGCAGAGCCAGGGAGAT; reverse, ATCTGGCAGGTTCGTGTCGTA), Aldob (forward, CACCGATTTCCAGCCCTC; reverse, GTTCTCCACCTTTATCCTTTGC), Tkfc (forward, GCATCTCAGAGCAGAAGTGTG; reverse, CAAGTCAGGGTTAGAGGCTAC), Acly (forward, CAGCCAAGGCAATTTCAGAGC; reverse, CTCGACGTTTGATTAACTGGTCT), Acss2 (forward, ATGGGCGGAATGGTCTCTTTC; reverse, TGGGGACCTTGTCTTCATCAT), Fasn (forward, GGAGGTGGTGATAGCCGGTAT; reverse, TGGGTAATCCATAGAGCCCAG), Scd1 (forward, TTCAGAAACACATGCTGATCCTCATAATTCCC; reverse, ATTAAGCACCACAGCATATCGCAAGAAAGT), Tbp (forward, CCCTATCACTCCTGCCACACCAGC; reverse, GTGCAATGGTCTTTAGGTCAAGTTTAC), Actin (forward, CCCTGTATGCTCTGGTCGTACCAC; reverse, GCCAGCCAGGTCCAGACGCAGGATG) and 36b4 (forward, GGAGCCAGCGAGGCCACACTGCTG; reverse, CTGGCCACGTTGCGGACACCCTCC).
Mitochondria and cytosolic fractionation
To isolate liver mitochondria93, freshly isolated mouse liver was weighed and rapidly extracted and homogenized in ice-cold liver homogenization buffer (1 ml per 200 mg of liver; 200 mM sucrose, 5 mM Tris, 1 mM EGTA, 100 μg ml−1 digitonin pH 7.4), followed by centrifugation at 1000g for 1 min at 4 °C. The resulting 200 μl supernatants were combined with 500 μl spin buffer (150 mM sucrose, 5 mM Tris, 1 mM EGTA, 25 mM ammonium bicarbonate pH 7.4) to reduce suspension density. Each 700 μl mixture was carefully layered above 300 μl liver oil mix (60:40 silicone oil to dioctyl phthalate; density, 1.066 g ml−1 at 20–23.5 °C) and 100 μl of 23% glycerol in pre-mixed tubes, then centrifuged at 9,727g for 1 min at 4 °C. The cytosolic layer and most of the oil were aspirated, and the remaining oil was removed after freezing the lower layer in a dry ice–ethanol bath and washing with dry ice–cold hexane. The mitochondrial pellets were pooled to obtain the final sample.
Mitochondrial DNA analysis
For mtDNA copy number analysis, 50 ng of DNA was extracted with the Purelink Genomic DNA Mini (Invitrogen), and qPCR was performed with a pair of primers for mtDNA (MT-16S rRNA-ND1) with 18S for normalization. The following primers were used: MT-16S-ND1 (forward, CACCCAAGAACAGGGTTTGT; reverse, TGGCCATGGGTATGTTGTTAA) and 18S (forward, TAGAGGGACAAGTGGCGTTC; reverse, CGCTGAGCCAGTCAGTGT).
RNA-seq analysis
RNA samples were prepared using TRIzol Reagent (Invitrogen) according to the manufacturer’s instructions. RNA concentration was quantified using fluorimetry (Qubit 2.0 fluorometer; Life Technologies), and quality was assessed using an Agilent BioAnalyzer 2100 (Agilent Technologies). Ribosomal RNA depletion and sample library preparation were performed using the Illumina TruSeq Stranded Total RNA with RiboZero. The libraries were then sequenced on a NovaSeq 6000 (Illumina) using paired-end sequencing. The quality of the raw sequencing data was assessed using FastQC, and all samples passed the quality control analysis. Raw sequencing reads were aligned to the mouse reference genome mm10 (GRCm38) using STAR, and RNA-seq counts were obtained using featureCounts. These raw counts were further analysed using DESeq2 for differential gene expression analysis. To elucidate the biological pathways involved in our study, we used Kyoto Encyclopedia of Genes and Genomes pathway enrichment analysis using Fisher’s exact test. For gene-set enrichment analysis, gene sets from the Molecular Signatures Database (v.2023.2) were used.
Metabolite measurements using LC–MS
For aqueous metabolites extraction, serum (5 µl) was mixed with 150 µl of extraction solvent (40:40:20 methanol:acetonitrile:water, v:v:v) at −20 °C, vortexed and immediately centrifuged at 16,000g for 10 min at 4 °C. The supernatant (70 µl) was collected for LC–MS analysis. Frozen tissue samples were ground at liquid nitrogen temperature with a CryoMill (Retsch). The resulting tissue powder (approximately 20 mg) was weighed and then mixed with −20 °C extraction solvent containing 0.5% formic acid (40 µl per mg tissue), vortexed and neutralized with 15% NH4HCO3 (3.5 µl per mg tissue). Following vortexing and centrifugation at 16,000g for 10 min at 4 °C, the supernatant (70 µl) was loaded into LC–MS vials. Metabolites were analysed by a quadrupole–orbitrap mass spectrometer (Q-Exactive Plus Hybrid Quadrupole–Orbitrap, Thermo Fisher) coupled to hydrophilic interaction chromatography by heated electrospray ionization. LC separation was performed on an Xbridge BEH amide column (2.1 mm × 150 mm, 2.5 µm particle size, 130 Å pore size; Waters) at 25 °C using a gradient of solvent A (5% acetonitrile in water with 20 mM ammonium acetate and 20 mM ammonium hydroxide) and solvent B (100% acetonitrile). The flow rate was 150 µl min−1. The LC gradient was: 0 min, 90% B; 2 min, 90% B; 3 min, 75% B; 7 min, 75% B; 8 min, 70% B; 9 min, 70% B; 10 min, 50% B; 12 min, 50% B; 13 min, 25% B; 14 min, 20% B; 15 min, 20% B; 16 min, 0% B; 20.5 min, 0% B; 21 min, 90% B; and 25 min, 90% B. Autosampler temperature was set at 4 °C and the injection volume of the sample was 3 μl. MS analysis was acquired in negative and positive ion modes with Full MS scan mode from m/z 70 to 830 and 140,000 resolution with the following operational parameters: AGC target, 3 × 10⁶; maximum IT, 500 ms; sheath gas flow rate, 40; aux gas flow rate, 10; sweep gas flow rate, 2; spray voltage, +3.8 kV and −3.5 kV; spray current, 33 μA; capillary temperature, 300 °C; s-lens RF level, 50; aux gas heater temperature, 360 °C. MS2 analysis was acquired in negative and positive ion modes with Full MS/dd-MS2 from m/z 70 to 830. For full MS, the parameters were: resolution, 70,000; AGC target, 1 × 10⁶; maximum IT, 200 ms. For MS/dd-MS2, the parameters were: resolution, 17,500; AGC target, 1 × 10⁵; maximum IT, 50 ms; loop count, 15; isolation window, 1.2 m/z; stepped CE, ±20 and 50 eV with the following operational parameters: sheath gas flow rate, 40; aux gas flow rate, 10; sweep gas flow rate, 2; spray voltage, +3.8 kV and −3.5 kV; spray current, 33 μA; capillary temperature, 300 °C; s-lens RF level, 50; aux gas heater temperature, 360 °C. Data were analysed using the EI-MAVEN software and Compound Discoverer software (Thermofisher Scientific). The identity of metabolites was confirmed based on the retention time and accurate m/z of authentic synthesized chemical standards from Sigma-Aldrich, as well as MS2 fragmentation patterns available in HMDB (https://hmdb.ca) and mzCloud database (https://www.mzcloud.org). Natural isotope correction was performed with AccuCor2 R code (https://github.com/wangyujue23/AccuCor2). Labelled ion counts refer to the sum of all labelled forms, in which each form is weighted by the fraction of carbon atoms labelled. It is used to calculate fractional carbon labelling (%) by normalizing against the ion count of the total pool. The concentrations of selected metabolites were determined by calibration curves using authentic synthesized standards. The metabolite concentrations in tissues or intestinal contents were calculated using the following equation: concentration (μmol g−1) = concentration of extracted sample (μM) × volume of extraction solution (μl) / tissue weight (mg).
Lipid measurements using LC–MS
For lipid extraction, samples were mixed with −20 °C isopropanol (150 µl per 5 µl serum and 40 µl per mg tissue), vortexed and immediately centrifuged at 16,000g for 10 min at 4 °C15. The supernatant (70 µl) was loaded into LC–MS vials. Lipids were analysed by a quadrupole–orbitrap mass spectrometer (Q-Exactive Plus Hybrid Quadrupole–Orbitrap) coupled to reverse-phase chromatography with electrospray ionization. LC separation was on an Atlantis T3 Column (2.1 mm × 150 mm, 3 µm particle size, 100 Å pore size; Waters) at 45 °C using a gradient of solvent A (1 mM ammonium acetate, 35 mM acetic acid in 90:10 water:methanol) and solvent B (1 mM ammonium acetate, 35 mM acetic acid in 98:2 isopropanol:methanol). The flow rate was 150 µl min−1. The LC gradient was: 0 min, 25% B; 2 min, 25% B; 5.5 min, 65% B; 12.5 min, 100% B; 16.5 min, 100% B; 17 min, 25% B; and 30 min, 25% B. MS analysis was acquired in positive ion mode with Full MS and MS/dd-MS2 scan mode from m/z 290 to 1,200. The MS operational parameters and data analysis are the same as for the metabolite analysis.
Saponified fatty acid measurement using LC–MS
Serum (5 µl) or liver powder (20 mg) was incubated with 0.5 ml of 0.3 M KOH in 90% methanol at 80 °C for 1 h in a 2 ml glass vial. Then, formic acid (50 µl) was added for neutralization. The saponified fatty acids were extracted by adding 500 µl of hexane and vortexing. After 5 min for separation of the layers, 250 µl of the top hexane layer was transferred to a new glass vial. Samples were then dried under a nitrogen gas stream and redissolved in 100 µl (for serum) or 500 µl (for liver) of 1:1 isopropanol:methanol for LC–MS analysis15. Fatty acids were analysed by a quadrupole–orbitrap mass spectrometer (Q-Exactive Plus Hybrid Quadrupole–Orbitrap) coupled with reverse-phase chromatography with electrospray ionization. LC separation was performed on an Atlantis T3 Column (2.1 mm × 150 mm, 3 µm particle size, 100 Å pore size; Waters) at 45 °C using a gradient of solvent A (1 mM ammonium acetate, 35 mM acetic acid in 90:10 water:methanol) and solvent B (1 mM ammonium acetate, 35 mM acetic acid in 98:2 isopropanol:methanol). The flow rate was 150 µl min−1. The LC gradient was: 0 min, 25% B; 2 min, 65% B; 5.5 min, 100% B; 16.5 min, 100% B; 16.5 min, 25% B with a flow rate of 200 µl min−1; 19 min, 25% B with a flow rate of 200 µl min−1; 19.1 min, 25% B with a flow rate of 150 µl min−1; and 20 min, 25% B. MS analysis was acquired in negative ion mode with Full MS scan mode from m/z 200 to 530. The MS operational parameters and data analysis are the same as for the metabolite analysis
Body water enrichment and DNL calculation
To quantify body water enrichment, 5 μl of serum, 5 μl of water, 4 μl of 1 M sodium hydroxide and 10 μl of acetone were mixed in a glass vial and incubated overnight at room temperature to promote 2H exchange between 2H2O in serum and acetone94. The resulting 2H-acetone was derivatized to 2,4-dinitrophenylhydrazine (2,4-DNPH)95. The 2,4-DNPH solution was prepared by dissolving 20 mg of 2,4-DNPH in 10 ml of ethanol with 100 μl of H2SO4 and 150 μl of water. The precipitate formed upon mixing was then isolated by filtration (cat. no. 09-790-D; Fisher Scientific). The filtrate was treated with 1 ml of H2SO4, and 5 μl of this solution was mixed with 20 μl of the sample solution. After a 2 h incubation at room temperature, 200 μl of ethanol was added, and the samples were transferred to 1.5 ml tubes for centrifugation at 4 °C for 20 min. The clear supernatant was transferred into a glass vial for LC–MS analysis. 2H1 acetone and unlabelled acetone were measured by LC–MS analysis, using the same method as for SCFA analysis (see below), and were used to calculate the fraction of 2H1 acetone. Calibration standards of known 2H fraction water were prepared by mixing naturally labelled water and 99.9% 2H2O. The 2H1 acetone fraction of 2H2O serial dilution in naturally labelled water was used to generate a standard curve. Then, the 2H1 acetone fraction in the serum samples was substituted into the standard curve equation to calculate body water enrichment, as previously described53,96. The contribution of fatty acid synthesis was determined using equation (1).
$$\mathrm{DNL} = \frac{{2\atop}\mathrm{H}\text{-labeled palmitate enrichment}}{\text{body water enrichment} \times \text{number of exchangeable hydrogens}}$$
(1)
2H-labelled palmitate enrichment was calculated using equation (2), where 2H1, 2H2 and 2H3 indicate the 2H-labelled fraction of each isotopologue.
$${\scriptstyle{2}\atop}{\rm{H}}\,{\rm{enrichment}}={\scriptstyle{2}\atop}{\rm{H}}_{1}+\left({\scriptstyle{2}\atop}{\rm{H}}_{2}\,{\times}\,2\right)+\left({\scriptstyle{2}\atop}{\rm{H}}_{3}\,{\times}\,3\right)$$
(2)
The number of exchangeable hydrogens (n) was calculated using the fractions of 2H1 and 2H2 palmitate as in equation (3). The rate of DNL per hour was determined by dividing the time elapsed since 2H2O administration.
$$\frac{{\scriptstyle{2}\atop}{\rm{H}}_{2}}{{2\atop}{\rm{H}}_{1}}=\frac{(n-1)}{2}\times \frac{{\rm{body}}\,{\rm{water}}\,{\rm{fraction}}}{(1-{\rm{body}}\,{\rm{water}}\,{\rm{fraction}})}$$
(3)
SCFA measurement using LC–MS
Serum (5 µl) or intestinal content (1 mg) was mixed with derivatizing reagent (100 µl) and incubated for 1 h at 4 °C. The derivatizing reagent was prepared by mixing 12 mM N-(3-dimethylaminopropyl)-N′-ethylcarbodiimide, 25 mM 3-nitrophenylhydrazine and pyridine (4% v/v) in 40:40:20 methanol:acetonitrile:water (v/v/v). Samples were centrifuged at 16,000g for 10 min at 4 °C, and 10 µl of supernatant was mixed with 90 µl of the quenching reagent (0.5 mM β-mercaptoethanol in water). After centrifugation at 16,000g for 10 min at 4 °C, the supernatants were collected for LC–MS analysis. SCFAs were analysed using a quadrupole–orbitrap mass spectrometer (Q-Exactive Plus Hybrid Quadrupole–Orbitrap) coupled with reverse-phase chromatography with electrospray ionization. LC separation was performed on an Atlantis T3 Column (2.1 mm × 50 mm, 3 µm particle size, 100 Å pore size; Waters) using a gradient of solvent A (water) and solvent B (methanol) at 60 °C. The flow rate was 300 µl min−1. The LC gradient was: 0 min, 10% B; 2.3 min, 80% B; 3.6 min, 80% B; 3.7 min, 10% B; and 5 min, 10% B. MS analysis was acquired in negative ion mode with Full MS scan mode from m/z 100 to 300. The MS operational parameters and data analysis are the same as for the metabolite analysis.
Malondialdehyde measurement using LC–MS
Malondialdehyde in liver tissue (10 mg) was mixed with 20 µl of butylated hydroxytoluene solution (1 g l−1 in ethanol) and 220 µl of 50% ethanol solution97. Samples were centrifuged at 16,000g for 10 min at 4 °C, and 200 µl of supernatant was mixed with 200 µl of 2,4-dinitrophenyl-hydrazine solution (0.05 M in acetonitrile:acetic acid 9:1 (v/v)). After incubating samples for 2 h at 60 °C, the samples were mixed with 530 µl of water and 1 ml of hexane. Samples were vortexed and incubated for 10 min at 25 °C to separate the layers. Then, 500 µl of the top hexane layer was transferred to a new glass vial. Samples were then dried under a nitrogen gas stream and redissolved in 200 µl of acetic acid solution (0.03% in acetonitrile:water 4:6 (v/v)). After centrifugation at 16,000g for 10 min at 4 °C, 150 µl of the supernatant was collected for LC–MS analysis. Malondialdehyde was analysed using a quadrupole–orbitrap mass spectrometer (Q-Exactive Plus Hybrid Quadrupole–Orbitrap) coupled to reverse-phase chromatography with electrospray ionization. LC separation was performed on an Atlantis T3 Column (2.1 mm × 150 mm, 3 µm particle size, 100 Å pore size; Waters) at 45 °C using a gradient of solvent A (1 mM ammonium acetate, 35 mM acetic acid in 90:10 water:methanol) and solvent B (1 mM ammonium acetate, 35 mM acetic acid in 98:2 isopropanol:methanol). The flow rate was 150 µl min−1. The LC gradient was: 0 min, 25% B; 2 min, 100% B; 5 min, 100% B; 11.5 min, 100% B; 11.6 min, 25% B; and 15 min, 25% B. MS analysis was acquired in negative ion mode with Full MS scan mode from m/z 200 to 400. The MS operational parameters and data analysis are the same as for the metabolite analysis. Malondialdehyde was also quantified using a thiobarbituric acid reactive substances (TBARS) assay kit (10009055, Cayman Chemical).
Immunofluorescence imaging
Tissue samples were fixed in 4% buffered paraformaldehyde for 1 h at room temperature. After fixation, tissues were dehydrated with 30% sucrose in PBS overnight, frozen and embedded in Frozen Section Media (Leica) and cut into 20 μm-thick sections using a Cryocut Microtome (Leica). The samples were then blocked in protein block serum (Agilent) with 0.3% Triton X-100 (Thermo Fisher) for 1 h. For 4-HNE staining, the sections were incubated overnight at 4 °C with anti-4-HNE antibody (clone 12F7; Invitrogen, 1:200) in antibody diluent (Agilent), then with anti-mouse secondary antibody conjugated to Alexa Fluor 488 (1:1,000; Jackson ImmunoResearch) for 2 h at room temperature. For reactive oxygen species staining, the sections were incubated with 5 µM dihydroethidium (309800, Sigma-Aldrich) for 30 min at 37 °C. After staining, the samples were washed three times for 10 m each in PBS with 0.3% Triton X-100. Finally, tissue sections were mounted with Vectashield plus DAPI (4′,6-diamidino-2-phenylindole) (Vector Labs) and imaged with an LSM 980 confocal microscope (Zeiss).
Bacteria 16S rDNA quantification
Bacterial DNA was extracted from faecal pellets (10–20 mg) using Quick-DNA Faecal/Soil Microbe Kits (Zymo Research) according to the manufacturer’s instructions. Purified DNA was amplified by qPCR using SYBR green master mix (Life Technologies) on a QuantStudio6 Real-Time PCR system (Life Technologies). DNA from the E. coli DH5a strain was used as a standard for determining the copy number of the 16S rDNA gene of universal bacteria by qPCR. Primer pairs targeting the bacterial universal 16S rRNA gene, Bacteroides spp. and B. pseudolongum were selected from previous studies98,99 as follows: bacterial universal 16S rRNA gene (forward, GTGGTGCACGGCTGTCGTCA; reverse, ACGTCATCCACACCTTCCTC), B. pseudolongum (forward, CRATYGTCAAGGAACTYGTGGCCT; reverse, GCTGCGAMGAKACCTTGCCGCT) and Bacteroides spp. (forward, CTGAACCAGCCAAGTAGCG; reverse, CCGCAAACTTTCACAACTGACTTA). Relative bacterial abundances of Bacteroides spp. and B. pseudolongum were calculated from threshold cycle values relative to universal bacterial abundance in each sample.
16S rRNA gene amplicon sequencing and analysis
The ZymoBIOMICS-96 MagBead DNA Kit (Zymo Research) was used to extract DNA from mouse jejunal or caecal contents. Bacterial 16S ribosomal RNA gene-targeted sequencing was performed using the Quick-16S NGS Library Prep Kit (Zymo Research). The bacterial 16S primers amplified the V3–V4 region of the 16S rRNA gene. The sequencing library was prepared using an innovative library preparation process in which PCR reactions were performed in real-time PCR machines to control cycles and, therefore, limit PCR chimera formation. The final PCR products were quantified with qPCR fluorescence readings and pooled together based on equal molarity. The final pooled library was cleaned with the Select-a-Size DNA Clean & Concentrator (Zymo Research), then quantified with TapeStation (Agilent Technologies) and Qubit (Thermo Fisher Scientific). The final library was sequenced on Illumina MiSeq with a v3 reagent kit (600 cycles). The sequencing was performed with 10% PhiX spike-in. Unique amplicon sequence variants were inferred from raw reads using the DADA2 pipeline. Taxonomy assignment was performed using Uclust from Qiime (v.1.9.1) with the Zymo Research 16S reference database. Composition visualization, alpha diversity and beta diversity analyses were performed with Qiime (v.1.9.1). Taxonomy that has significant abundance among different groups was identified by linear discriminant analysis effect size using default settings. To compare microbiome diversity among donor and recipient mice of the jejunal content transplant experiment, NMDS analysis based on Bray-Curtis dissimilarities was performed using Microbiome Analyst (v.2.0). Amplicon sequence variants were used to plot for NMDS analysis in Extended Data Fig. 3j.
Statistical analysis
Data collection and analysis were not performed blind to the conditions of the experiments. Data distribution was assumed to be normal, but this was not formally tested. Tukey’s HSD test and two-sided or one-sided Student’s t-test were used to calculate P values, with P < 0.05 considered significant. False discovery rate correction was performed for metabolomics with the Benjamini and Hochberg method. Outliers were defined as values more than 1.5 times the interquartile range below quartile 1 or above quartile 3 (ref. 100).
Reporting summary
Further information on research design is available in the Nature Portfolio Reporting Summary linked to this article.
Data availability
RNA-seq data are available in the Gene Expression Omnibus under accession number GSE268945. The numerical source data for all graphs and charts are included with the paper. Source data are provided with this paper.
Code availability
No custom code was used.
References
Loomba, R. & Sanyal, A. J. The global NAFLD epidemic. Nat. Rev. Gastroenterol. Hepatol. 10, 686–690 (2013).
Gallage, S. et al. A researcher’s guide to preclinical mouse NASH models. Nat. Metab. 4, 1632–1649 (2022).
Vacca, M. et al. An unbiased ranking of murine dietary models based on their proximity to human metabolic dysfunction-associated steatotic liver disease (MASLD). Nat. Metab. 6, 1178–1196 (2024).
DiStefano, J. K. & Gerhard, G. S. NAFLD in normal weight individuals. Diabetol. Metab. Syndr. 14, 45 (2022).
Allen, A. M., Hicks, S. B., Mara, K. C., Larson, J. J. & Therneau, T. M. The risk of incident extrahepatic cancers is higher in non-alcoholic fatty liver disease than obesity—a longitudinal cohort study. J. Hepatol. 71, 1229–1236 (2019).
Nabi, O. et al. Lean individuals with NAFLD have more severe liver disease and poorer clinical outcomes (NASH-CO Study). Hepatology 78, 272–283 (2023).
Assy, N. et al. Soft drink consumption linked with fatty liver in the absence of traditional risk factors. Can. J. Gastroenterol. 22, 811–816 (2008).
Younossi, Z. et al. Global burden of NAFLD and NASH: trends, predictions, risk factors and prevention. Nat. Rev. Gastroenterol. Hepatol. 15, 11–20 (2018).
Meng, G. et al. Soft drinks consumption is associated with nonalcoholic fatty liver disease independent of metabolic syndrome in Chinese population. Eur. J. Nutr. 57, 2113–2121 (2018).
Petta, S. et al. Industrial, not fruit fructose intake is associated with the severity of liver fibrosis in genotype 1 chronic hepatitis C patients. J. Hepatol. 59, 1169–1176 (2013).
Beisner, J., Gonzalez-Granda, A., Basrai, M., Damms-Machado, A. & Bischoff, S. C. Fructose-induced intestinal microbiota shift following two types of short-term high-fructose dietary phases. Nutrients 12, 3444 (2020).
Hallfrisch, J. et al. Effects of dietary fructose on plasma glucose and hormone responses in normal and hyperinsulinemic men. J. Nutr. 113, 1819–1826 (1983).
Shepherd, S. J., Parker, F. C., Muir, J. G. & Gibson, P. R. Dietary triggers of abdominal symptoms in patients with irritable bowel syndrome: randomized placebo-controlled evidence. Clin. Gastroenterol. Hepatol. 6, 765–771 (2008).
Jang, C. et al. The small intestine converts dietary fructose into glucose and organic acids. Cell Metab. 27, 351–361.e3 (2018).
Zhao, S. et al. Dietary fructose feeds hepatic lipogenesis via microbiota-derived acetate. Nature 579, 586–591 (2020).
Jang, C. et al. The small intestine shields the liver from fructose-induced steatosis. Nat. Metab. 2, 586–593 (2020).
Jung, S., Bae, H., Song, W. S. & Jang, C. Dietary fructose and fructose-induced pathologies. Annu. Rev. Nutr. 42, 45–66 (2022).
Diggle, C. P. et al. Ketohexokinase: expression and localization of the principal fructose-metabolizing enzyme. J. Histochem. Cytochem. 57, 763–774 (2009).
Liu, L. et al. Triose kinase controls the lipogenic potential of fructose and dietary tolerance. Cell Metab. 32, 605–618.e7 (2020).
Heinz, F., Lamprecht, W. & Kirsch, J. Enzymes of fructose metabolism in human liver. J. Clin. Investig. 47, 1826–1832 (1968).
Takino, J., Kobayashi, Y. & Takeuchi, M. The formation of intracellular glyceraldehyde-derived advanced glycation end-products and cytotoxicity. J. Gastroenterol. 45, 646–655 (2010).
Kim, M. S. et al. ChREBP regulates fructose-induced glucose production independently of insulin signaling. J. Clin. Invest. 126, 4372–4386 (2016).
Softic, S., Cohen, D. E. & Kahn, C. R. Role of dietary fructose and hepatic de novo lipogenesis in fatty liver disease. Dig. Dis. Sci. 61, 1282–1293 (2016).
Softic, S. et al. Divergent effects of glucose and fructose on hepatic lipogenesis and insulin signaling. J. Clin. Invest. 127, 4059–4074 (2017).
Wu, Y. et al. Glycerate from intestinal fructose metabolism induces islet cell damage and glucose intolerance. Cell Metab. 34, 1042–1053.e6 (2022).
Taylor, S. R. et al. Dietary fructose improves intestinal cell survival and nutrient absorption. Nature 597, 263–267 (2021).
Todoric, J. et al. Fructose stimulated de novo lipogenesis is promoted by inflammation. Nat. Metab. 2, 1034–1045 (2020).
Wang, L. et al. Inulin-type fructans supplementation improves glycemic control for the prediabetes and type 2 diabetes populations: results from a GRADE-assessed systematic review and dose-response meta-analysis of 33 randomized controlled trials. J. Transl. Med. 17, 410 (2019).
Dehghan, P., Pourghassem Gargari, B. & Asghari Jafar-abadi, M. Oligofructose-enriched inulin improves some inflammatory markers and metabolic endotoxemia in women with type 2 diabetes mellitus: a randomized controlled clinical trial. Nutrition 30, 418–423 (2014).
Parnell, J. A. & Reimer, R. A. Weight loss during oligofructose supplementation is associated with decreased ghrelin and increased peptide YY in overweight and obese adults. Am. J. Clin. Nutr. 89, 1751–1759 (2009).
Wei, W. et al. Parabacteroides distasonis uses dietary inulin to suppress NASH via its metabolite pentadecanoic acid. Nat. Microbiol. 8, 1534–1548 (2023).
Cummings, J. H. & Macfarlane, G. T. The control and consequences of bacterial fermentation in the human colon. J. Appl. Bacteriol. 70, 443–459 (1991).
Zhang, S. et al. Dietary fiber-derived short-chain fatty acids: a potential therapeutic target to alleviate obesity-related nonalcoholic fatty liver disease. Obes. Rev. 22, e13316 (2021).
Zeng, X. et al. Gut bacterial nutrient preferences quantified in vivo. Cell 185, 3441–3456.e19 (2022).
Perry, R. J. et al. Acetate mediates a microbiome–brain–β-cell axis to promote metabolic syndrome. Nature 534, 213–217 (2016).
Gerrick, E. R. et al. Metabolic diversity in commensal protists regulates intestinal immunity and trans-kingdom competition. Cell 187, 62–78.e20 (2024).
Schneider, C. et al. A metabolite-triggered tuft cell-ILC2 circuit drives small intestinal remodeling. Cell 174, 271–284.e14 (2018).
Singh, V. et al. Dysregulated microbial fermentation of soluble fiber induces cholestatic liver cancer. Cell 175, 679–694.e22 (2018).
Mistry, R. H., Gu, F., Schols, H. A., Verkade, H. J. & Tietge, U. J. F. Effect of the prebiotic fiber inulin on cholesterol metabolism in wildtype mice. Sci. Rep. 8, 13238 (2018).
Singh, A., Zapata, R. C., Pezeshki, A., Reidelberger, R. D. & Chelikani, P. K. Inulin fiber dose-dependently modulates energy balance, glucose tolerance, gut microbiota, hormones and diet preference in high-fat-fed male rats. J. Nutr. Biochem. 59, 142–152 (2018).
Song, I. et al. Prebiotic inulin ameliorates SARS-CoV-2 infection in hamsters by modulating the gut microbiome. npj Sci. Food 8, 18 (2024).
McKeown, N. M., Fahey, G. C. Jr., Slavin, J. & van der Kamp, J. W. Fibre intake for optimal health: how can healthcare professionals support people to reach dietary recommendations? Brit. Med. J. 378, e054370 (2022).
Cani, P. D. et al. Involvement of endogenous glucagon-like peptide-1(7–36) amide on glycaemia-lowering effect of oligofructose in streptozotocin-treated rats. J. Endocrinol. 185, 457–465 (2005).
Bomhof, M. R., Saha, D. C., Reid, D. T., Paul, H. A. & Reimer, R. A. Combined effects of oligofructose and Bifidobacterium animalis on gut microbiota and glycemia in obese rats. Obesity 22, 763–771 (2014).
Bharti, S. K. et al. Antidiabetic activity and molecular docking of fructooligosaccharides produced by Aureobasidium pullulans in poloxamer-407-induced T2DM rats. Food Chem. 136, 813–821 (2013).
Hoving, L. R. et al. The prebiotic inulin modulates gut microbiota but does not ameliorate atherosclerosis in hypercholesterolemic APOE*3-Leiden.CETP mice. Sci. Rep. 8, 16515 (2018).
Klurfeld, D. M. et al. Considerations for best practices in studies of fiber or other dietary components and the intestinal microbiome. Am. J. Physiol. Endocrinol. Metab. 315, E1087–E1097 (2018).
Meyers, A. M., Mourra, D. & Beeler, J. A. High fructose corn syrup induces metabolic dysregulation and altered dopamine signaling in the absence of obesity. PLoS ONE 12, e0190206 (2017).
Koliaki, C. et al. Adaptation of hepatic mitochondrial function in humans with non-alcoholic fatty liver is lost in steatohepatitis. Cell Metab. 21, 739–746 (2015).
Inzaugarat, M. E., Wree, A. & Feldstein, A. E. Hepatocyte mitochondrial DNA released in microparticles and toll-like receptor 9 activation: a link between lipotoxicity and inflammation during nonalcoholic steatohepatitis. Hepatology 64, 669–671 (2016).
Donnelly, K. L. et al. Sources of fatty acids stored in liver and secreted via lipoproteins in patients with nonalcoholic fatty liver disease. J. Clin. Invest. 115, 1343–1351 (2005).
Lambert, J. E., Ramos-Roman, M. A., Browning, J. D. & Parks, E. J. Increased de novo lipogenesis is a distinct characteristic of individuals with nonalcoholic fatty liver disease. Gastroenterology 146, 726–735 (2014).
Fu, X. et al. Measurement of lipogenic flux by deuterium resolved mass spectrometry. Nat. Commun. 12, 3756 (2021).
Ishimoto, T. et al. Opposing effects of fructokinase C and A isoforms on fructose-induced metabolic syndrome in mice. Proc. Natl Acad. Sci. USA 109, 4320–4325 (2012).
Sakasai-Sakai, A., Takata, T., Takino, J. I. & Takeuchi, M. Impact of intracellular glyceraldehyde-derived advanced glycation end-products on human hepatocyte cell death. Sci. Rep. 7, 14282 (2017).
Votruba, S. B., Zeddun, S. M. & Schoeller, D. A. Validation of deuterium labeled fatty acids for the measurement of dietary fat oxidation: a method for measuring fat-oxidation in free-living subjects. Int. J. Obes. Relat. Metab. Disord. 25, 1240–1245 (2001).
Naguib, G. et al. Dietary fatty acid oxidation is decreased in non-alcoholic fatty liver disease: a palmitate breath test study. Liver Int. 40, 590–597 (2020).
Yuan, B. et al. An organism-level quantitative flux model of energy metabolism in mice. Cell Metab. 37, 1012–1023.e6 (2025).
Andres-Hernando, A. et al. Deletion of fructokinase in the liver or in the intestine reveals differential effects on sugar-induced metabolic dysfunction. Cell Metab. 32, 117–127.e3 (2020).
Zhu, L. B., Zhang, Y. C., Huang, H. H. & Lin, J. Prospects for clinical applications of butyrate-producing bacteria. World J. Clin. Pediatr. 10, 84–92 (2021).
Weitkunat, K. et al. Effects of dietary inulin on bacterial growth, short-chain fatty acid production and hepatic lipid metabolism in gnotobiotic mice. J. Nutr. Biochem. 26, 929–937 (2015).
Nakajima, H. et al. Inulin reduces visceral adipose tissue mass and improves glucose tolerance through altering gut metabolites. Nutr. Metab. 19, 50 (2022).
Yamaguchi, A. et al. Hepatic adenosine triphosphate reduction through the short-chain fatty acids–peroxisome proliferator-activated receptor γ–uncoupling protein 2 axis alleviates immune-mediated acute hepatitis in inulin-supplemented mice. Hepatol. Commun. 5, 1555–1570 (2021).
Oh, J. H. et al. Dietary fructose and microbiota-derived short-chain fatty acids promote bacteriophage production in the gut symbiont Lactobacillus reuteri. Cell Host Microbe 25, 273–284.e6 (2019).
Di Luccia, B. et al. Rescue of fructose-induced metabolic syndrome by antibiotics or faecal transplantation in a rat model of obesity. PLoS ONE 10, e0134893 (2015).
Park, J. H. et al. An integrative multiomics approach to characterize prebiotic inulin effects on Faecalibacterium prausnitzii. Front. Bioeng. Biotechnol. 10, 825399 (2022).
Amelio, I., Cutruzzola, F., Antonov, A., Agostini, M. & Melino, G. Serine and glycine metabolism in cancer. Trends Biochem. Sci. 39, 191–198 (2014).
Parker, J. L. et al. Molecular basis for redox control by the human cystine/glutamate antiporter system xc−. Nat. Commun. 12, 7147 (2021).
Zhou, X. et al. Serine alleviates oxidative stress via supporting glutathione synthesis and methionine cycle in mice. Mol. Nutr. Food Res. 61, 1700262 (2017).
Zhang, X. et al. Lipid peroxidation in osteoarthritis: focusing on 4-hydroxynonenal, malondialdehyde, and ferroptosis. Cell Death Discov. 9, 320 (2023).
Flint, H. J., Scott, K. P., Duncan, S. H., Louis, P. & Forano, E. Microbial degradation of complex carbohydrates in the gut. Gut Microbes 3, 289–306 (2012).
Lapebie, P., Lombard, V., Drula, E., Terrapon, N. & Henrissat, B. Bacteroidetes use thousands of enzyme combinations to break down glycans. Nat. Commun. 10, 2043 (2019).
Magne, F. et al. The Firmicutes/Bacteroidetes ratio: A relevant marker of gut dysbiosis in obese patients? Nutrients 12, 1474 (2020).
Stojanov, S. et al. The influence of probiotics on the Firmicutes/Bacteroidetes ratio in the treatment of obesity and inflammatory bowel disease. Microorganisms 8, 1715 (2020).
Manor, O. et al. Health and disease markers correlate with gut microbiome composition across thousands of people. Nat. Commun. 11, 5206 (2020).
Choi, Y., Abdelmegeed, M. A. & Song, B. J. Diet high in fructose promotes liver steatosis and hepatocyte apoptosis in C57BL/6J female mice: role of disturbed lipid homeostasis and increased oxidative stress. Food Chem. Toxicol. 103, 111–121 (2017).
Chambers, E. S. et al. Dietary supplementation with inulin-propionate ester or inulin improves insulin sensitivity in adults with overweight and obesity with distinct effects on the gut microbiota, plasma metabolome and systemic inflammatory responses: a randomised cross-over trial. Gut 68, 1430–1438 (2019).
Nicolucci, A. C. et al. Prebiotics reduce body fat and alter intestinal microbiota in children who are overweight or with obesity. Gastroenterology 153, 711–722 (2017).
Chong, C. Y. L. et al. Randomised double-blind placebo-controlled trial of inulin with metronidazole in non-alcoholic fatty liver disease (NAFLD). Nutrients 12, 937 (2020).
Helsley, R. N. et al. Ketohexokinase-C regulates global protein acetylation to decrease carnitine palmitoyltransferase 1a-mediated fatty acid oxidation. J. Hepatol. 79, 25–42 (2023).
Vega-Sagardia, M., Cabezon, E. C., Delgado, J., Ruiz-Moyano, S. & Garrido, D. Screening microbial interactions during inulin utilization reveals strong competition and proteomic changes in Lacticaseibacillus paracasei M38. Probiotics Antimicrob. Proteins 16, 993–1011 (2024).
Yang, J. Y. et al. Gut commensal Bacteroides acidifaciens prevents obesity and improves insulin sensitivity in mice. Mucosal Immunol. 10, 104–116 (2017).
Wang, H. et al. Bacteroides acidifaciens in the gut plays a protective role against CD95-mediated liver injury. Gut Microbes 14, 2027853 (2022).
Yamakado, M. et al. Plasma amino acid profile associated with fatty liver disease and co-occurrence of metabolic risk factors. Sci. Rep. 7, 14485 (2017).
Li, X. et al. Association of serum glycine levels with metabolic syndrome in an elderly Chinese population. Nutr. Metab. 15, 89 (2018).
Ghrayeb, A. et al. Serine synthesis via reversed SHMT2 activity drives glycine depletion and acetaminophen hepatotoxicity in MASLD. Cell Metab. 36, 116–129.e7 (2024).
McBride, M. J. et al. Glycine homeostasis requires reverse SHMT flux. Cell Metab. 36, 103–115.e4 (2024).
Chen, G. et al. SHMT2 reduces fatty liver but is necessary for liver inflammation and fibrosis in mice. Commun. Biol. 7, 173 (2024).
Pernigoni, N. et al. Commensal bacteria promote endocrine resistance in prostate cancer through androgen biosynthesis. Science 374, 216–224 (2021).
Schulfer, A. F. et al. Intergenerational transfer of antibiotic-perturbed microbiota enhances colitis in susceptible mice. Nat. Microbiol. 3, 234–242 (2018).
Yang, C. J. et al. Oral fecal transplantation enriches Lachnospiraceae and butyrate to mitigate acute liver injury. Cell Rep. 43, 113591 (2024).
Bankhead, P. et al. QuPath: open source software for digital pathology image analysis. Sci. Rep. 7, 16878 (2017).
Allen, F. M. et al. Rapid fractionation of mitochondria from mouse liver and heart reveals in vivo metabolite compartmentation. FEBS Lett. 597, 246–261 (2023).
Shah, V., Herath, K., Previs, S. F., Hubbard, B. K. & Roddy, T. P. Headspace analyses of acetone: a rapid method for measuring the 2H-labeling of water. Anal. Biochem. 404, 235–237 (2010).
Akgul Kalkan, E., Sahiner, M., Ulker Cakir, D., Alpaslan, D. & Yilmaz, S. Quantitative clinical diagnostic analysis of acetone in human blood by HPLC: a metabolomic search for acetone as indicator. J. Anal. Methods Chem. 2016, 5176320 (2016).
Diraison, F., Pachiaudi, C. & Beylot, M. In vivo measurement of plasma cholesterol and fatty acid synthesis with deuterated water: determination of the average number of deuterium atoms incorporated. Metabolism 45, 817–821 (1996).
Douny, C., Bayram, P., Brose, F., Degand, G. & Scippo, M. L. Development of an LC–MS/MS analytical method for the simultaneous measurement of aldehydes from polyunsaturated fatty acids degradation in animal feed. Drug Test. Anal. 8, 458–464 (2016).
Han, X. et al. Kazak faecal microbiota transplantation induces short-chain fatty acids that promote glucagon-like peptide-1 secretion by regulating gut microbiota in db/db mice. Pharm. Biol. 59, 1077–1087 (2021).
Junick, J. & Blaut, M. Quantification of human fecal Bifidobacterium species by use of quantitative real-time PCR analysis targeting the groEL gene. Appl. Environ. Microbiol. 78, 2613–2622 (2012).
Wan, X., Wang, W., Liu, J. & Tong, T. Estimating the sample mean and standard deviation from the sample size, median, range and/or interquartile range. BMC Med. Res. Methodol. 14, 135 (2014).
Acknowledgements
We thank all members of the Jang and Lee laboratories for discussions. We dedicate this paper to our beloved colleague, mentor and friend, Dr. Gina Lee. She remains forever in our hearts and continues to motivate our research. We thank S. Hui (Harvard T. H. Chan School of Public Health) for insightful discussions regarding 13C fatty acid tracing studies. We thank K. L. Whiteson, J. Avelar-Barragan, J. Martiny, C. Weihe and A. Barron for providing an anaerobic chamber for bacterial culture. We also thank the Experimental Tissue Resource of the Chao Family Comprehensive Cancer Center for histological analysis. This work was supported by the National Research Foundation of Korea (2021R1A6A3A-14039681 to S.J.; 2021R1A6A3A14039132 to H.B. and RS-2024-00411784 to W.S.), Ministry of Health & Welfare, Republic of Korea (HI19C1352 to W.S.), American Diabetes Association (11-23-PDF-03 to S.J.), AASLD Foundation Pinnacle Research Award in Liver Disease (C.J.), Edward Mallinckrodt, Jr. Foundation Award (C.J.), Pew Foundation (C.J.), National Institutes of Health grants (R01-AA029124 and R21-AA030358 to C.J.; T32GM008620 and F31DK134173 to J.L.; K22-CA234399 to G.L.), the University of California Irvine, Chao Family Comprehensive Cancer Center (P30CA062203 to G.L.), National Institutes of Health/National Cancer Institute grants (R01CA244519 and R01CA259370 to S.M.), V Foundation for Cancer Research (S.M.) and Johnson & Johnson (S.M.).
Ethics declarations
Competing interests
The authors declare no competing interests.
Peer review
Peer review information
Nature Metabolism thanks the anonymous reviewers for their contribution to the peer review of this work. Primary Handling Editor: Yanina-Yasmin Pesch, in collaboration with the Nature Metabolism team.
Additional information
Publisher’s note Springer Nature remains neutral with regard to jurisdictional claims in published maps and institutional affiliations.
Extended data
Extended Data Fig. 1 Metabolic characterization of mice fed HFCS, inulin or combinations.
a-c, Daily food, water, and calorie intake (n = 3,3,3,3,3 cages). d, Lean mass normalized to body weight (n = 8,9,8,8,9 mice). e-i, Locomotor activity, heat production, O2 consumption, CO2 production, and respiratory exchange ratio (n = 8,9,8,8,9 mice). j, Hepatic mtDNA contents (n = 5,7,7 mice). k, Representative liver trichrome staining for fibrosis measurements from two independent experiments. Scale bars, 50 μm (n = 3,3,3,3,3 mice). l, body water enrichment measured 15 hours after administration of 2H2O. m, Circulating total saponified palmitate concentration (n = 12,9,10 mice). n, PCA plot of metabolites in cytosol and mitochondria fractions of liver (n = 4,4 mice). o, Glucose-6-phosphate and α-ketoglutarate levels in cytosolic vs mitochondrial fractions of liver (n = 4,4 mice). p, 13C-labeled circulating palmitate fraction over time after oral provision of 13C-palmitate (n = 4,3 mice). Data are mean±s.e.m. P-values by one-way ANOVA with Tukey’s HSD test.
Extended Data Fig. 2 Inulin does not affect fructose catabolism by the host small intestine.
a, 13C-labeled F1P abundances in small intestine, 30 min after oral provision of HFCS with fructose 13C-labeled (n = 8,8,9 mice). b, Small intestinal fructose transporter and catabolism gene expression (n = 8,8,9 mice). c, Glucose levels in caecal content, 30 min after oral provision of HFCS (n = 8,8,9 mice). d-e, Total and 13C-labeled SCFAs concentrations in portal blood, 1 h after oral provision of HFCS with fructose 13C-labeled (n = 7,7,7 mice, left), (n = 12,8,12 mice, right). Data are mean±s.e.m. P-values by one-way ANOVA with Tukey’s HSD test. ns=not significant.
Extended Data Fig. 3 Antibiotics reverse inulin’s effects.
a, Body weight (n = 7,8,7,6 mice). b-d, Daily food, water, and calorie intake (n = 3,3,3,2 cages). e, 13C-labeled acetyl CoA in liver (n = 7,8,7,6 mice), 1 hr after provision of HFCS with fructose 13C-labeled in mice fed the indicated diet for 16 weeks (n = 7,8,8,6 mice). f, 13C-labeled circulating saponified fatty acids. g, Abundances of the indicated hepatic lipid species normalized to the C group (n = 8,7,6 mice), h-i, Liver lipogenesis (h) and fibrosis marker (i) gene expression (n = 7,8,7,6 mice). j, NMDS plot showing microbial diversity among donor and recipient mice of jejunal microbiome transplant experiment (n = 5-7 mice/group). Data are mean±s.e.m. P-values determined by one-way ANOVA with Tukey’s HSD test.
Extended Data Fig. 4 Inulin activates hepatic serine and GSH synthesis.
a, Schematic of serine synthesis pathway from 13C-fructose. Red circles indicate labeled carbons. b-c, Kyoto Encyclopedia of Genes and Genomes (KEGG) pathway enrichment of IF(b) and CIF(c) compared CF (n = 5,5,4 mice for CF, IF and CIF groups). P-values by Fisher’s exact test. d, Hepatic malondialdehyde abundances measured by chemical derivatization and LC-MS measurement (n = 8,9 mice). e, Immunofluorescence staining and quantitation of liver dihydroethidium to measure ROS. Each dot indicates a mean of quadruplicate values from two independent experiments. Scale bars, 20 μm (n = 6,6 mice). f, 13C-labeled serine in liver of intestine-specific Khk-C transgenic mice, 1 hr after provision of HFCS with fructose 13C-labeled (n = 3, 3 mice). Data are mean±s.e.m. P-values by two-sided unpaired Student’s t-test.
Extended Data Fig. 5 Characterization of gut microbiome in mice fed HFCS with or without inulin.
a, Total bacterial amounts, Alpha-diversity, and Firmicutes to Bacteroidetes ratio in jejunum (n = 6,5,7 mice). b, Total bacterial amounts, Alpha-diversity, and Firmicutes to Bacteroidetes ratio in caecum (n = 8,8,8 mice). c, Relative abundance of B. pseudolongum in jejunal (n = 6,5,7 mice) and caecal content (n = 8,8,8 mice). d, 13C-labeled acetyl CoA enrichment (%) in liver, 1 hr after provision of HFCS with fructose 13C-labeled (n = 12,12,12 mice). e, 13C-labeled circulating saponified fatty acids (n = 12,12,12 mice). f, Relative abundances of the indicated hepatic lipid species (n = 12,12 mice). g, Gene expression of fibrosis markers in liver (n = 12,12 mice). h, Hepatic 13C-labeled serine and glycine abundances in mice that received vehicle or the indicated bacteria species, 1 hr after provision of HFCS with fructose 13C-labeled (n = 12,12,12 mice). i, Growth changes of B. acidifaciens in response to the addition of inulin or glucose (n = 3). j, Changes in 13C-fructose consumption and labeled short-chain fatty acid production of B. acidifaciens over incubation time (n = 3). Data are mean±s.e.m. P-values by one-way ANOVA with Tukey’s HSD test (a-e, k) or two-way ANOVA with Tukey’s HSD test (i-j).
Supplementary information
Supplementary Table 1
Composition of control and inulin-supplemented diets. Inulin accounts for 10% w/w. Note that the inulin diet contains ~7% less kcal g−1 owing to the replacement of a small portion of corn starch with inulin.
Supplementary Table 2
LC–MS analysis results of metabolites labelled from 13C-fructose in liver from CF and IF. P values by Student’s t-test followed by false discovery rate correction.
Supplementary Table 3
List of enriched genes in IF and CIF relative to CF (fold change > 2, P < 0.05) and RNA-seq results. Genes mentioned in the Article are indicated in bold. P value by Student’s t-test followed by false discovery rate correction.
Rights and permissions
Open Access This article is licensed under a Creative Commons Attribution 4.0 International License, which permits use, sharing, adaptation, distribution and reproduction in any medium or format, as long as you give appropriate credit to the original author(s) and the source, provide a link to the Creative Commons licence, and indicate if changes were made. The images or other third party material in this article are included in the article’s Creative Commons licence, unless indicated otherwise in a credit line to the material. If material is not included in the article’s Creative Commons licence and your intended use is not permitted by statutory regulation or exceeds the permitted use, you will need to obtain permission directly from the copyright holder. To view a copy of this licence, visit http://creativecommons.org/licenses/by/4.0/.
About this article
Cite this article
Jung, S., Bae, H., Song, WS. et al. Dietary fibre-adapted gut microbiome clears dietary fructose and reverses hepatic steatosis. Nat Metab 7, 1801–1818 (2025). https://doi.org/10.1038/s42255-025-01356-0
Received: 10 July 2024
Accepted: 24 July 2025
Published: 15 September 2025
Issue date: September 2025
DOI: https://doi.org/10.1038/s42255-025-01356-0