.png)

It’s official: Grafana 12.1 is here!
The latest release delivers new features that simplify the management of Grafana instances, streamline how you manage alert rules (so you can find the alerts you need, when you need them), and more.
Below are just some of the highlights from the latest Grafana release. If you are looking for more details about all the changes in this release, refer to the changelog or the What’s New documentation.
Automated health checks for your Grafana instance: Grafana Advisor
Public preview in all editions of Grafana
We’re always exploring new ways to reduce operational overhead, and help you streamline maintenance and troubleshooting. That’s why, in Grafana 12.1, we’re excited to share that Grafana Advisor — a monitoring tool that helps administrators keep their Grafana instances running smoothly and securely — is now in public preview.
Introduced in Grafana 12 as experimental, Advisor automatically performs regular health checks on your Grafana server, providing actionable insights and recommendations for maintaining optimal system performance.
Currently, Grafana Advisor performs regular checks on data source connections, plugins, and SSO settings, but we’re planning to expand its capabilities in future releases.
Advisor is turned on by default in Grafana Cloud. To enable the feature in Grafana OSS and Enterprise, you can use the grafanaAdvisor toggle. To learn more, please visit our technical docs.
Streamlined alert views to cut through the noise
Alerting is a critical part of any observability strategy. In Grafana 12.1, we have a couple new alerting features to share, including a redesigned alert rule list page that helps you manage alerts in a more scalable and intuitive way.
The redesigned alert rule list page
Generally available in all editions of Grafana
In Grafana Alerting, an alert rule is a set of evaluation criteria for when an alert should fire. You might have hundreds or thousands of these rules, and in the latest Grafana release, we’ve made it easier for you to browse them via a completely redesigned alert rule list page.
Overall, the new page provides a smoother, faster, and more flexible user experience. It features two views, each supporting its own use cases:
- The Grouped view is arranged by namespaces, so you can drill down into the specific groups you’re looking for.
- The List view is a full list of all alert rules, designed for quick searches and easy filtering, which has become much more efficient thanks to recent performance improvements.
We’ve also decluttered the interface to focus on the core task of managing your alert rules. We’ve created a cleaner, more streamlined view that surfaces only the most crucial details, including rule name, location, type, and state.
In addition, the new paginated API of the alert rule list page is designed to make alert rule management quick and easy. So, whether you want to see a structured hierarchy illustrating your alerting setup, or you have thousands of alert rules that you need to search and filter through quickly, you’ll notice a simpler, more streamlined experience.
For Grafana Cloud users, we are currently rolling out the new page across all Grafana Cloud instances. For Grafana OSS users, the page is currently accessible via a feature toggle. To enable it, find the feature_toggles section in your Grafana configuration file and add the alertingListViewV2 toggle:
After restarting Grafana, you will see the new rules list page.
Import alert rules from Prometheus to Grafana
We recently added support for importing data source-managed rules into Grafana as Grafana-managed alert rules. However, users couldn’t import their existing Prometheus rules when no ruler was available.
Now, with Grafana 12.1, you can import rules directly from a Prometheus YAML file using the same Alerting UI.
Introducing active time intervals
Lastly in alerting updates, we’ve renamed mute time intervals, which silence alerts during set times, to active time intervals to better align with their usage.
To learn more about these and other features in Grafana Alerting, please check out our documentation.
Query and visualize your data with greater flexibility and control
Whether you’re digging into specific metrics or building complex dashboards, these new features make it easier to explore your data exactly the way you want to.
Trendlines transformation
Generally available in all editions of Grafana
In Grafana, transformations are a powerful way to manipulate data returned by a query before the system applies a visualization. In Grafana 12.1, we’re adding a new transformation into the mix: trendlines (also known as regression analysis).
This new transformation fits a mathematical function –– either a linear or polynomial regression –– to any data set to predict values at a certain point of time that may not be represented in the original data set.
In other words, you’re creating a new series containing values predicted by a statistical model, which is particularly useful when trying to find a trend in chaotic data.
You can see examples of this transformation on Grafana Play and read more in our documentation.
Custom variable support in visualization actions
Generally available in all editions of Grafana
We’re excited to announce that you can now define custom variables within visualization actions.
When you trigger an action (such as an API request to create a support ticket), you’ll be prompted to provide input for those variables. This makes actions more dynamic and interactive, allowing you to tailor requests in real time without modifying the dashboard configuration.
This feature is especially useful when you’re triggering alerts, filtering API calls, or sending user-defined parameters to external systems.
Server-configurable quick time ranges for dashboards
Generally available in Grafana OSS and Grafana Enterprise
Grafana server administrators can now define custom time range presets for the time picker on dashboards — a feature that’s perfect for teams that routinely analyze specific, context-driven time windows.
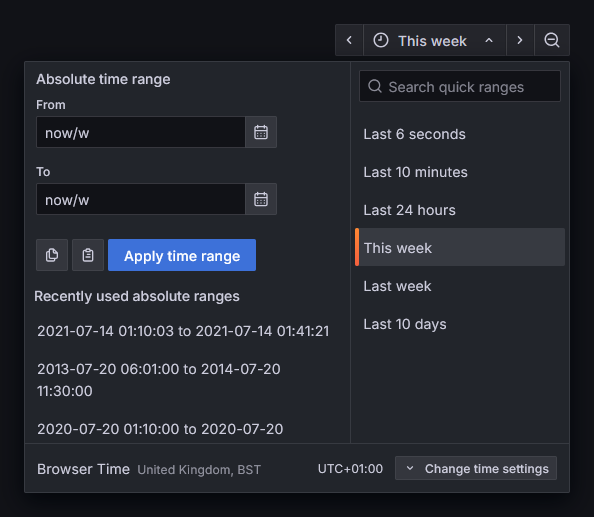
By configuring [time_picker] quick_ranges in your server config, you can set server-wide defaults specific to the data you are monitoring:
A big thank you to community member Chris Hodges for contributing this feature!
Enhanced custom currency format
Generally available in all editions of Grafana
It’s now possible to show exact financial values (or abbreviate them) to give you more control over what’s displayed in your dashboards.
Previously, Grafana automatically abbreviated large currency values — for example, $1,235,667 would be abbreviated to $1.24M or $555,558 to $555.6K. While this works well for most visualizations, financial data often requires values to be, well, right on the money.
So, we enhanced our custom currency format to solve this. Instead of the standard format, you can now use currency:financial:<unit> to display the exact and complete numeric value. For example, currency:financial:$ will format large values like 1235667 as $1,235,667 instead of $1.24M.
The financial format also supports flexible symbol positioning, including:
Prefix (default): currency:financial:$ to display $1,235,667
Suffix: currency:financial:€:suffix to display 1,235,667€
More robust authentication for Microsoft Azure users
Generally available in all editions of Grafana
Grafana now supports Microsoft’s Entra Workload Identity, significantly enhancing authentication capabilities with federated credentials. This update simplifies the OAuth flow and improves security for Grafana instances leveraging Microsoft Azure.
For more details on configuring Entra ID (formerly known as Azure AD) authentication, please refer to our documentation. And thank you to Grafana community member mehiglow for this valuable contribution!
Extending Grafana: what’s new in data sources
At Grafana Labs, we believe you should be able to query and visualize your data, regardless of where that data lives. As a result, we’re always working to expand and enhance our line-up of Grafana data sources.
Here’s a look at the latest updates.
Visualizing LogicMonitor data
LogicMonitor is an observability platform that provides infrastructure monitoring, AIOps, and IT operations insights. Currently in public preview, the new LogicMonitor Devices Enterprise data source enables you to query and visualize Device Instance Data, and to list Devices, Datasources, and Instances, directly within Grafana Cloud or Grafana Enterprise.
Learn more about using and installing the LogicMonitor Devices Enterprise data source in our documentation. And to learn more about our Enterprise data sources, in general, please refer to this guide.
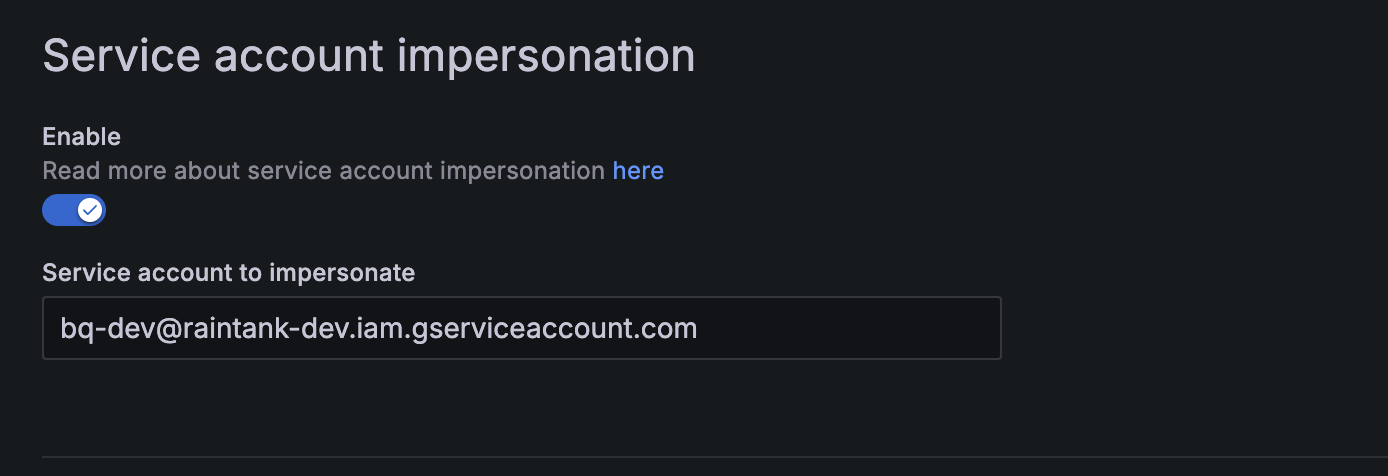
Support for Service Account Impersonation in BigQuery data source
For better security, Google advises using Service Account Tokens with Service Account Impersonation. If a Service Account Token is ever compromised, it can’t be used to access Google Cloud APIs without the associated service account for impersonation, making it much harder for unauthorized access.
This added security layer is now supported in our BigQuery data source configuration, as well, protecting against unauthorized access if tokens are compromised. This feature is now generally available.
You can learn more about our BigQuery data source for Grafana in our plugin catalog and in this recent blog post.
Learn more about Grafana
For an in-depth list of all the new features in Grafana, check out our Grafana documentation, the Grafana changelog, or our What’s New documentation.
We invite you to engage with the Grafana Labs community forums. Share your experiences with the new features, discuss best practices, and explore creative ways to integrate these updates into your workflows. Your insights and use cases are invaluable in enriching the Grafana ecosystem.
Upgrade to Grafana 12.1
Download Grafana 12.1 today or experience all the latest features by signing up for Grafana Cloud, which offers an actually useful forever-free tier and plans for every use case. Sign up for a free Grafana Cloud account today.
Our Grafana upgrade guide also provides step-by-step instructions for those looking to upgrade from an earlier version to ensure a smooth transition.
We extend our heartfelt gratitude to the Grafana community!
Your contributions, ranging from pull requests to valuable feedback, are crucial in continually enhancing Grafana. And your enthusiasm and dedication inspire us at Grafana Labs to persistently innovate and elevate the Grafana platform.
Grafana Cloud is the easiest way to get started with metrics, logs, traces, dashboards, and more. We have a generous forever-free tier and plans for every use case. Sign up for free now!


