.png)

tl;dr
- I migrated from a Raspberry Pi 5 to a mini PC powered by an AMD Ryzen 6600H with PCIe 4.0 x4 — running my full monitoring stack: Grafana, Prometheus, Mimir, Promtail, and Loki.
- After BIOS-level optimizations, the system now consumes just 10–12W at idle.
- The entire stack runs on Alpine Linux directly on bare metal — no Docker, no virtual machines.
- The configuration remained unchanged: no data loss, and no major reconfiguration was needed.
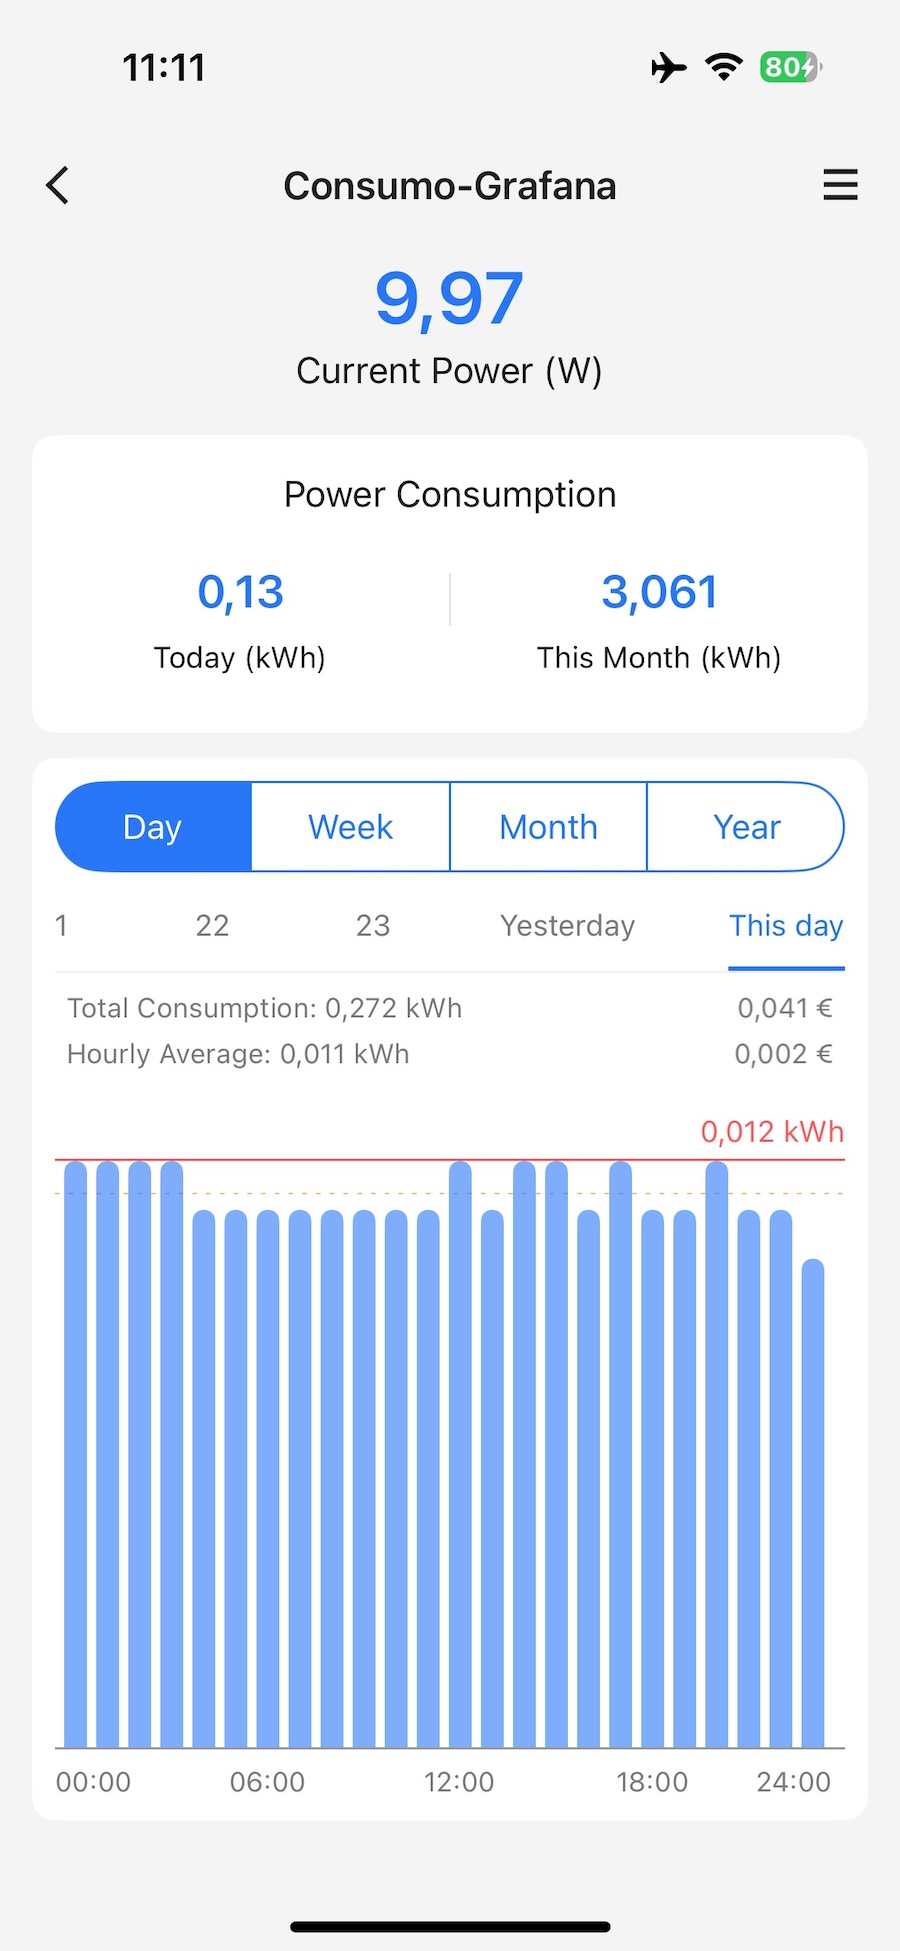
- I refined the way I receive daily emails containing dashboard screenshots.
- Logs are now better integrated into Grafana, and the server sends push notifications when backups are completed or if any network issues occur.
- I also implemented a push notification system to alert me of available package updates.
Introduction
Taking advantage of a great deal on Amazon, I bought a new mini PC to act as a server for my monitoring and dashboard stack: Grafana, Prometheus, Mimir, Loki, and Promtail.
I decided to replace the Raspberry Pi 5 that was running the entire Grafana stack mainly for one reason: Grafana Image Renderer plugin for Grafana.
This plugin isn’t natively compatible with the Arm architecture as a standard Grafana plugin.
It never has been, though the issue could be worked around by compiling the binaries manually in Go. The downside is that it isn’t fully integrated into the Grafana interface — you have to call the renderer via a URL query (adding /d/render/).
This workaround is quite inconvenient, especially when the native plugin on x86 is fully integrated into the Grafana UI and can be triggered directly from a dashboard panel, allowing you to configure image size and resolution directly within the interface.
Finally, now that x86 mini PCs offer good performance with low power consumption, I took the opportunity to migrate everything to a mini PC… rebuilding everything from scratch, because I like having a perfectly clean and well-optimized setup.
Hardware
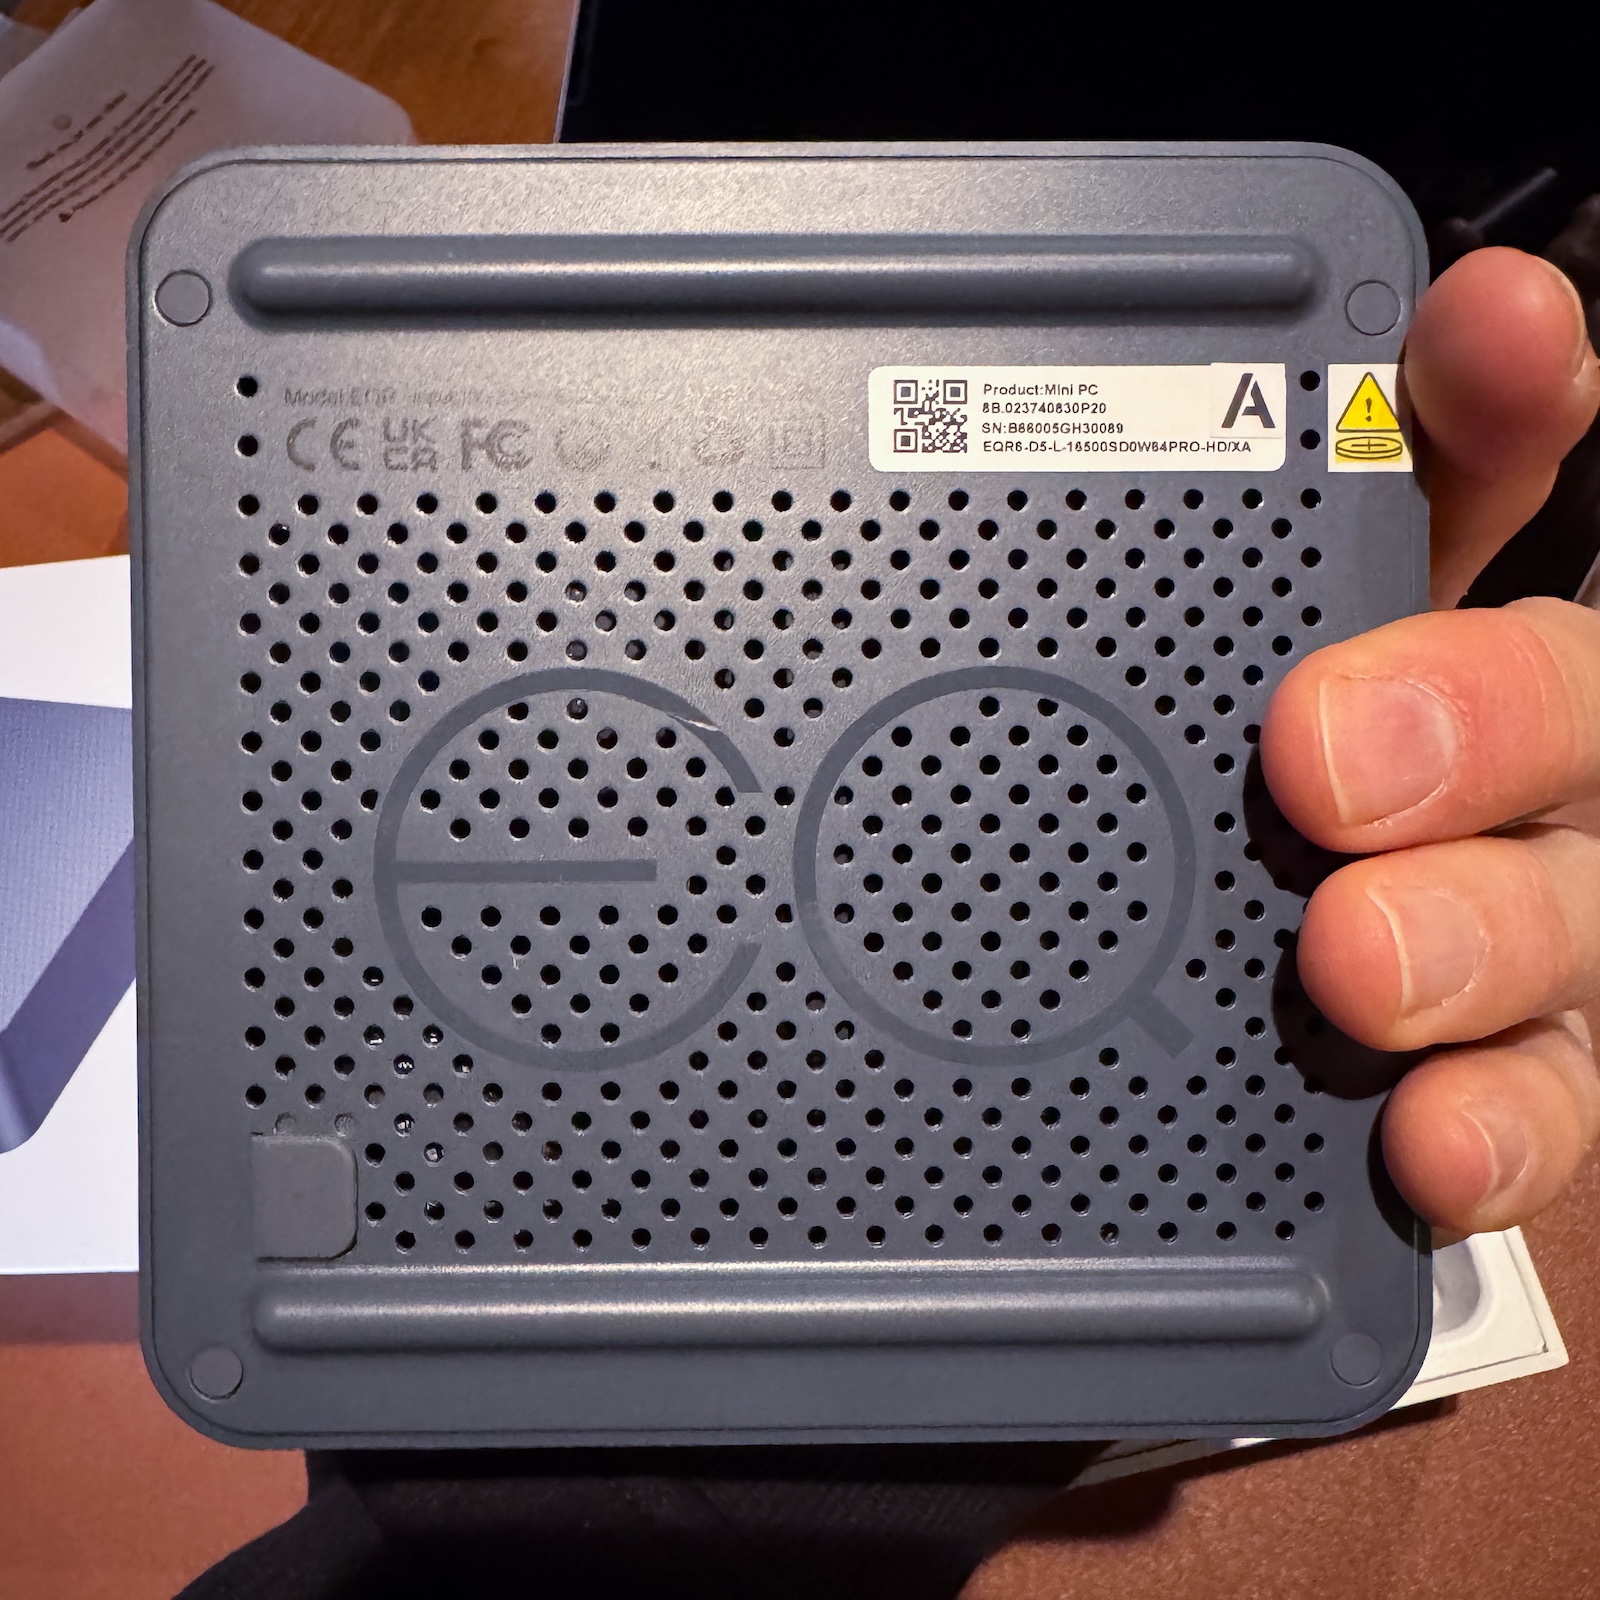
I chose a Beelink EQR6, which I got on sale on Amazon for 309€.
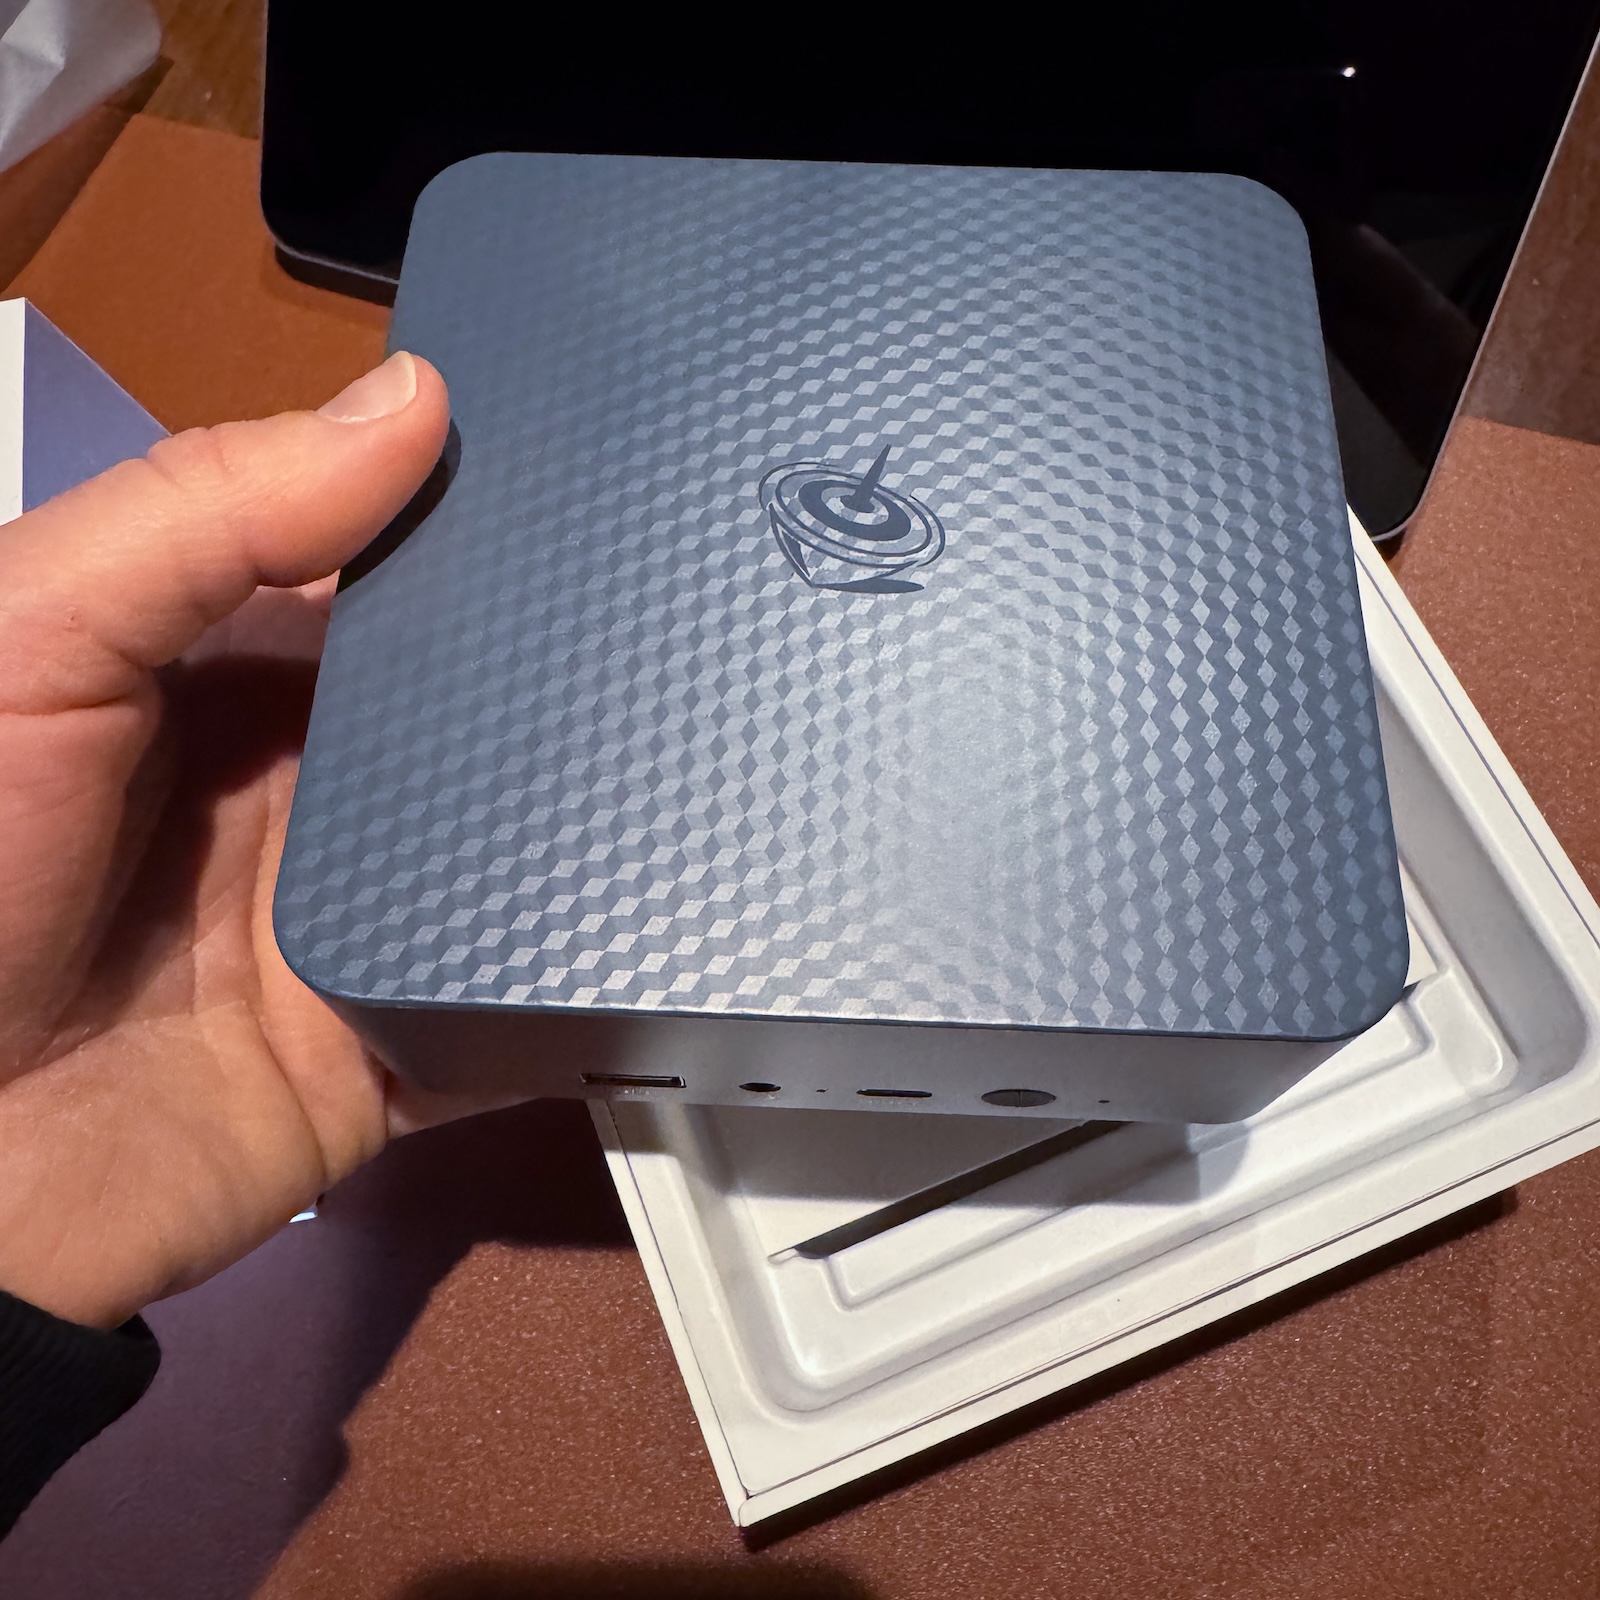

And it turned out to be a really great purchase: very powerful, yet efficient in terms of power consumption.
Technical details: it features an AMD 6600H CPU (6 cores), 16GB of DDR5 RAM (dual channel), a PCIe 4.0 x4 SSD, and an additional empty PCIe 4.0 x4 slot. It also includes two RJ45 ports and the usual extras (USB-C, dual HDMI, etc, though I’m not really interested in those).
The only downside is the build quality of the enclosure: it’s made of cheap plastic, and I’m not a fan of the “mouse gray” color. I would have much preferred a matte black finish.
I also decided to open it up to replace the thermal paste and lap the heatsink.
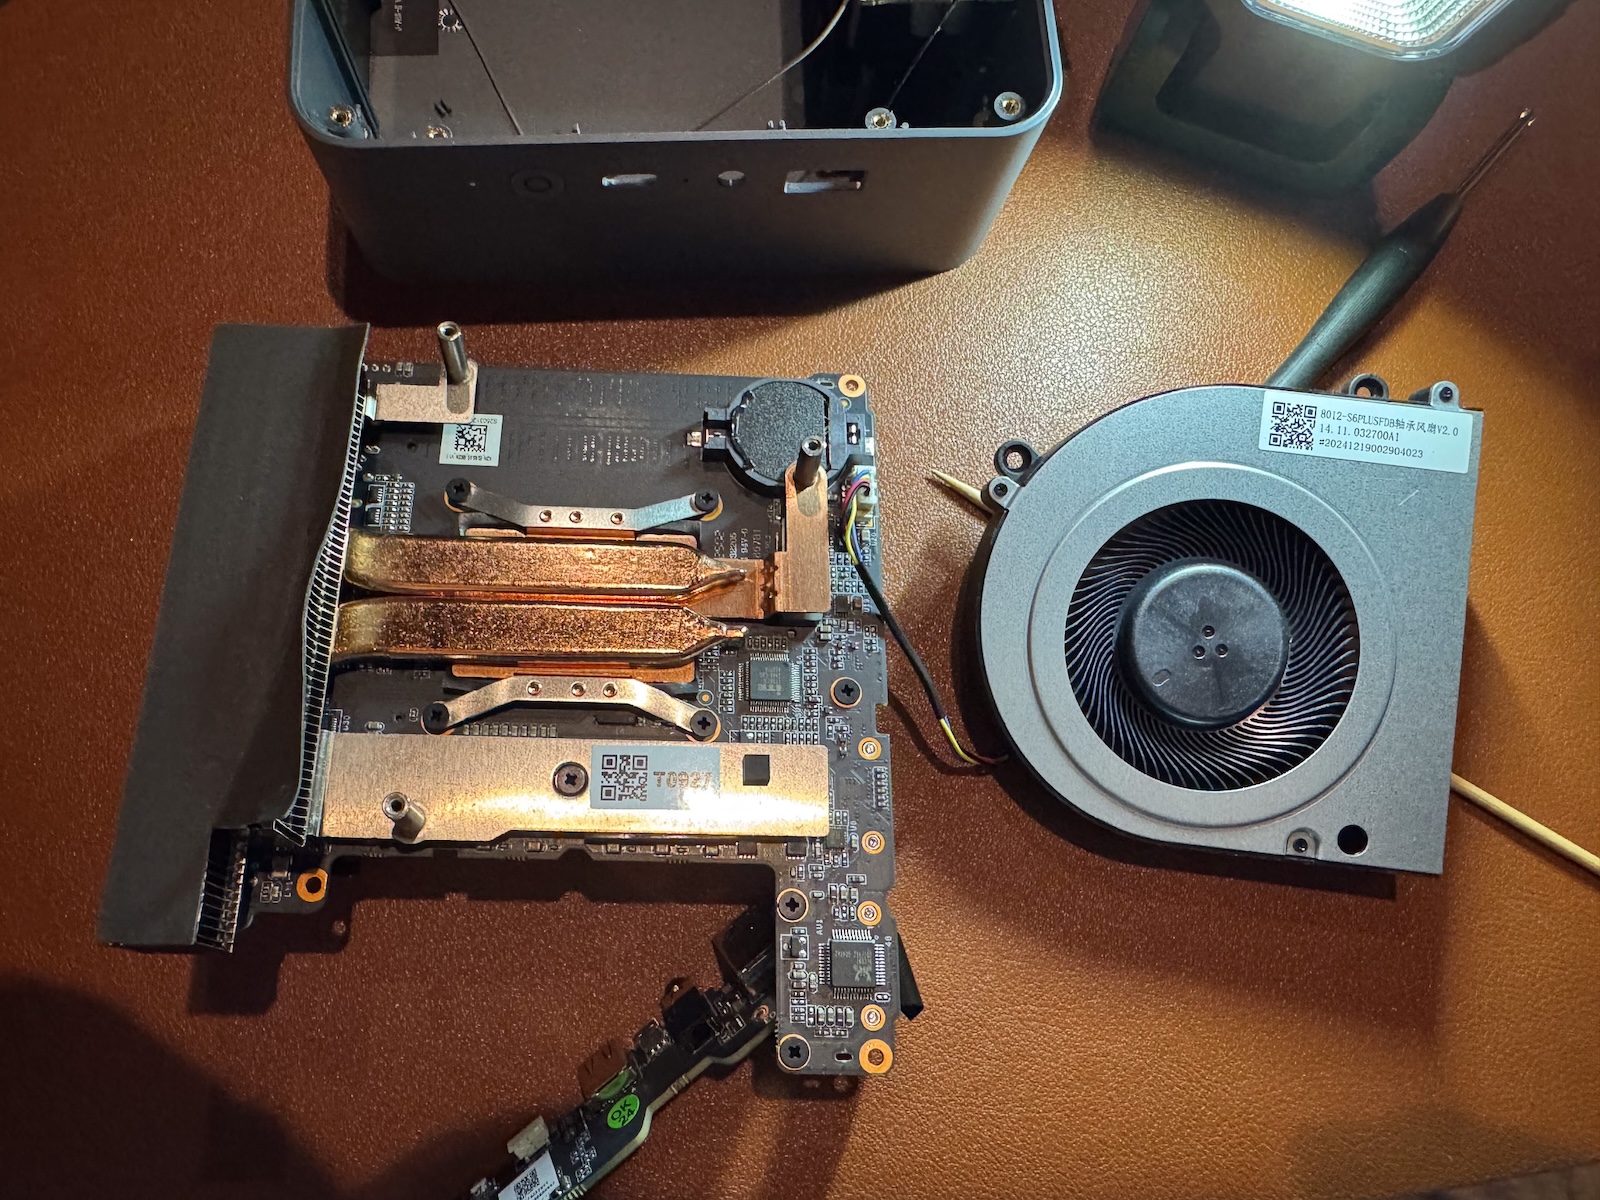
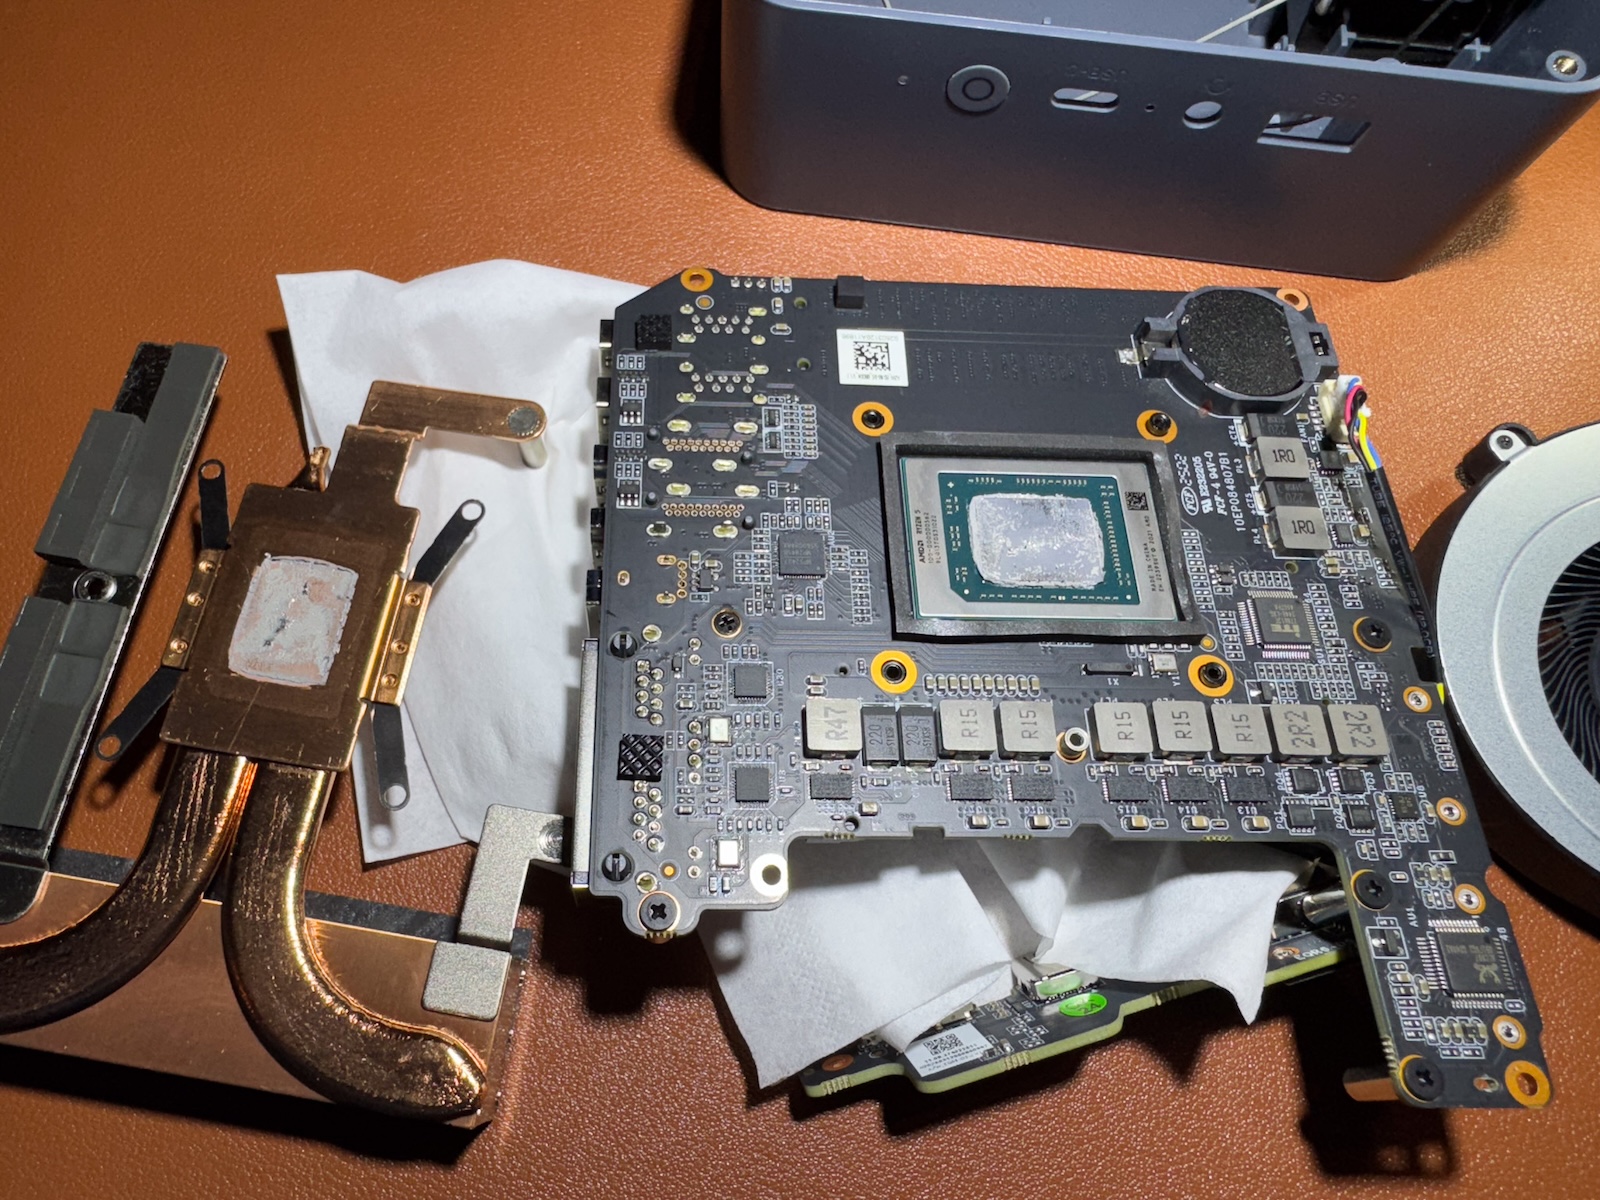
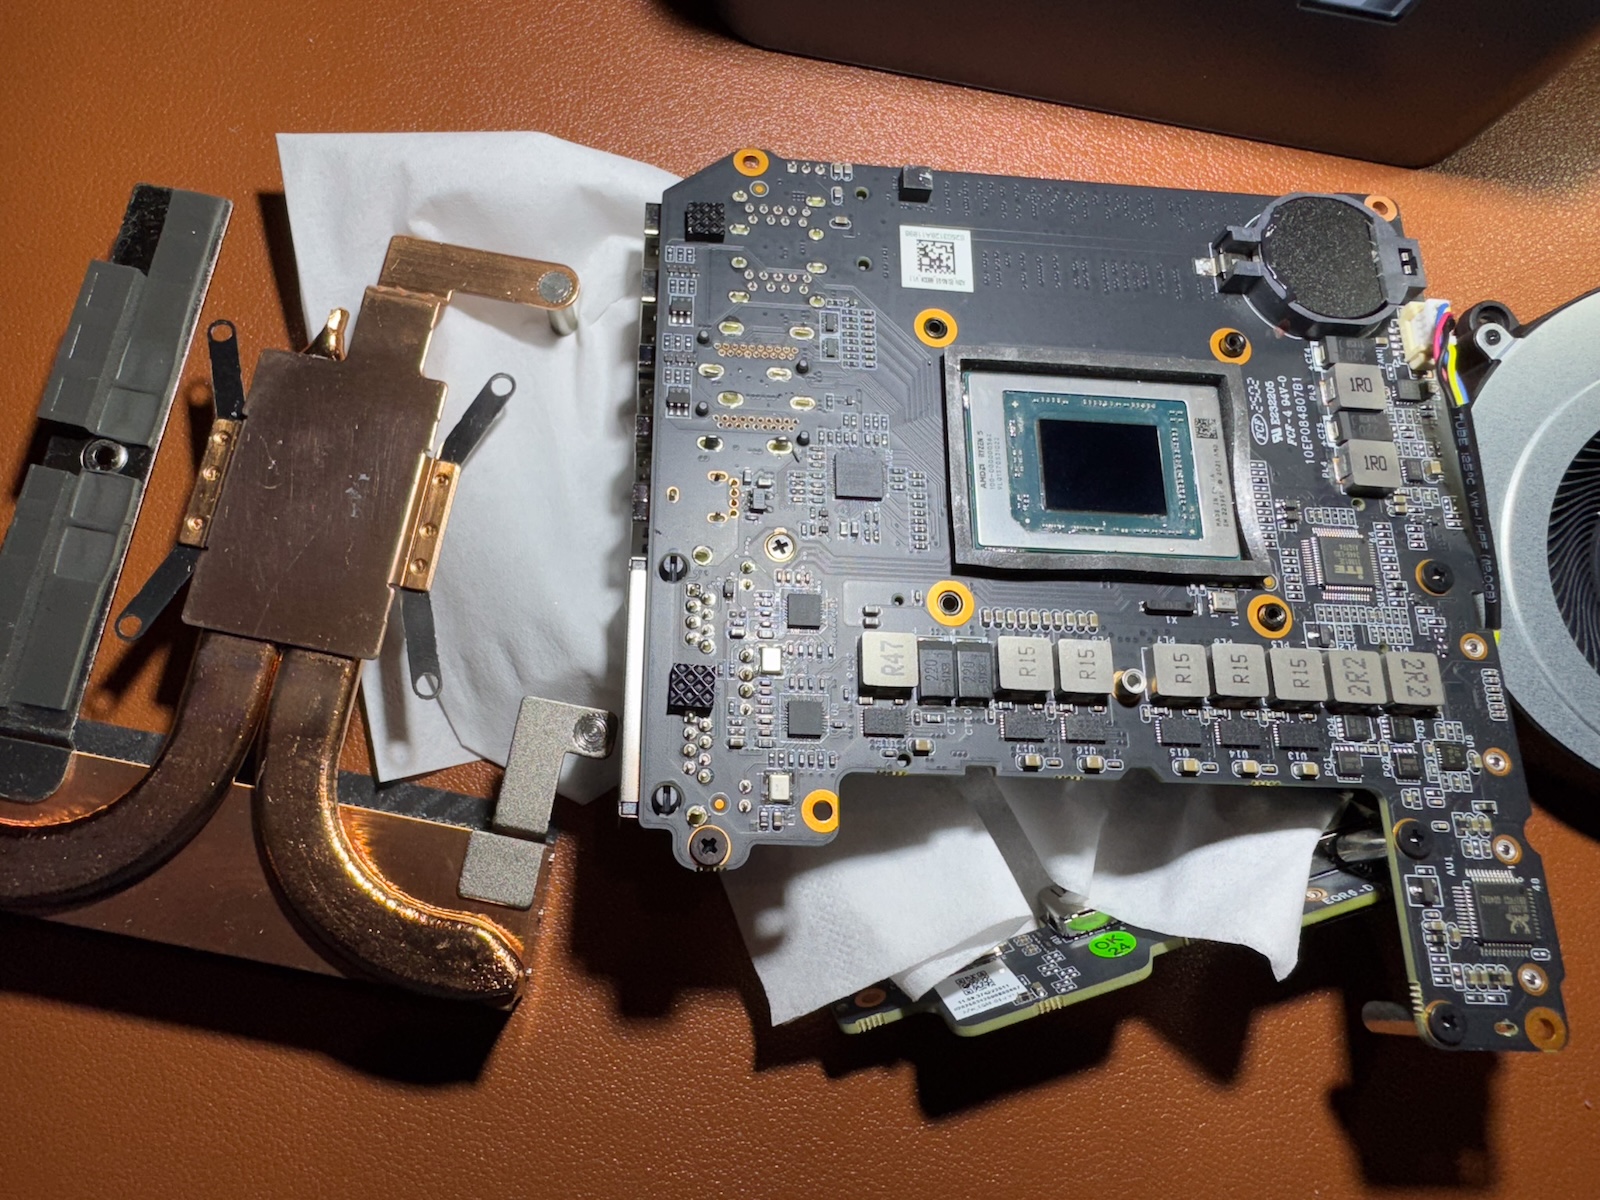
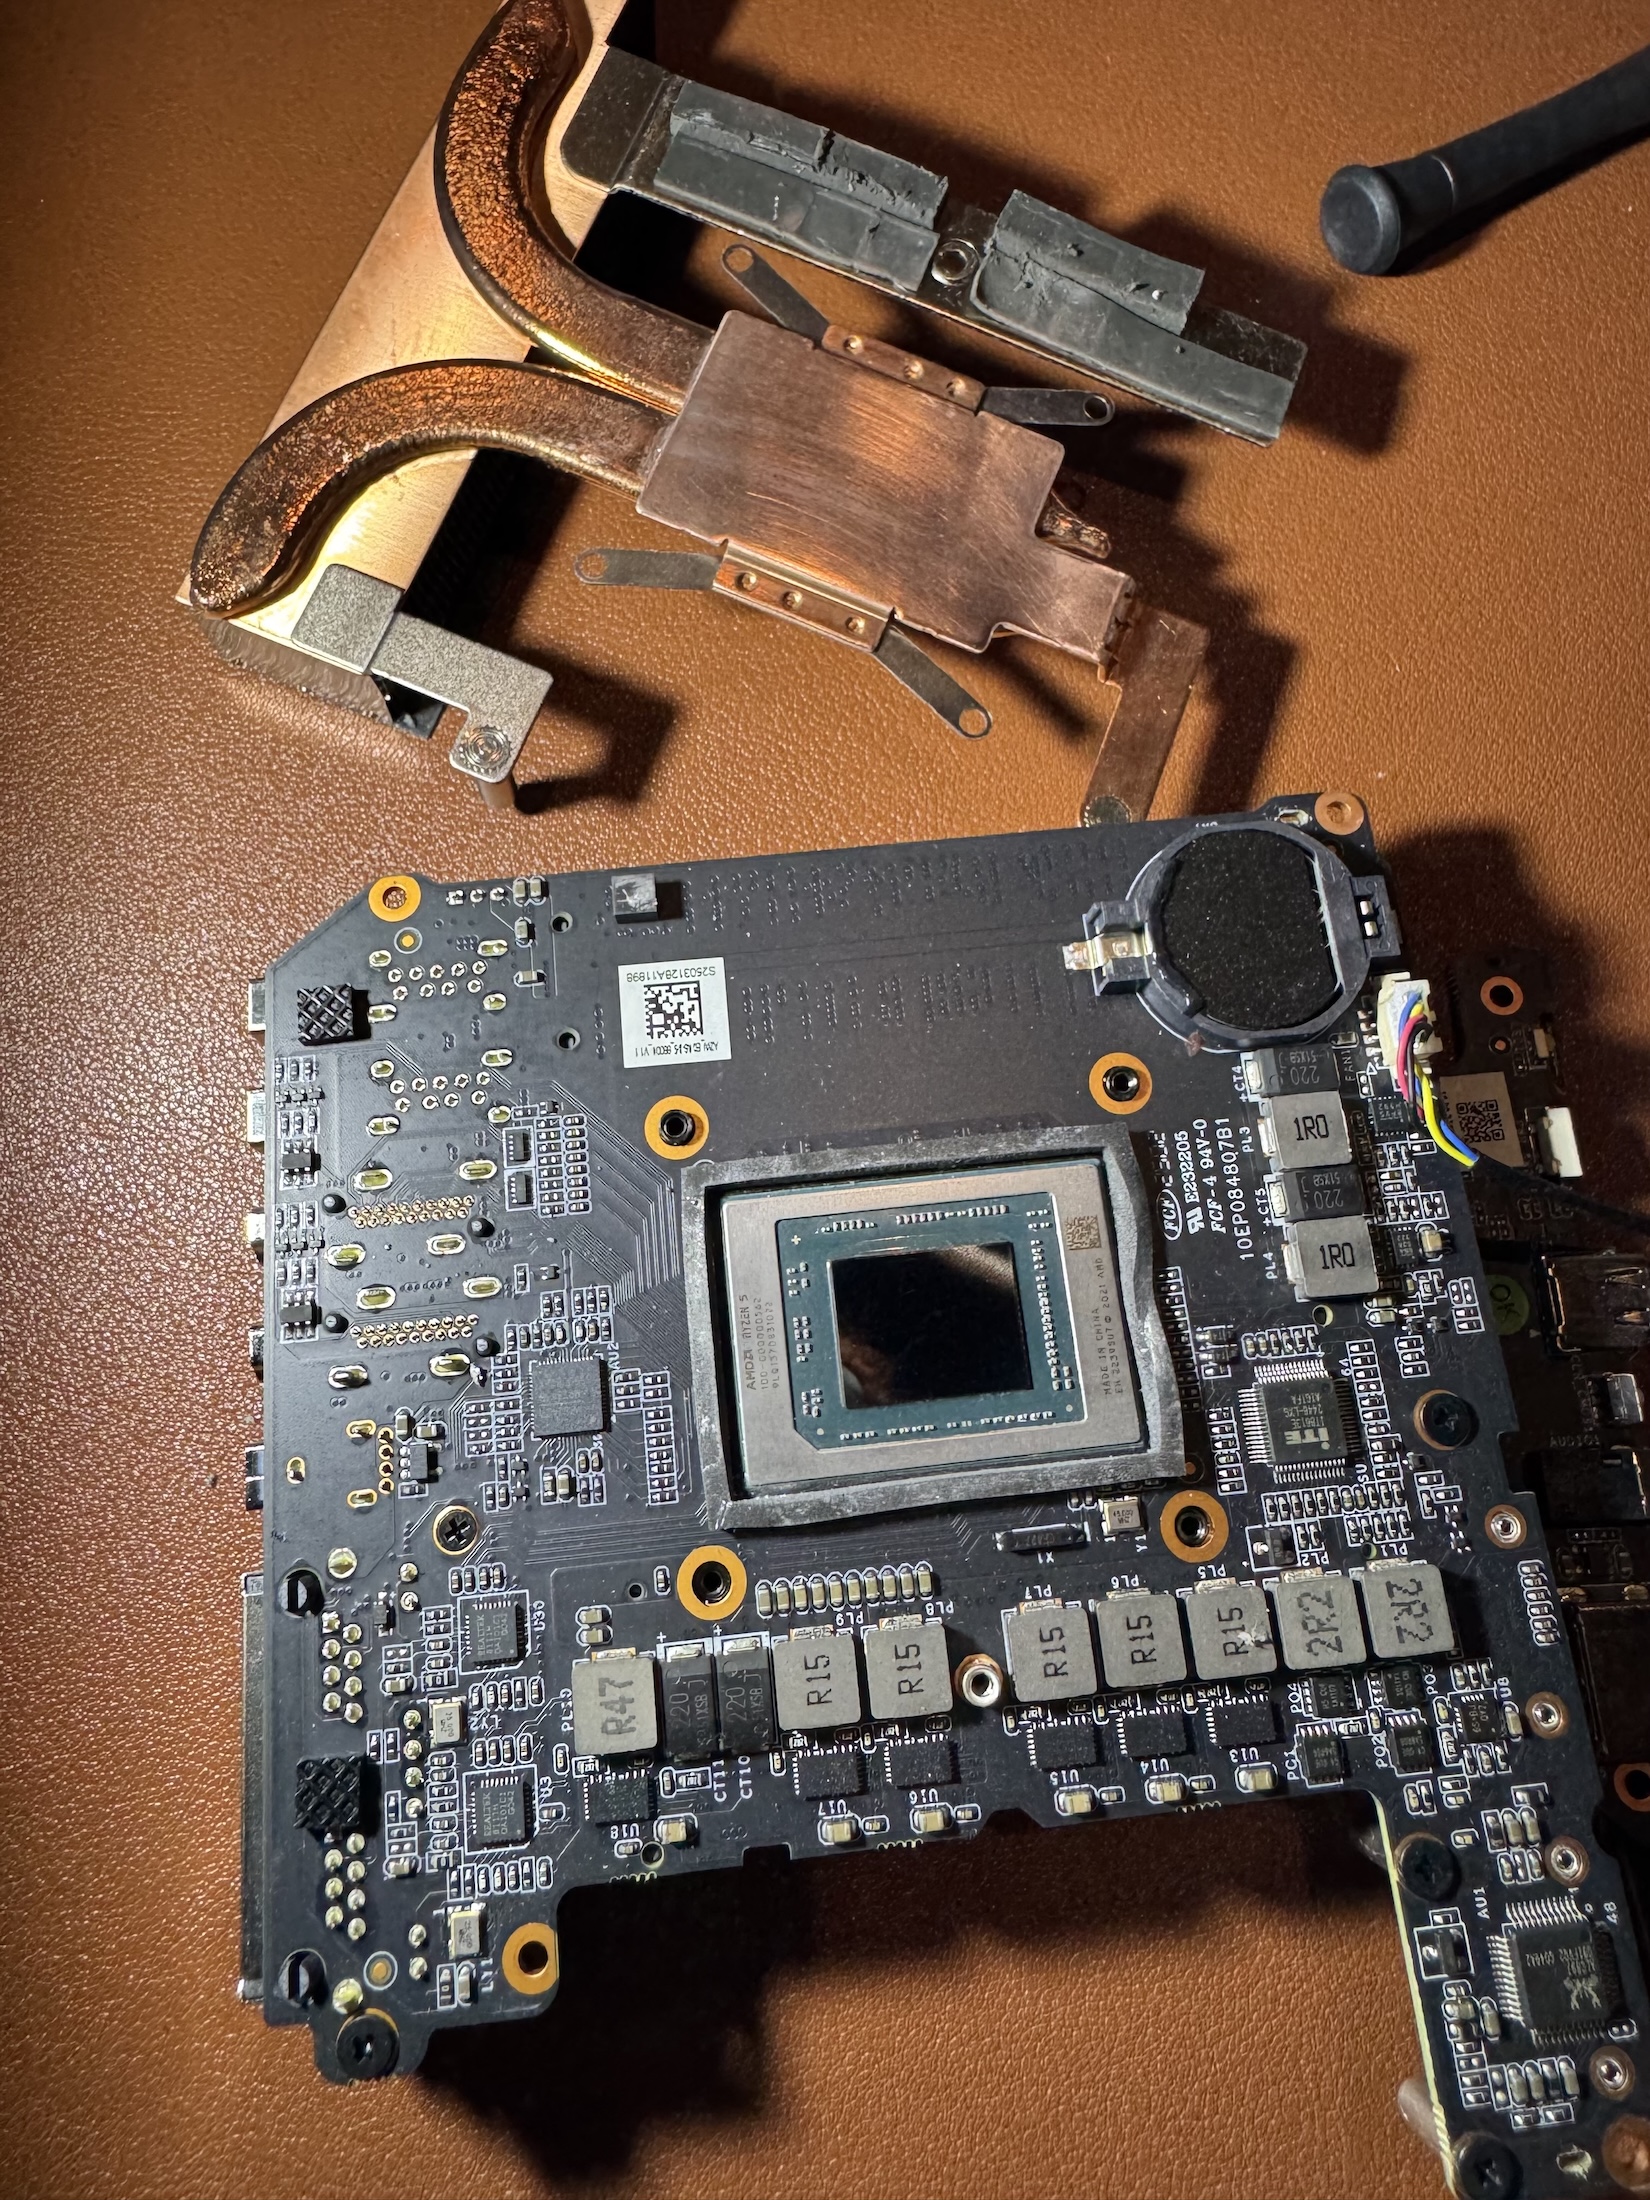
The final result with the lapped heatsink and cleaned CPU die
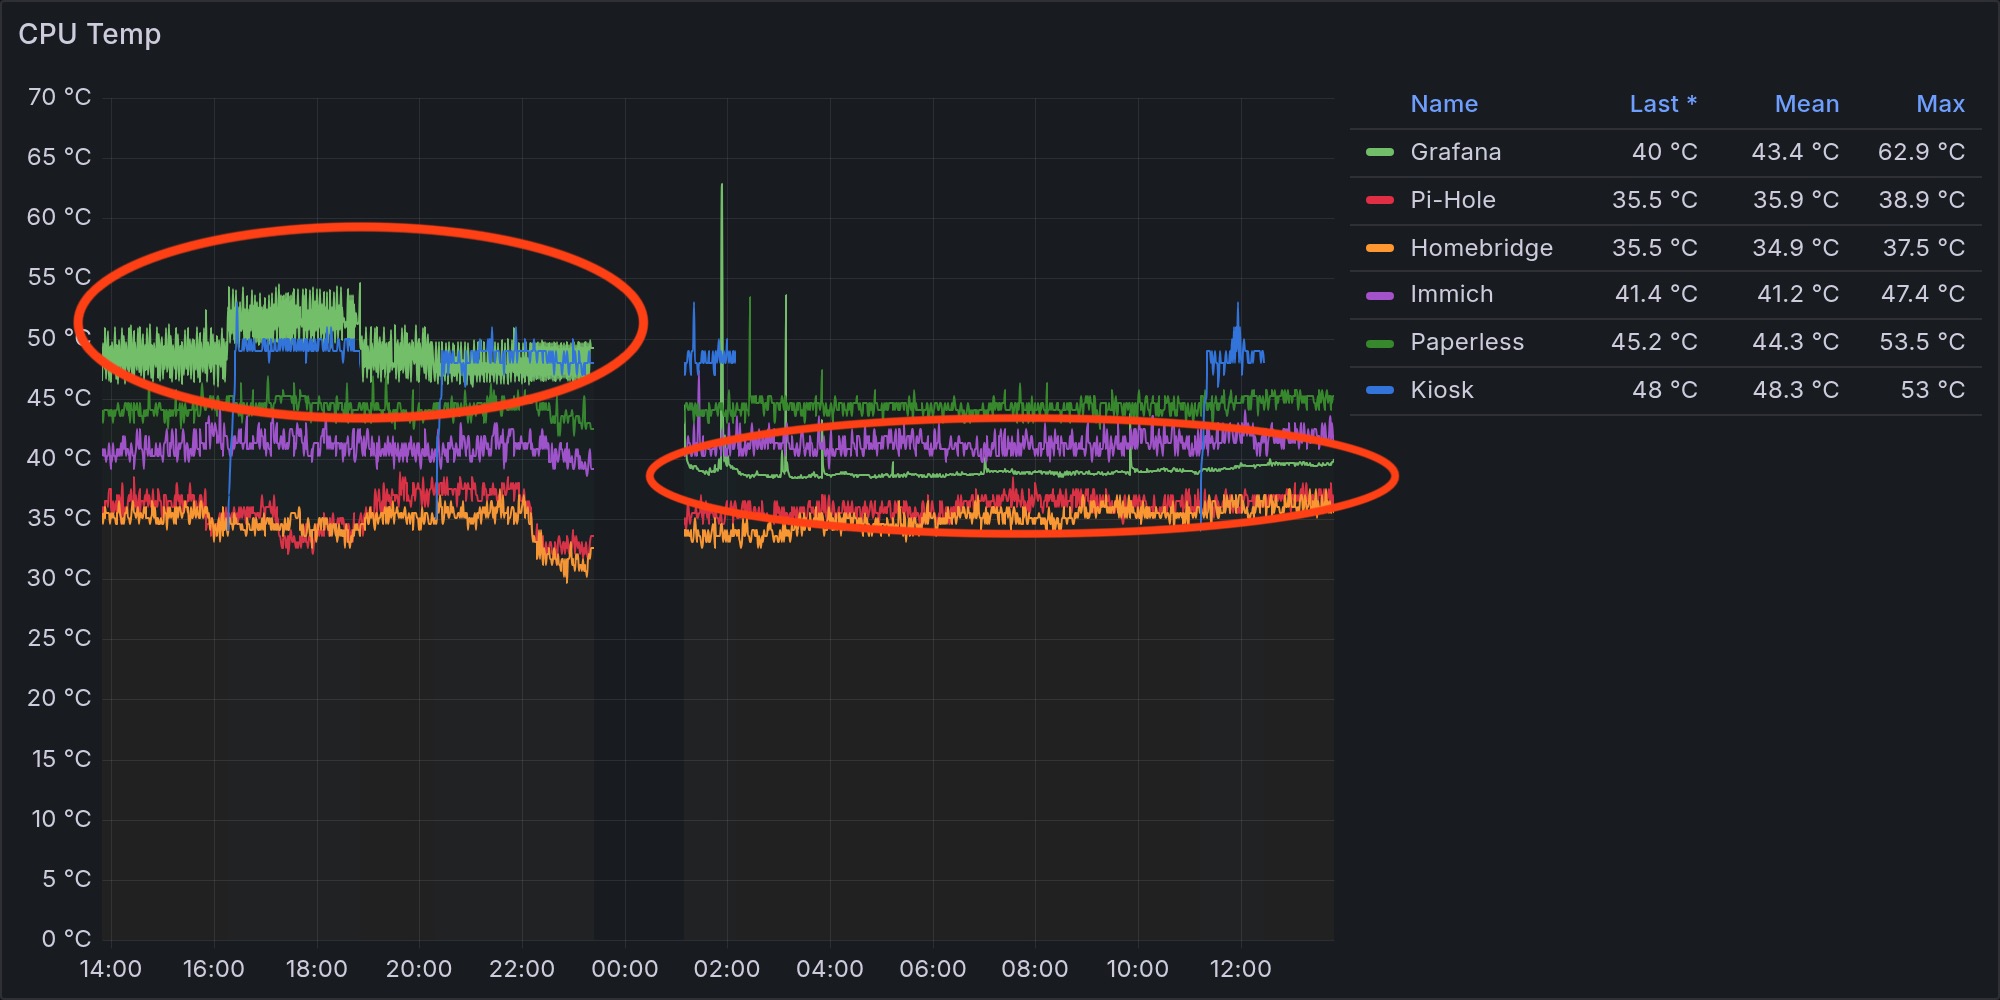
After the work, the temperature dropped by about 10 degrees! Nice (free) improvement.
Then I spent quite some time tweaking the BIOS settings to optimize power consumption by disabling unnecessary components like the Wi-Fi card (PCIe), USB-C charging, SATA controller, audio chipset, and more. I also reduced the memory allocated to the integrated GPU from the default 4GB to 64MB, and enabled the “Power On After Power Loss” option, which automatically powers on the mini PC when it receives electricity, without needing to press the power button.
This is especially useful: if something crashes and I can’t access the mini PC remotely via SSH (and I’m away from home), I can simply turn the smart plug off and back on. The mini PC will then boot up on its own.
Additionally, I increased the temperature threshold for fan activation (above 50°C) and adjusted the PWM profile to 0.15, allowing for a more gradual and quieter fan ramp-up, which suits my usage perfectly.
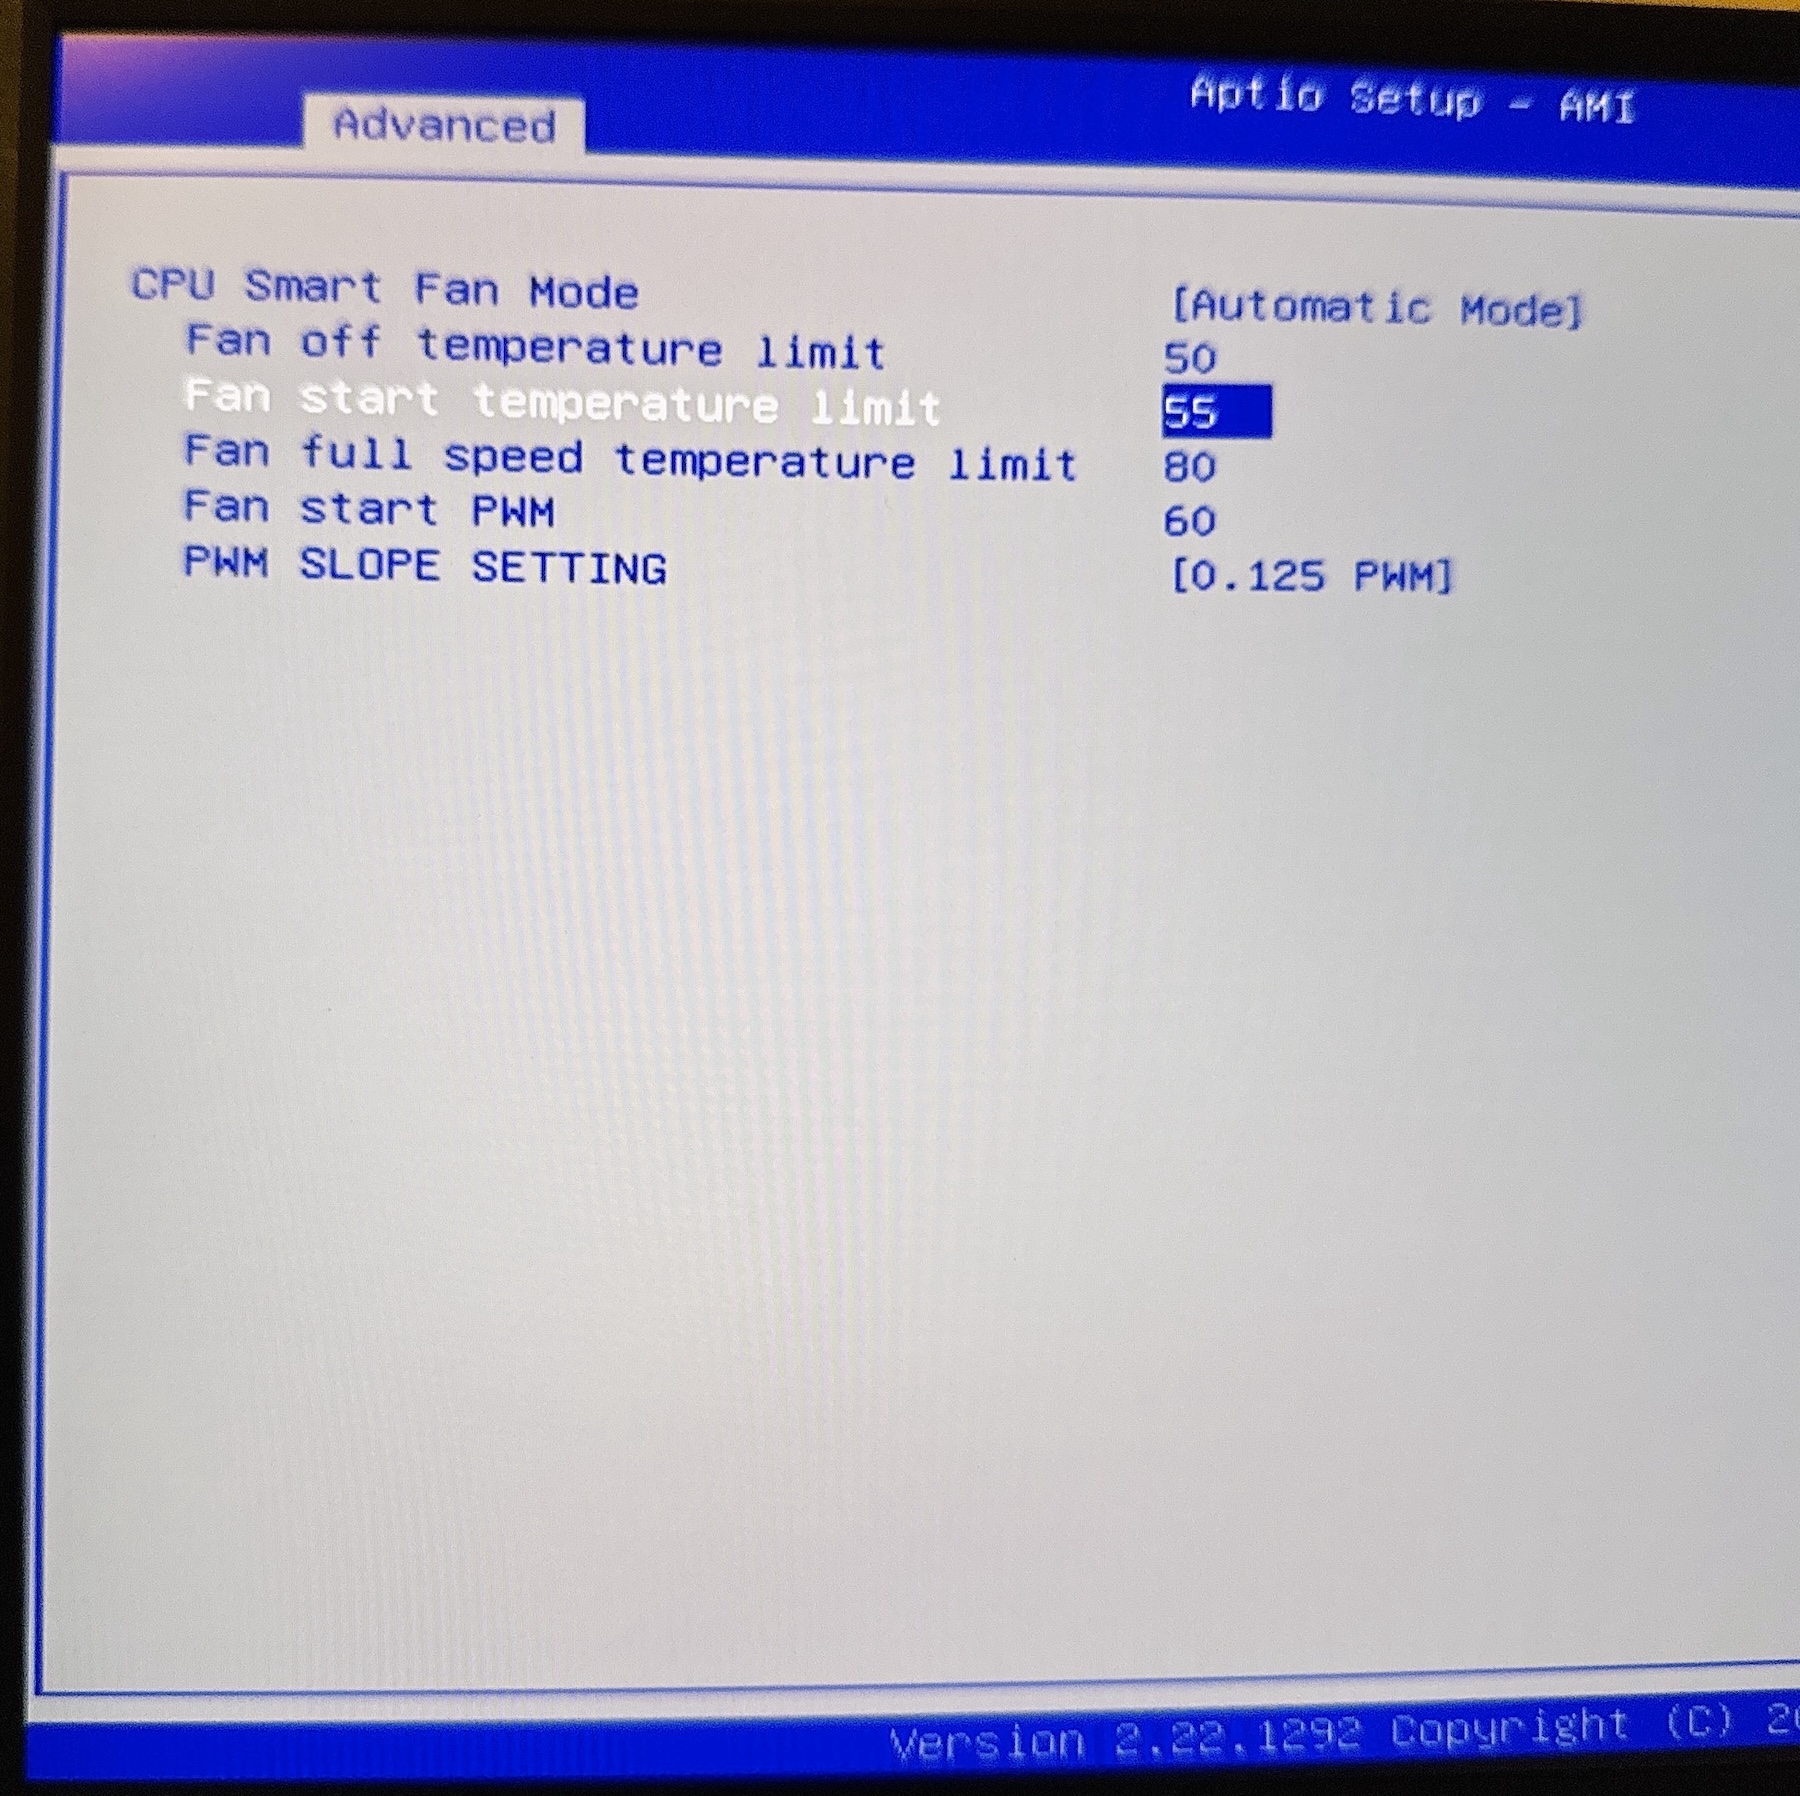
(Sorry for the quality of this photo)
These optimizations have reduced idle power consumption to around 10-12W, which I think is an excellent result.
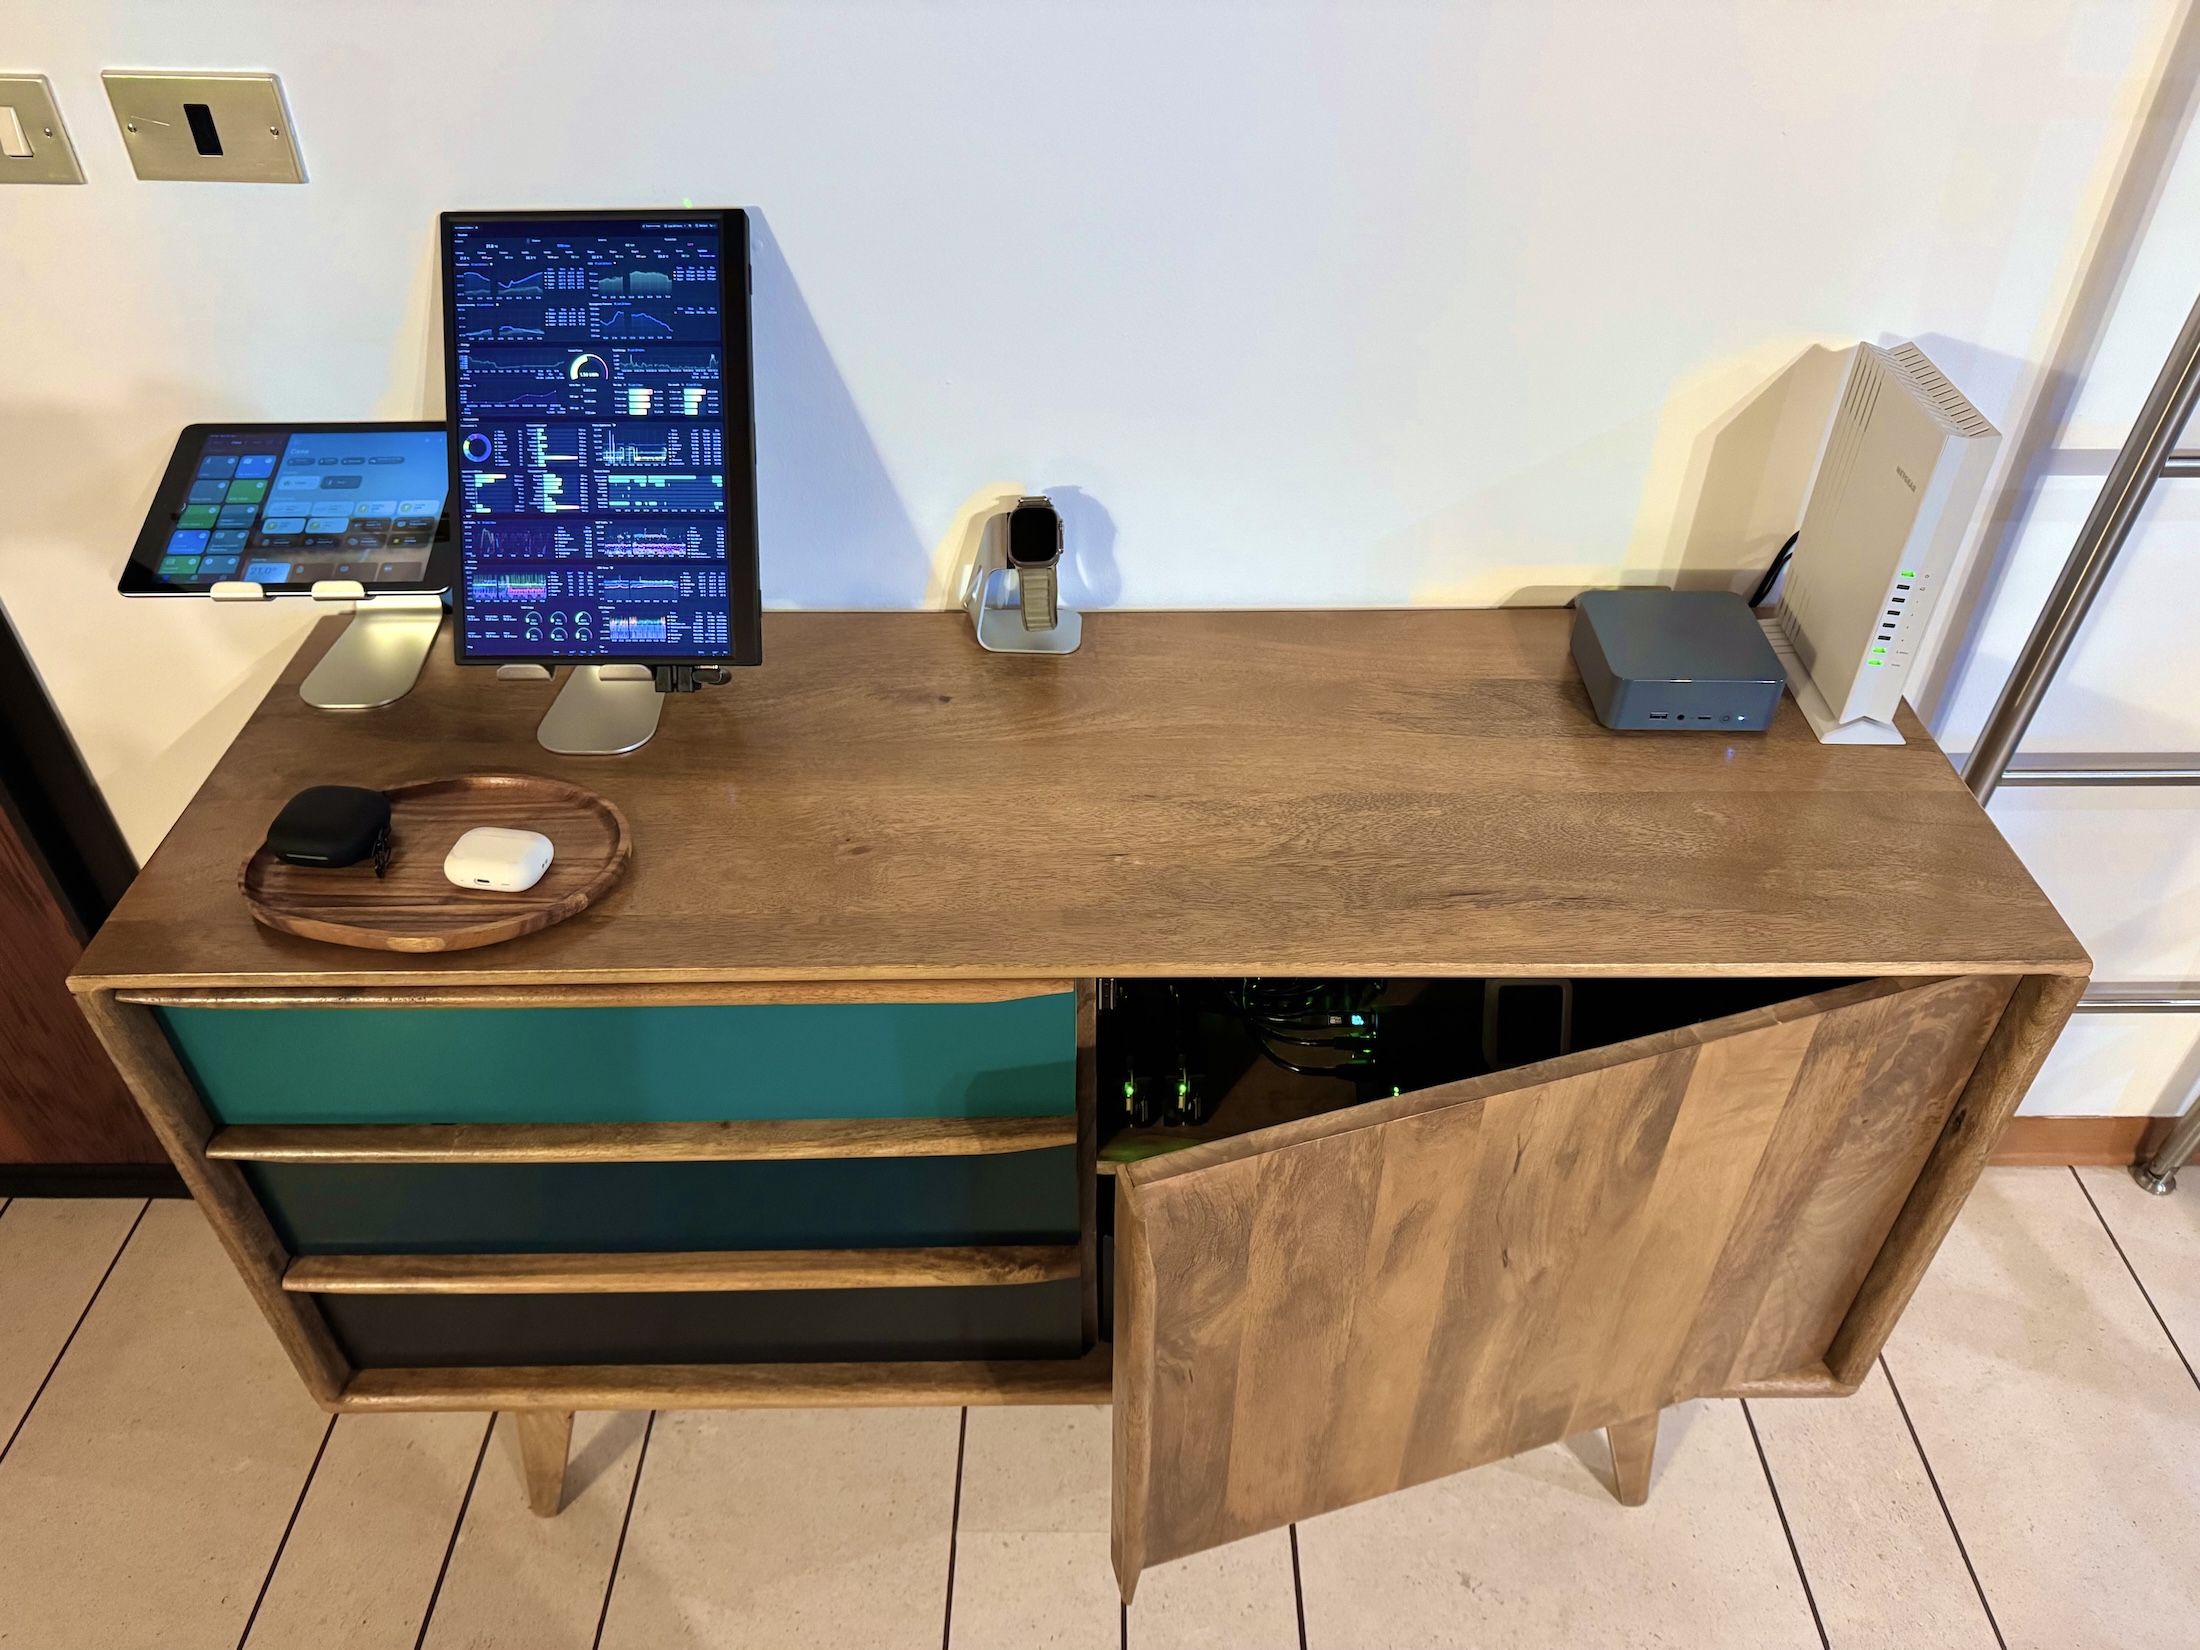
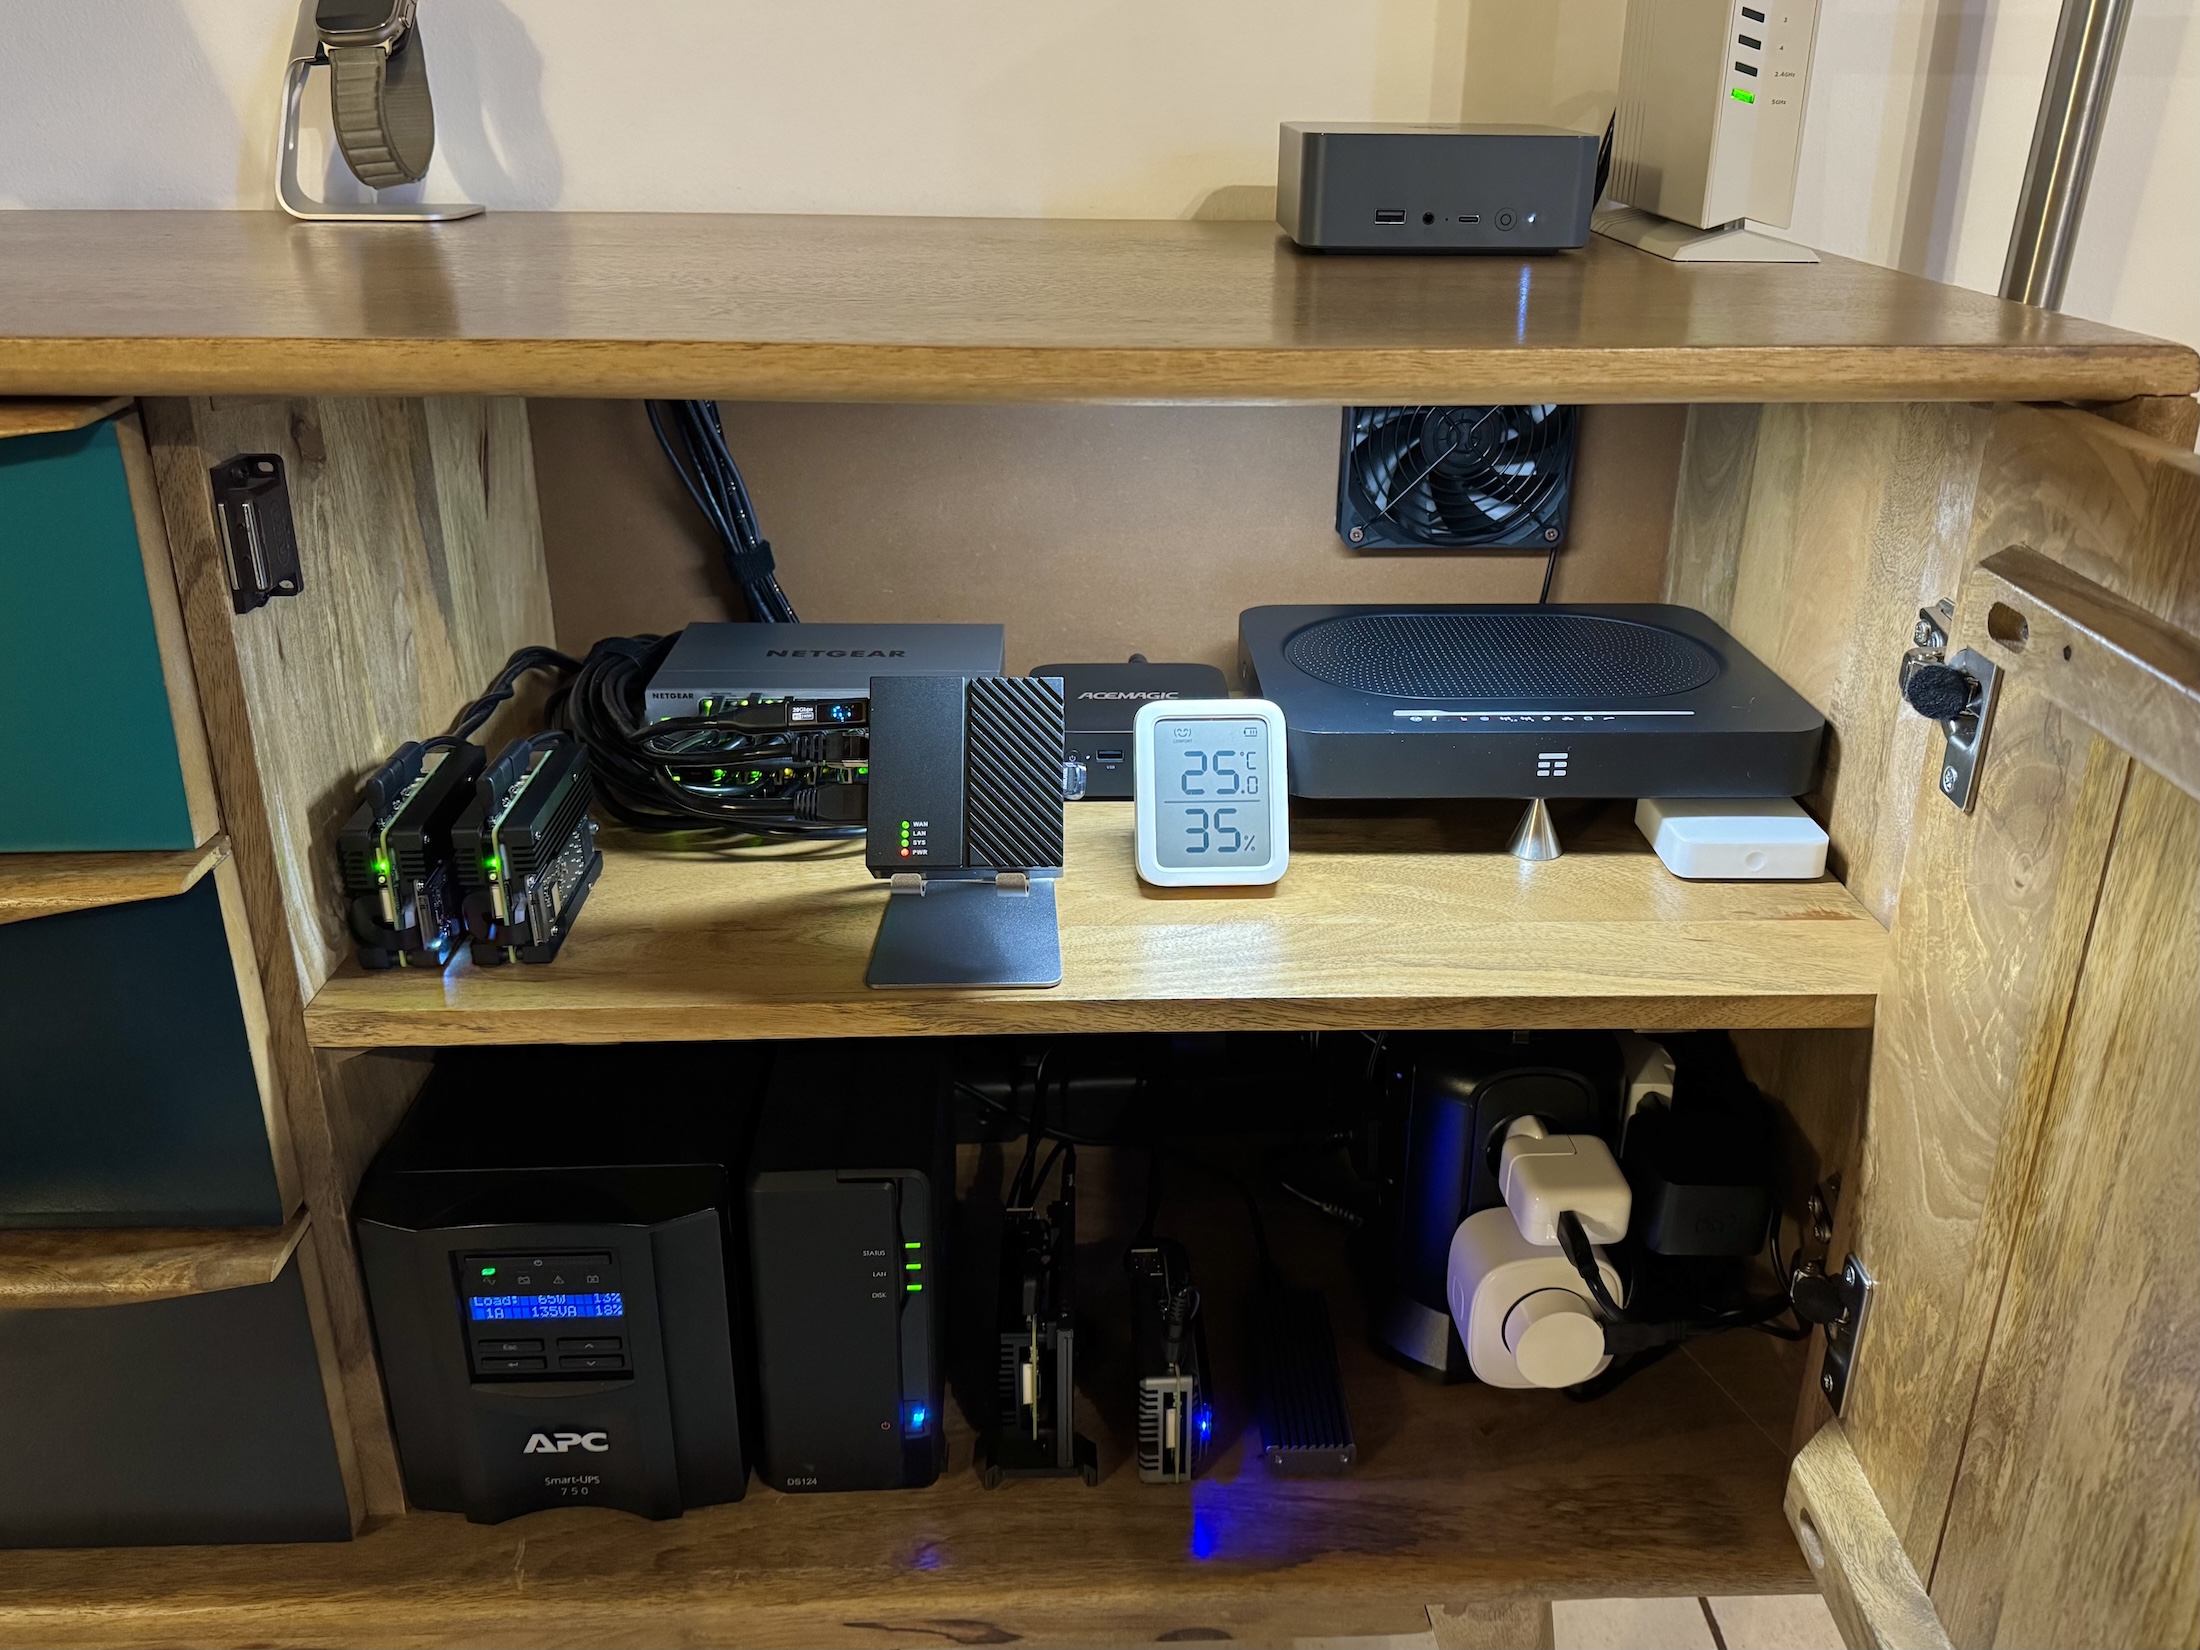
Installed in the home setup:
Software and migration
For this new setup, I decided to use my latest discovery: the excellent Alpine Linux. I had already used it for the mini PC kiosk (link), and since Alpine runs many services using OpenRC (the same init system as Gentoo), I still remembered at least a few things!
Since a direct migration from the Raspberry Pi to the mini PC wasn’t possible due to the difference in architectures, I manually reinstalled everything, taking the opportunity to improve and fix anything that wasn’t quite right (yes, I’m a perfectionist).
I also used this as a chance to remind myself of all the steps I had followed, as I couldn’t remember everything anymore.
First of all, I chose to install Alpine Linux Edge, with the most up to date repositories. Since this machine isn’t exposed to the internet, I wanted the latest versions of the software.
To make daily work more convenient, I enabled root login via SSH and SFTP. Alpine doesn’t use sudo but doas, which can be a bit annoying. So in nano /etc/ssh/sshd_config, I changed the following lines:
PermitRootLogin yes PasswordAuthentication yes Subsystem sftp /usr/lib/ssh/sftp-serverThen restarted the SSH service: rc-service sshd restart.
Next, I installed the core stack with apk:
- Grafana
- Prometheus
- Mimir
- Loki and Promtail
💡
For Prometheus, the version available in the Edge repositories is outdated. To get the latest version, just download it from the official GitHub releases and replace the binary in /usr/bin.
I then migrated the Grafana data by simply copying the old grafana/data directory into /var/lib/grafana/data on the new machine (this step is essential to retain all dashboards and alerts). I did the same for the Mimir data in /var/lib/mimir. For Prometheus, I skipped it since the data retention is only 2 weeks and I use Mimir as the primary data source in Grafana. Same goes for Loki as I didn’t bother copying old logs.
After copying the necessary data and checking file permissions, I added all the exporters for Prometheus. Since the previous ones were compiled for Arm, I had to re-download or recompile these exporter for x86.
grafana:/home/grafana/prometheus/exporter# ls -1 apk_updates-list.sh collectd_exporter json_exporter netatmo-exporter openrc-exporter pihole-exporter process_exporter snmp_exporter speedtest_exporterObviously, I copied the various configuration files of the exporters from the old directories, and I also checked which parameters were used to launch them via systemd, so I could replicate the same behavior using OpenRC.
For example, a service that was started with the following options in systemd:
[Unit] Description=Prometheus Pi-hole Exporter After=network.target [Service] Type=simple ExecStart=/home/grafana/prometheus/exporter/pihole-exporter/pihole_exporter -pihole_hostname 192.168.1.4 -pihole_port 8089 PIDFile=/run/pihole_exporter.pid Restart=on-failure RuntimeDirectory=pihole_exporter User=root Group=root [Install] WantedBy=multi-user.targetTranslated into an OpenRC service:
#!/sbin/openrc-run supervisor=supervise-daemon name="pihole_exporter" description="Prometheus Pi-hole Exporter" command="/home/grafana/prometheus/exporter/pihole-exporter/pihole_exporter" command_args="-pihole_hostname 192.168.1.4 -pihole_port 8089" pidfile="/run/pihole_exporter.pid" command_background=true command_user="grafana:grafana" output_log="/var/log/prometheus/exporters/pihole_exporter.log" error_log="/var/log/prometheus/exporters/pihole_exporter.log" start_pre() { checkpath --directory --owner grafana:grafana /run checkpath --directory --owner grafana:grafana /var/log/prometheus/exporters checkpath --file --owner grafana:grafana "$pidfile" checkpath --file --owner grafana:grafana "$output_log" }Then I removed the comment on the line rc_parallel="YES" inside /etc/rc.conf to have a faster boot.
💡
I decided to use supervise-daemon for the exporters and custom services, so I can track how long they’ve been running, whether they’ve been restarted (and how many times), and check any OpenRC error codes.
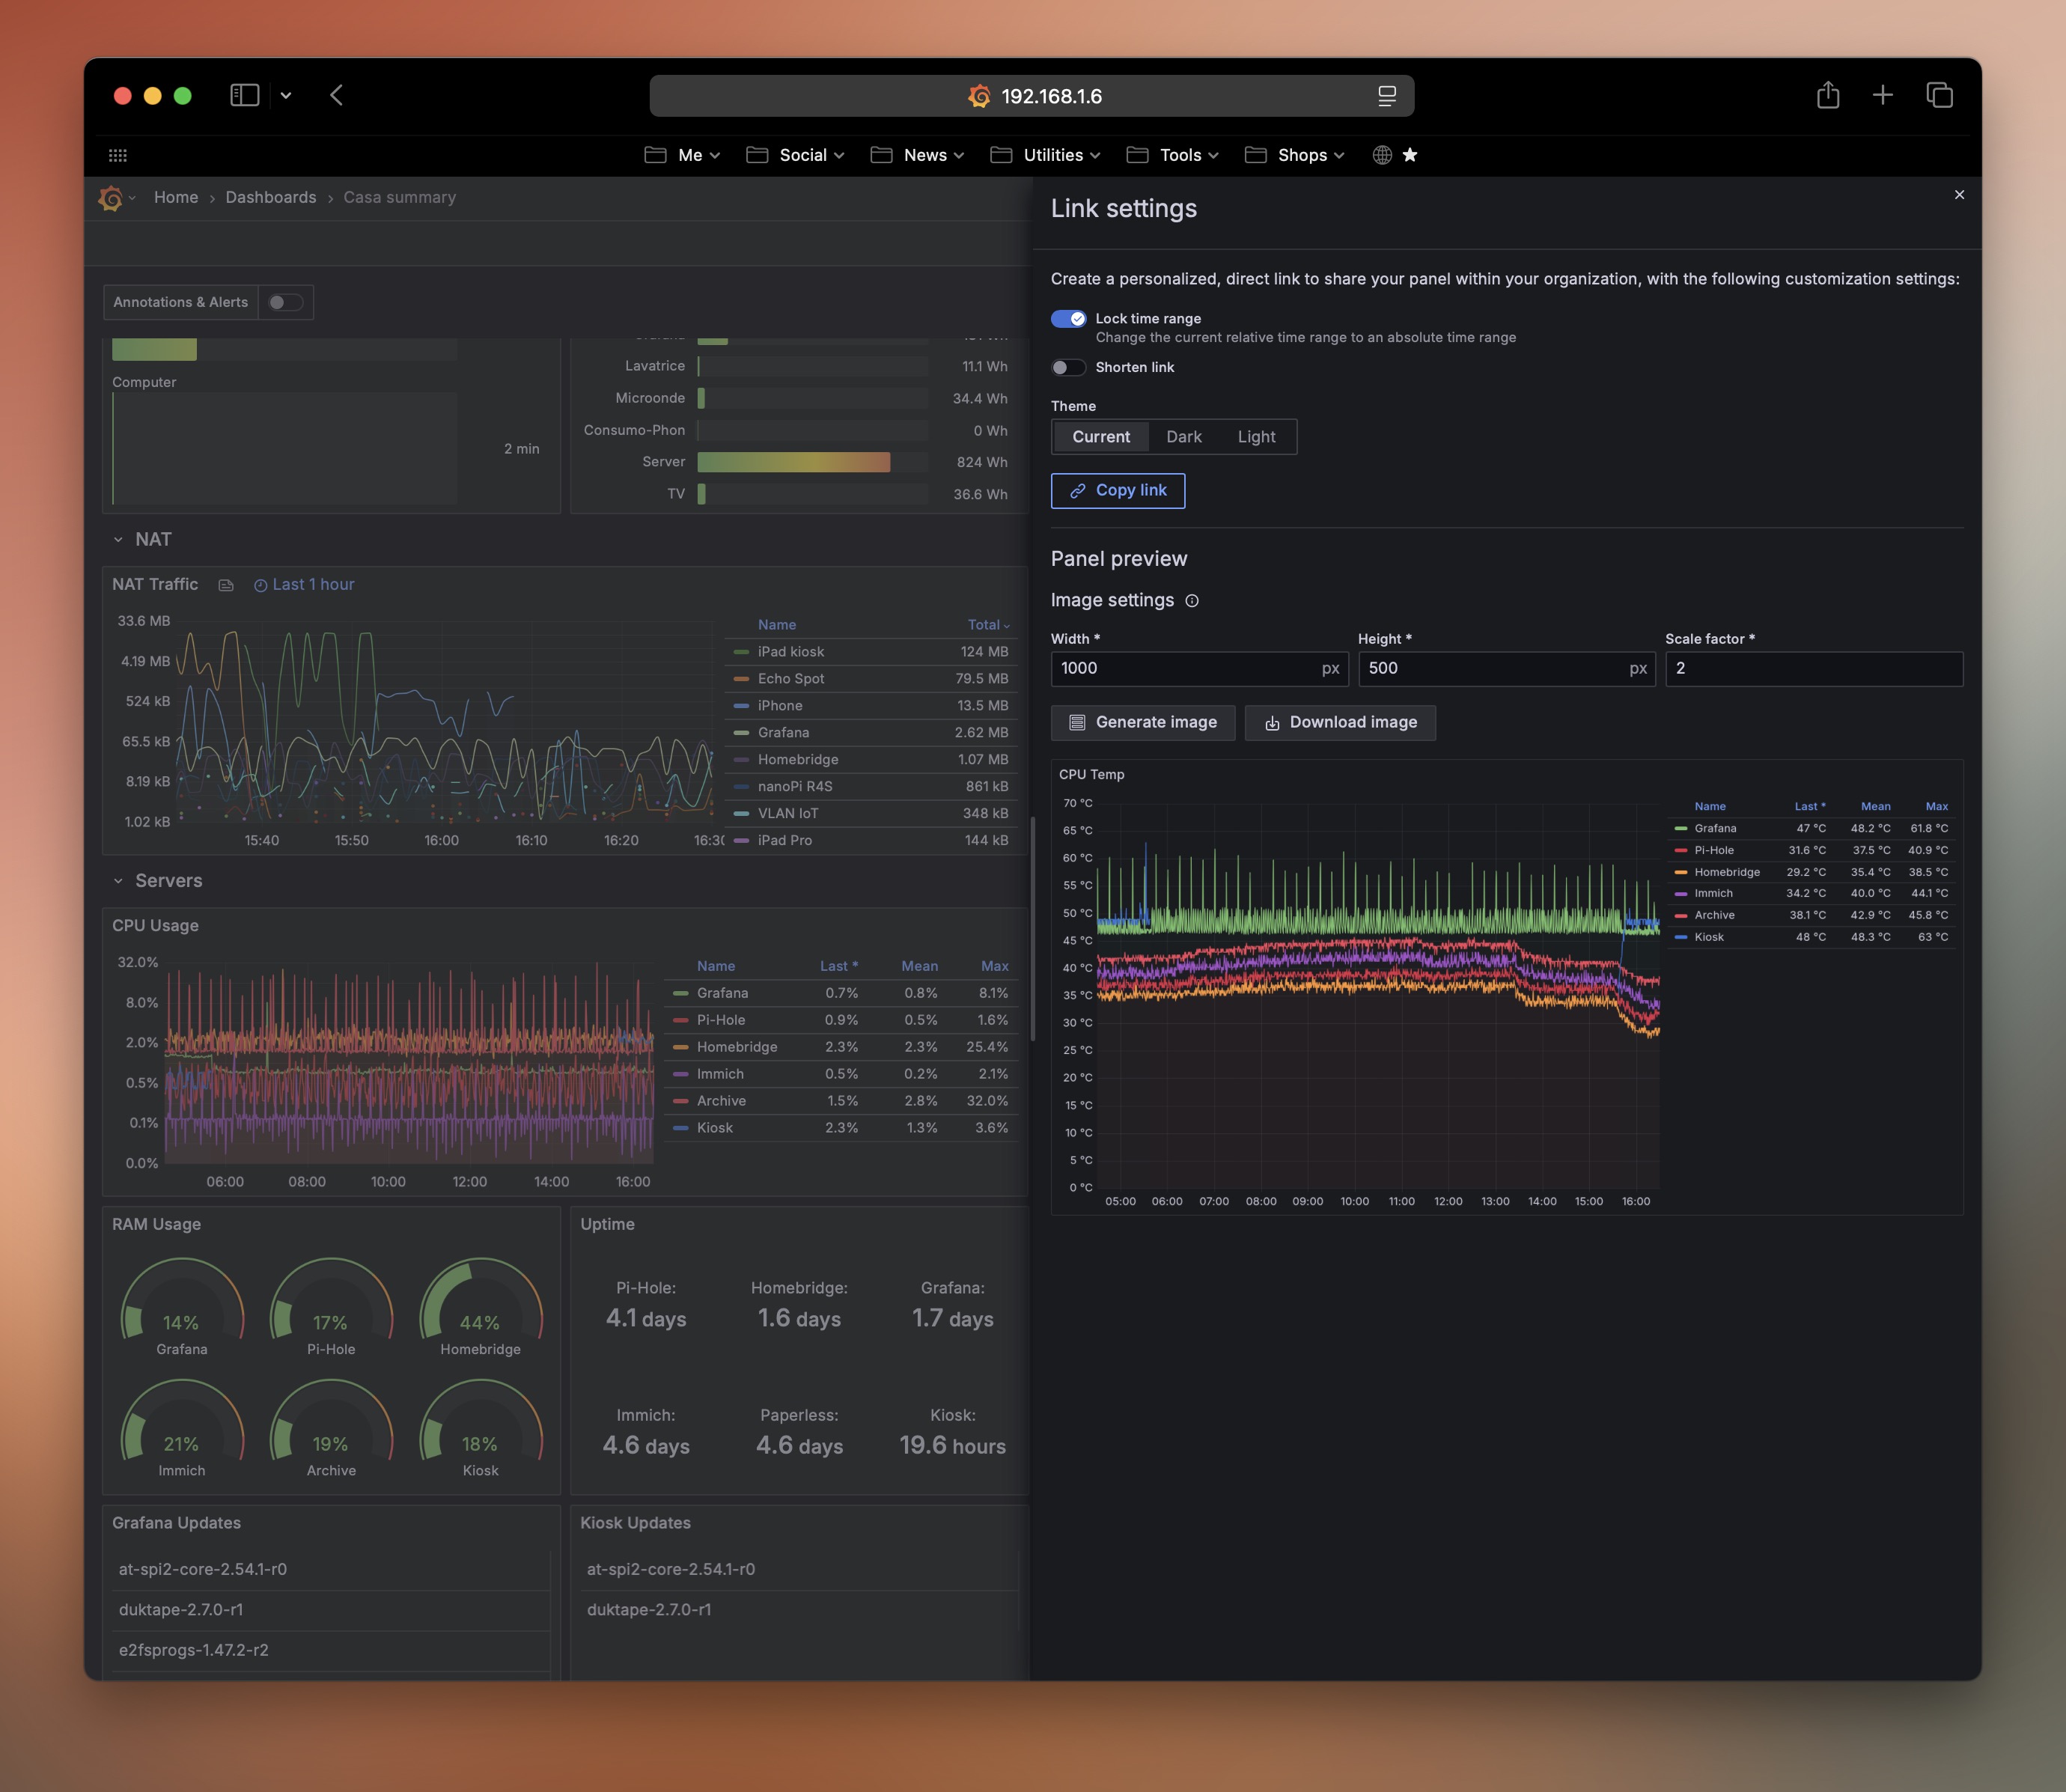
Grafana Image Rendering plugin
A separate mention for the grafana-image-renderer plugin, which was also the main reason I switched to x86.
To install it on Alpine Linux, you can’t use the standard command grafana-cli plugins install grafana-image-renderer, because it installs a version compiled with libc, whereas Alpine uses musl. The result: Grafana crashes at startup.
You need to go to the GitHub page and download the plugin file plugin-alpine-x64-no-chromium.zip. Extract it into your Grafana plugins directory (usually /var/lib/grafana/plugins), and install Chromium separately with apk add chromium
Once this is done, you need to verify that the Grafana configuration file /etc/grafana/grafana.ini contains the correct section [plugin.grafana-image-renderer]. I left everything as default, only modifying the path to the Chromium executable: rendering_chrome_bin = /usr/bin/chromium
If you want, you can try experimenting with the rendering_args = but I have noticed that it only causes problems because Chromium on Alpine already uses the necessary flags, in my case these:
--ozone-platform-hint=auto --allow-pre-commit-input --disable-background-networking --disable-background-timer-throttling --disable-backgrounding-occluded-windows --disable-breakpad --disable-client-side-phishing-detection --disable-component-extensions-with-background-pages --disable-component-update --disable-default-apps --disable-dev-shm-usage --disable-extensions --disable-hang-monitor --disable-infobars --disable-ipc-flooding-protection --disable-popup-blocking --disable-prompt-on-repost --disable-renderer-backgrounding --disable-search-engine-choice-screen --disable-sync --enable-automation --export-tagged-pdf --generate-pdf-document-outline --force-color-profile=srgb --metrics-recording-only --no-first-run --password-store=basic --use-mock-keychain --disable-features=Translate,AcceptCHFrame,MediaRouter,OptimizationHints,ProcessPerSiteUpToMainFrameThreshold,IsolateSandboxedIframes --enable-features=PdfOopif --headless --hide-scrollbars --mute-audio --disable-gpu --disable-software-rasterizer --remote-debugging-port=0Backup using Rsync on the NAS
Then I needed to set up an automatic backup to my NAS, so I wrote a script that:
- checks if the NAS folder is mounted
- if not, mounts it
- backs up the main folders
- deletes backups older than 2 days
- and writes a log file
And here the completed backup log:
[2025-05-30 23:27:13] 🔁 Start daily backup [2025-05-30 23:27:13] ✅ NAS correctly mounted on /mnt [2025-05-30 23:27:13] Start full backup in /mnt/grafana_backup/grafana_backup_2025-05-30_23-27 [2025-05-30 23:35:24] ✅ Backup completed in /mnt/grafana_backup/grafana_backup_2025-05-30_23-27 [2025-05-30 23:35:24] 🧹 Cleaning the old backups... [2025-05-30 23:35:24] 🏁 Backup completedIt runs every day at 4 AM
Better logs in Grafana
Since I configured OpenRC to write all the exporters’ logs to /var/log/prometheus/exporters, I can now easily view those logs in a “Logs” panel directly on the Grafana dashboard.
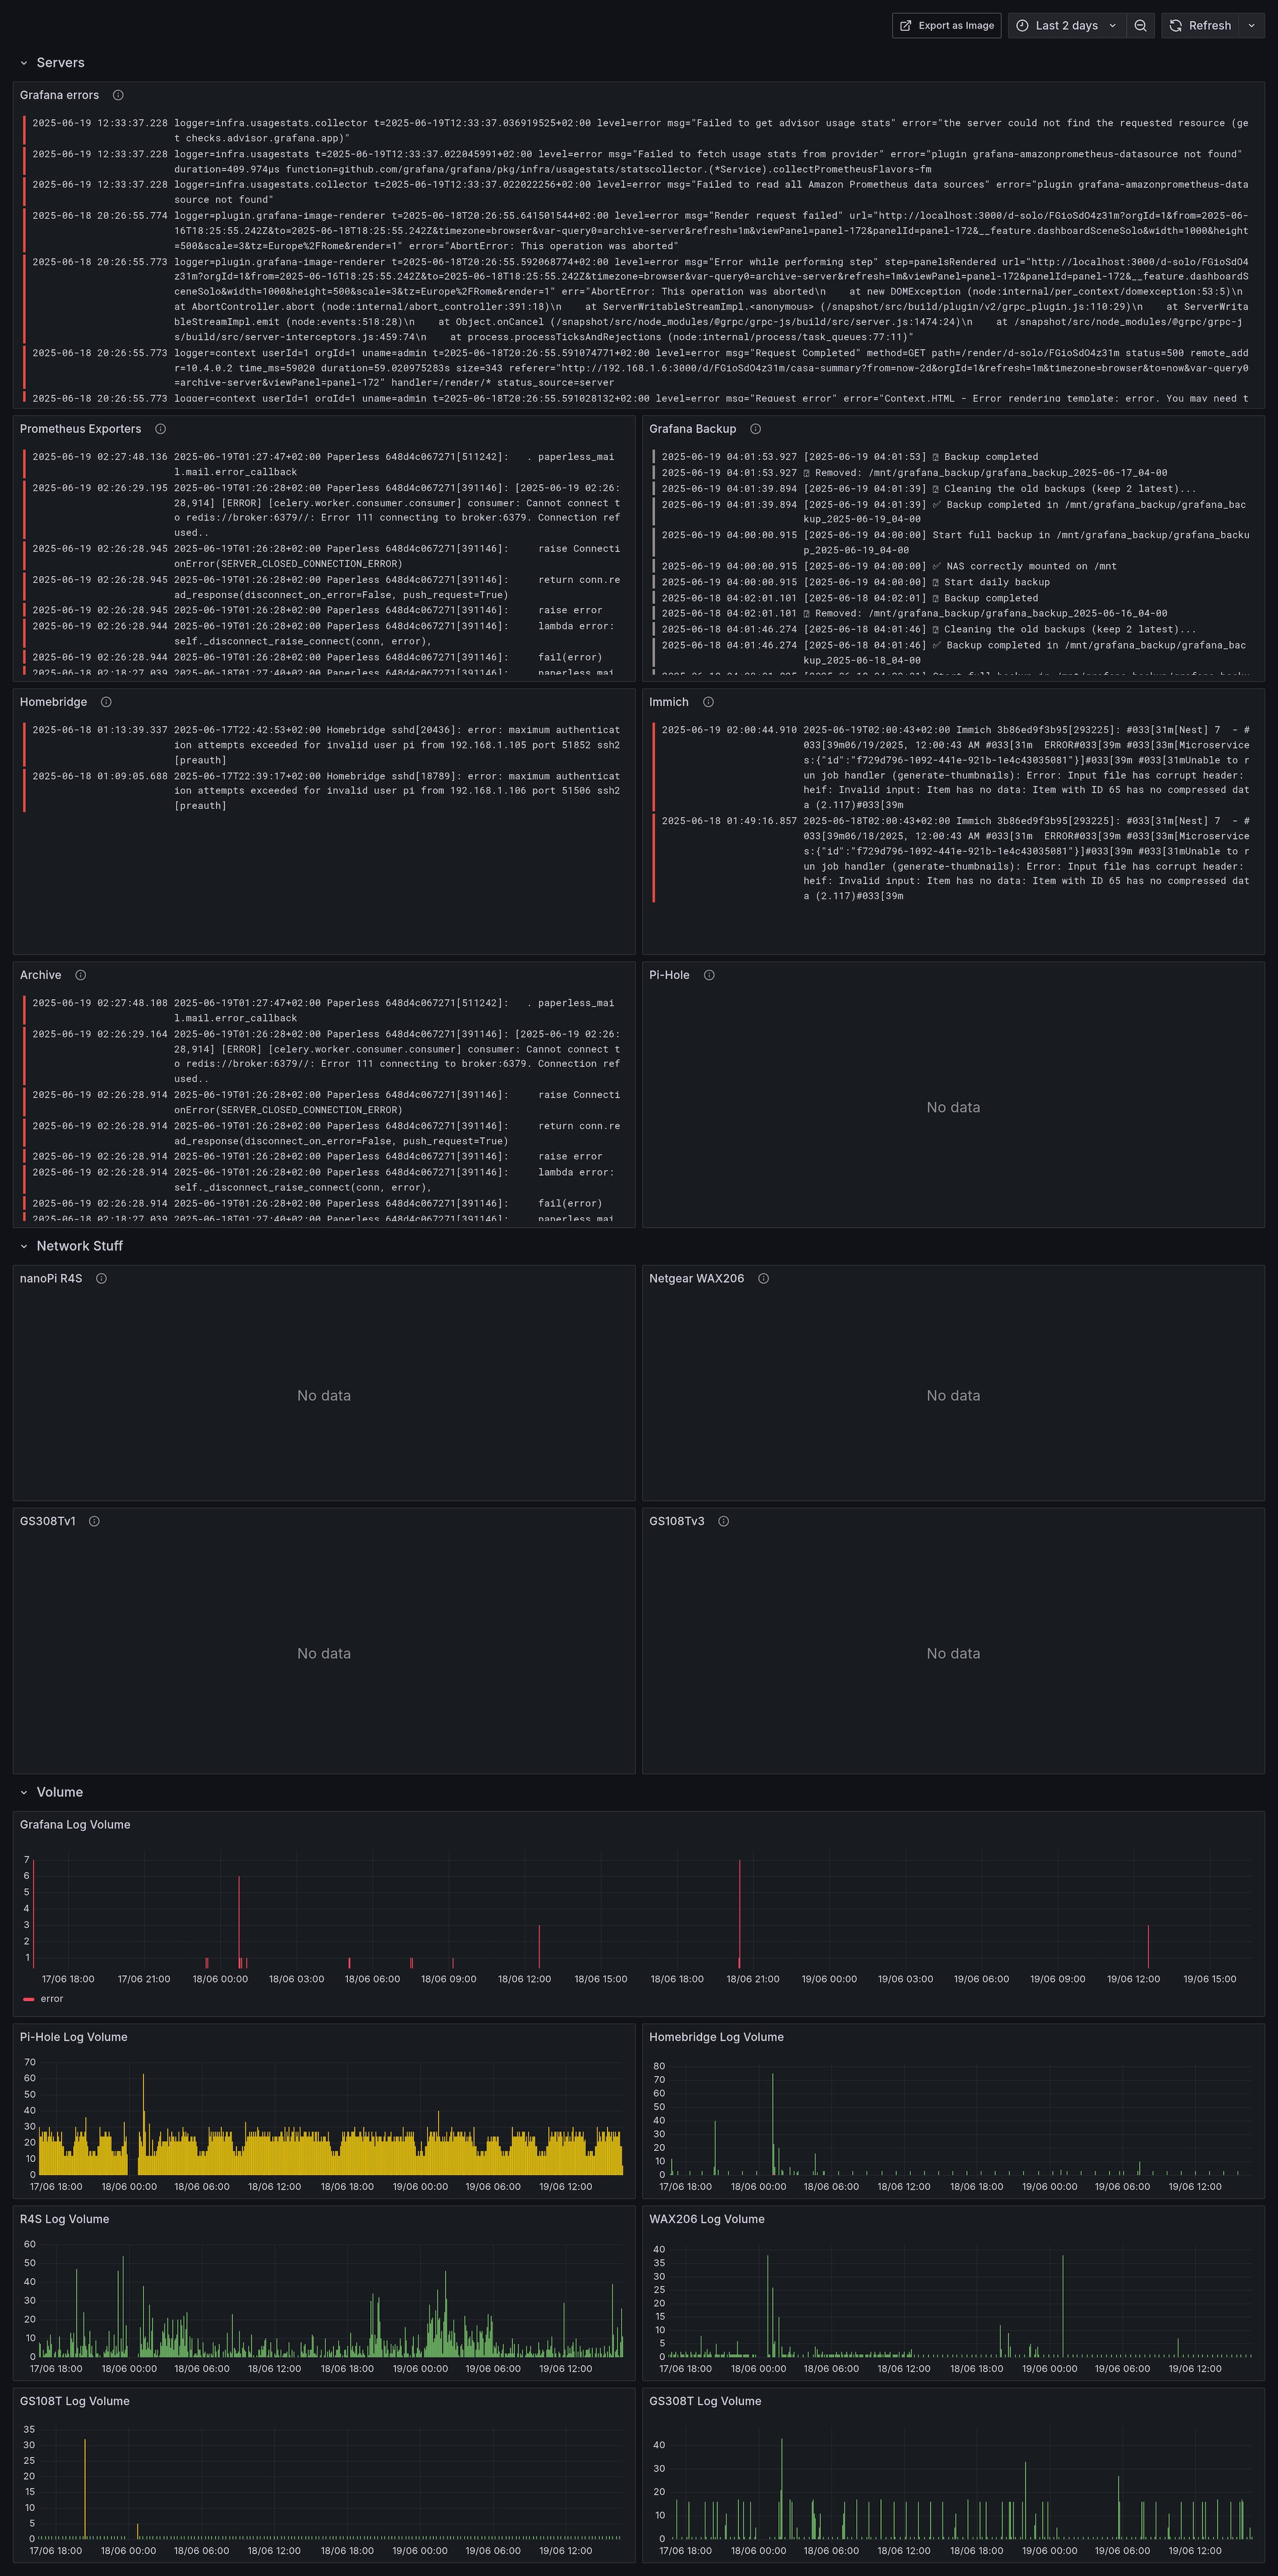
You might see "no data" in some panels because I apply filters to show only logs containing the word "error".
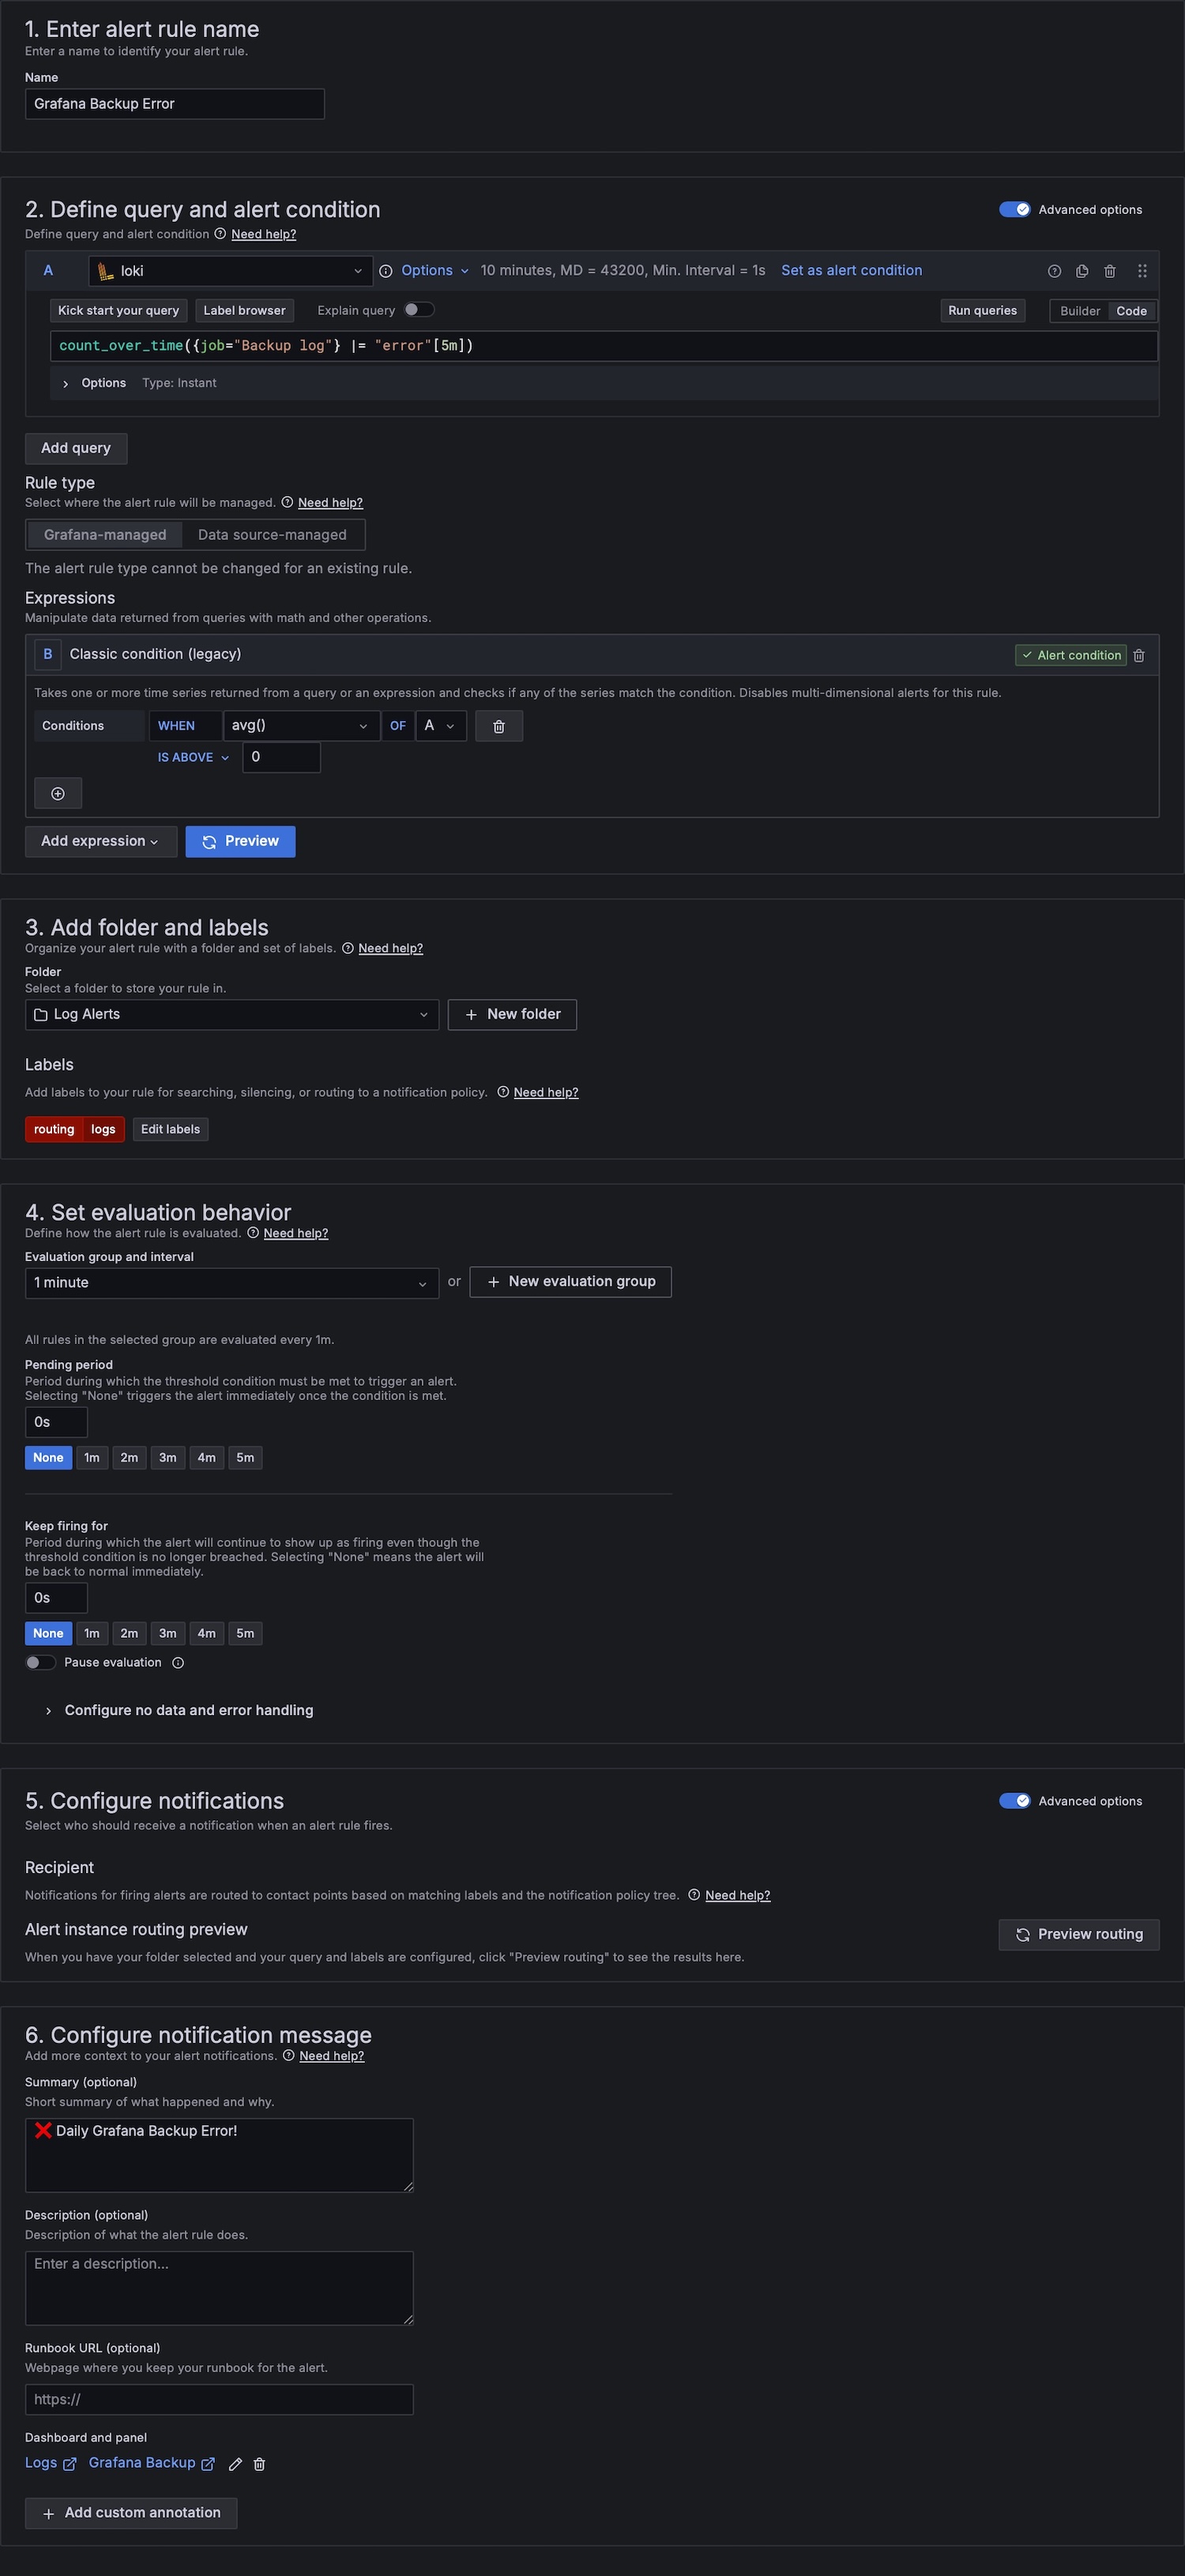
Thanks to this setup, I can also use Grafana alerts if there’s any issue, I receive a push notification on my phone.
For example, for daily Grafana backups:

Email reports
To receive emails with the daily screenshot of the main dashboard, I decided to create a new Gmail account and send the emails using Mutt.
However, since the PNG files generated by grafana-image-render were a bit too large, I added a conversion step using ImageMagick to compress them into JPG format — reducing the size from ~5MB to ~2MB.
The process now works as follows: generate the PNG image → save → convert to JPG with compression → send the email with the JPG → delete the original PNG:
DASHBOARD_URL="http://192.168.1.6:3000/render/d/FGioSdO4z31m/casa-summary?from=now-24h&orgId=1&width=1800&height=-1&render=1&scale=2&kiosk" PNG_IMAGE="/tmp/daily_dashboard.png" JPEG_IMAGE="/tmp/daily_dashboard.jpg" RECIPIENT="[email protected]" SUBJECT="📊 Daily Grafana Dashboard" API_KEY="xyz" echo "[INFO] Starting dashboard rendering..." curl -s -H "Authorization: Bearer $API_KEY" -o "$PNG_IMAGE" "$DASHBOARD_URL" echo "[INFO] Waiting 3 seconds to ensure image rendering is complete..." sleep 3 echo "[INFO] Converting PNG to JPEG..." magick "$PNG_IMAGE" -sampling-factor 4:2:0 -quality 25 "$JPEG_IMAGE" echo "[INFO] Sending email with JPEG image..." echo "" | mutt -s "$SUBJECT" -a "$JPEG_IMAGE" -- "$RECIPIENT" rm -f "$PNG_IMAGE"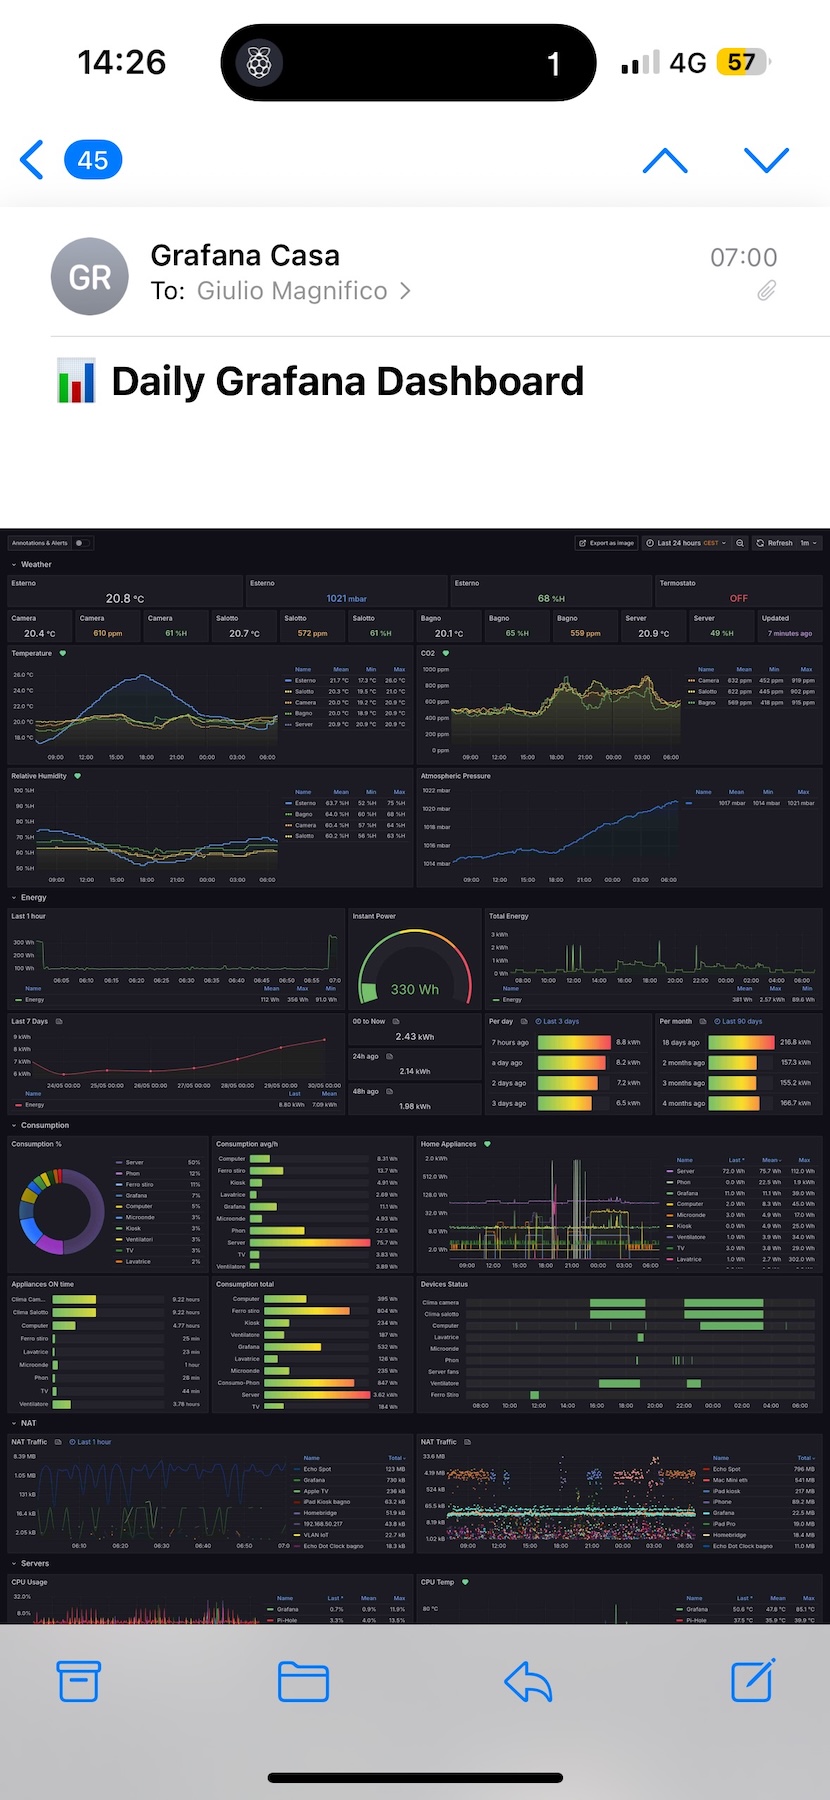
Cute welcome script
Another lovely and pointless thing I added is a small script that greets me at every SSH login:
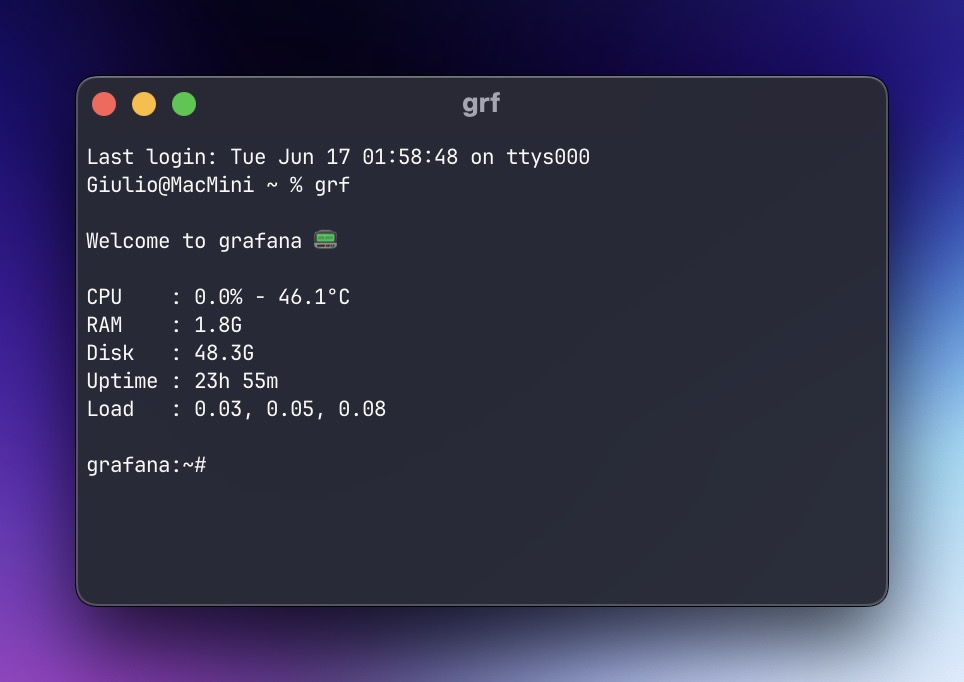
Here it is, in case you want to take inspiration:
#!/bin/sh # /etc/profile.d/motd_script.sh hostname=$(hostname) uptime_sec=$(cut -d. -f1 /proc/uptime) uptime_min=$((uptime_sec / 60)) uptime_hr=$((uptime_min / 60)) uptime_min=$((uptime_min % 60)) uptime="${uptime_hr}h ${uptime_min}m" load=$(awk '{print $1", "$2", "$3}' /proc/loadavg) memory=$(free -h | awk '/^Mem:/ {print $3}') disk=$(df -h / | awk 'END {print $3}') read cpu user nice system idle iowait irq softirq steal guest < /proc/stat sleep 0.1 read cpu2 user2 nice2 system2 idle2 iowait2 irq2 softirq2 steal2 guest2 < /proc/stat total=$((user2 + nice2 + system2 + idle2 + iowait2 + irq2 + softirq2 + steal2)) total_diff=$((total - (user + nice + system + idle + iowait + irq + softirq + steal))) idle_diff=$((idle2 - idle)) cpu_usage=$(awk "BEGIN { printf \"%.1f\", 100 - ($idle_diff * 100 / $total_diff) }") temperature=$(sensors 2>/dev/null | awk '/Tctl:/ {gsub(/[+°C]/,"",$2); print $2"°C"}') [ -z "$temperature" ] && temperature="N/A" ### Printing printf "\n" printf "Welcome to %s 📟\n\n" "$hostname" printf "CPU : %s%% - %s\n" "$cpu_usage" "$temperature" printf "RAM : %s\n" "$memory" printf "Disk : %s\n" "$disk" printf "Uptime : %s\n" "$uptime" printf "Load : %s\n\n" "$load"OpenRC status exporter
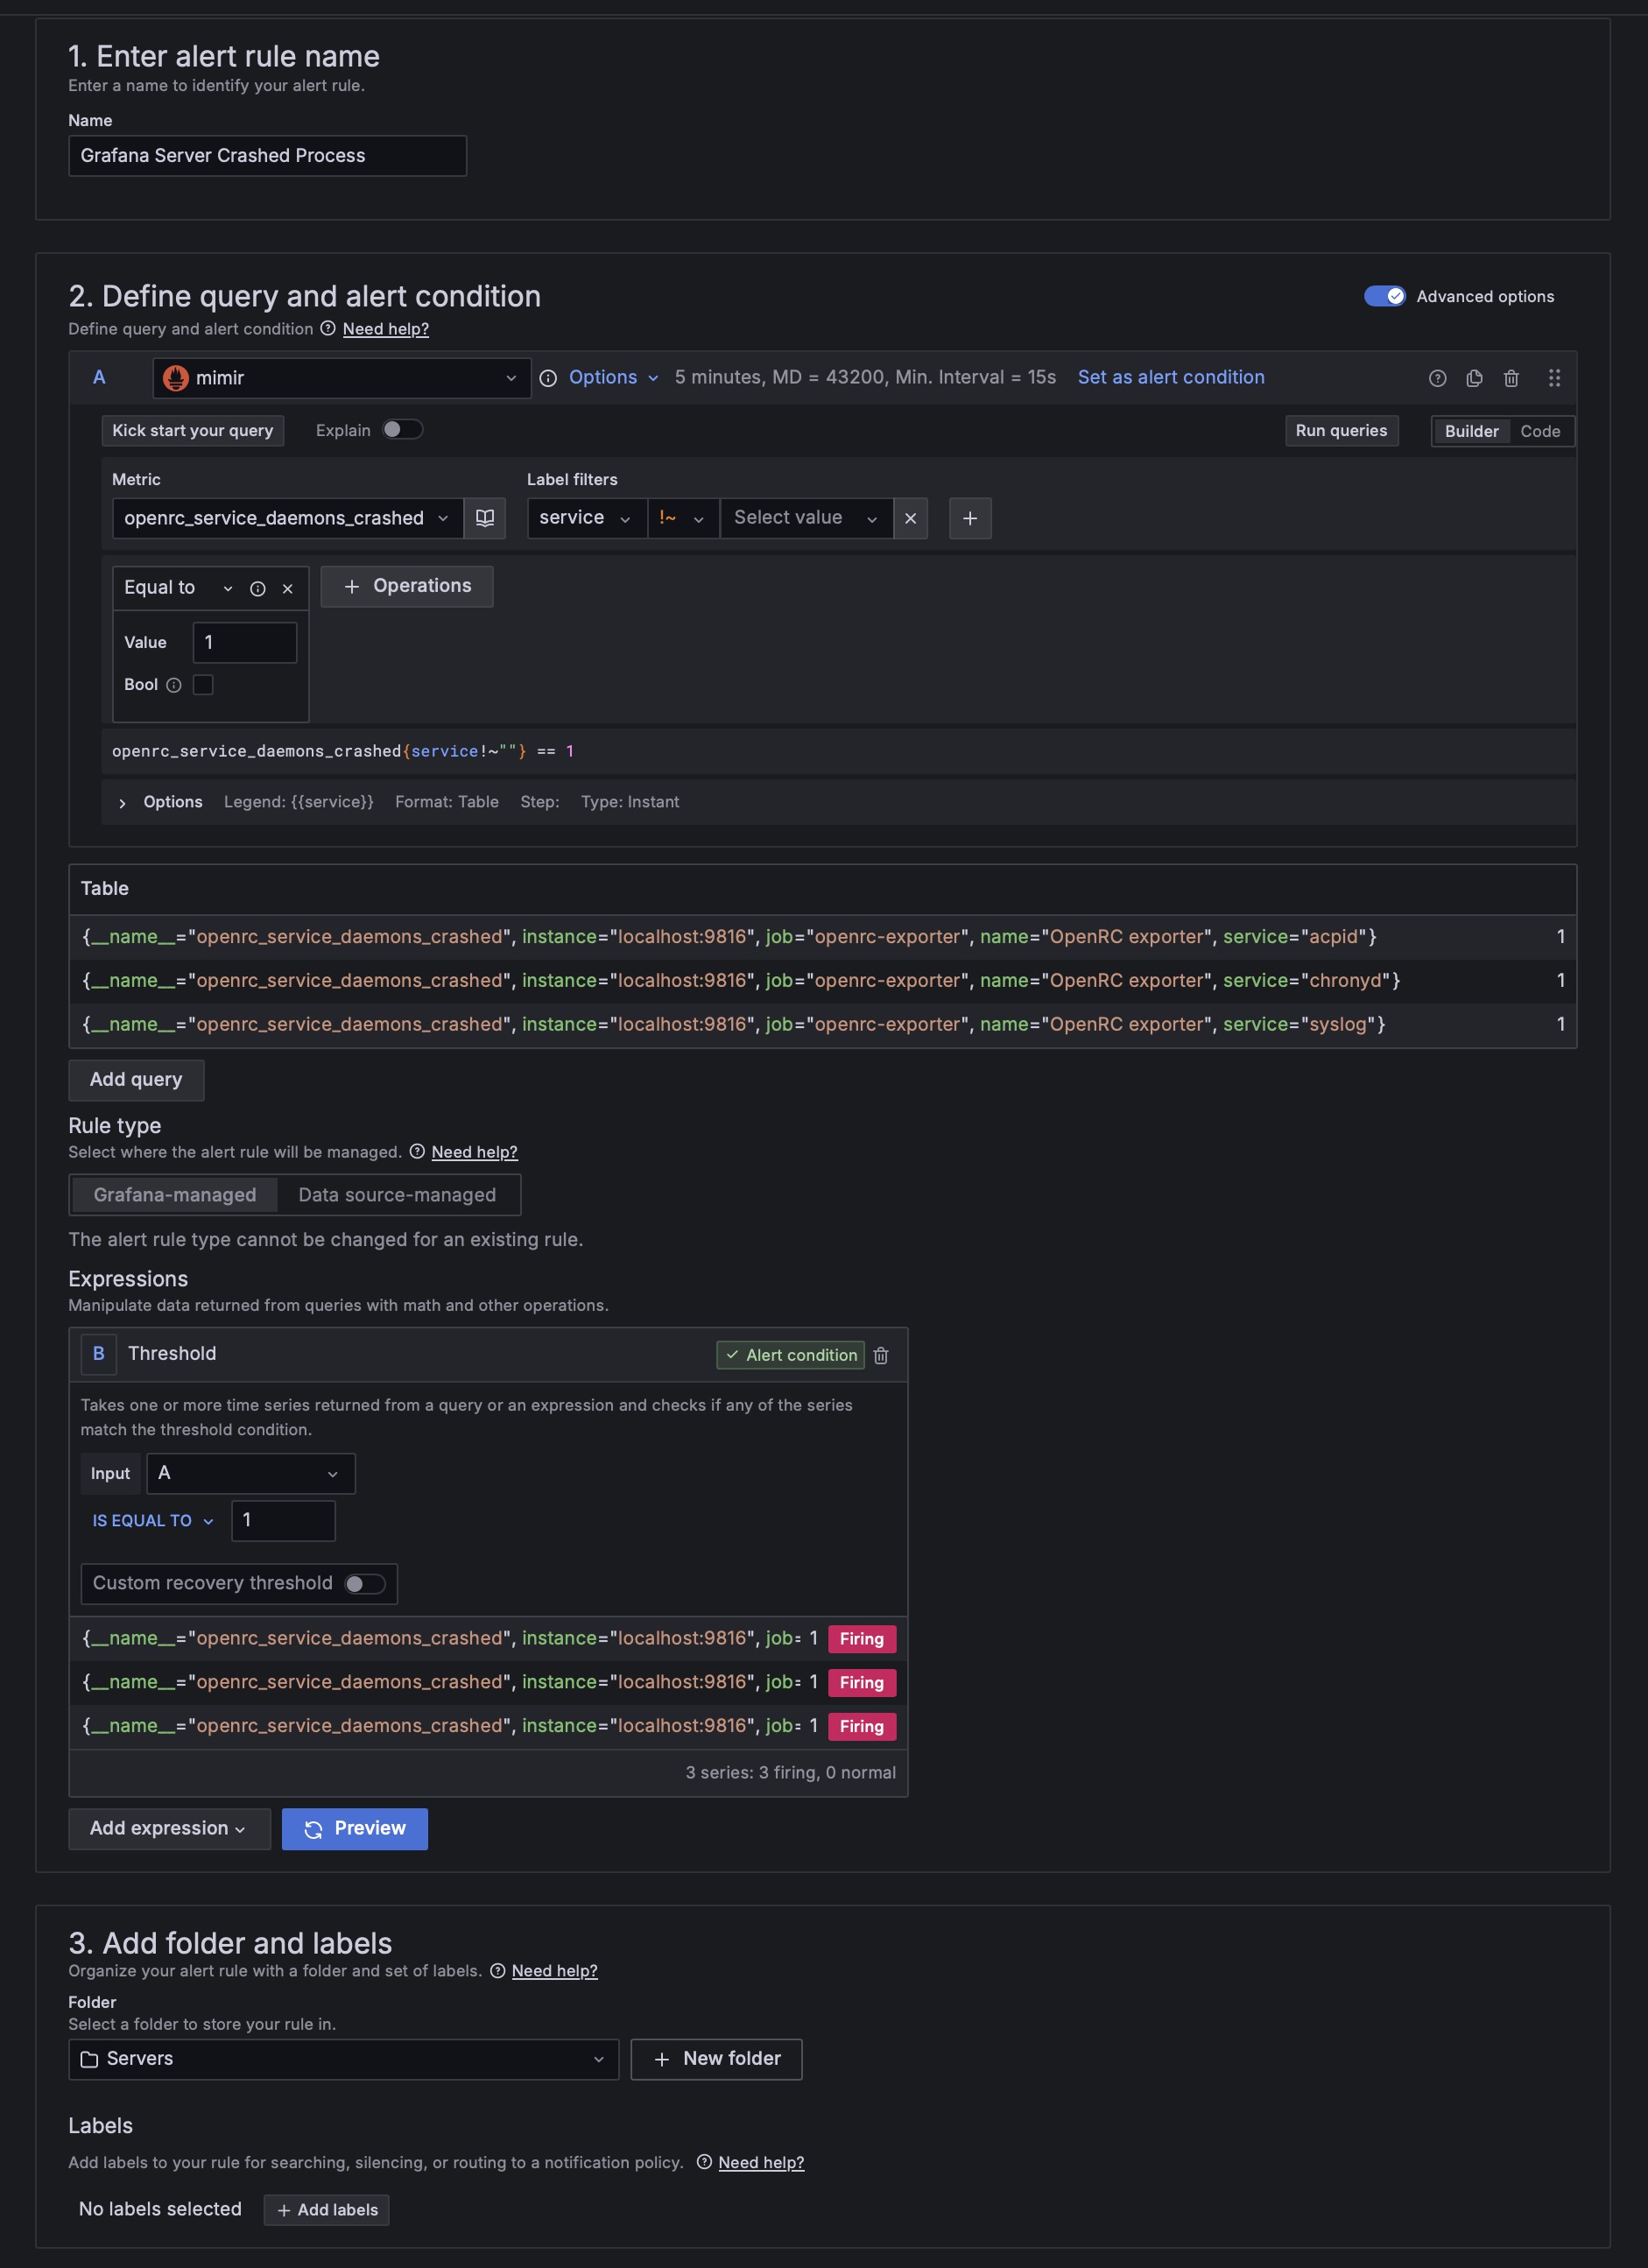
Thanks to the prometheus-openrc-exporter, I was able to monitor every detail of the most important system processes — and even receive push notifications if a process crashes.
Example:

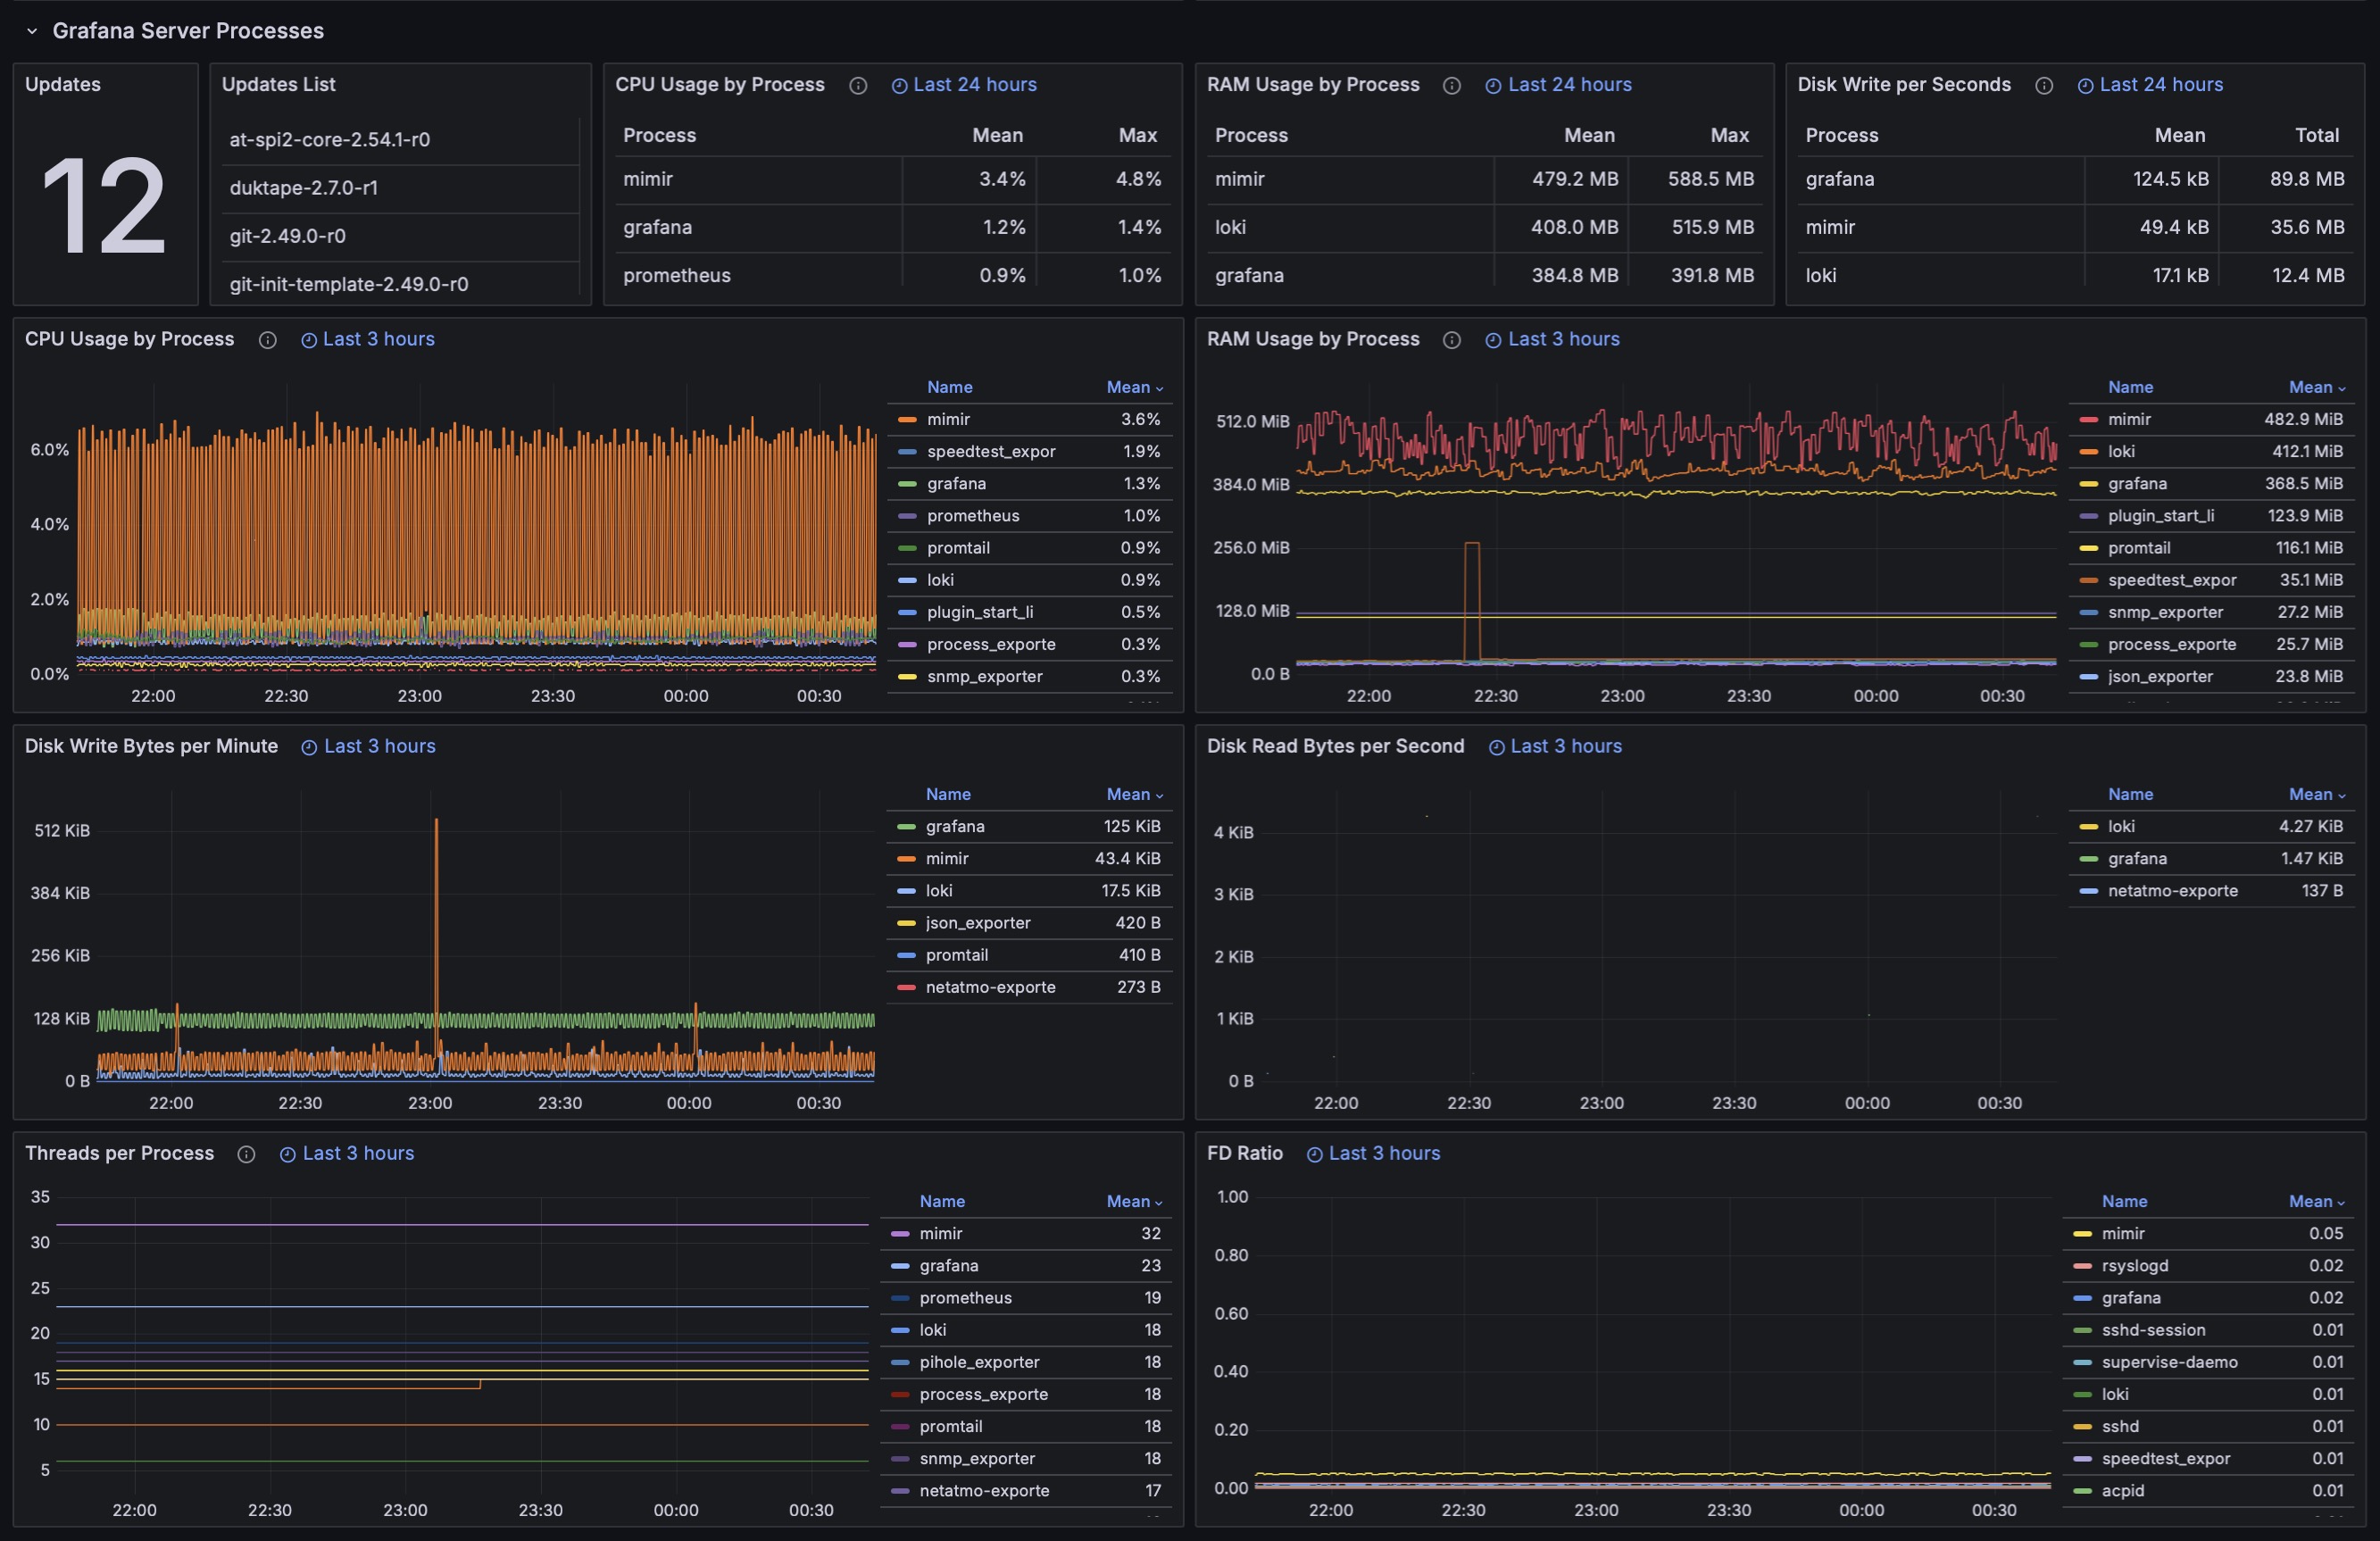
Process exporter
I discovered an excellent Prometheus exporter to monitor the resources used by each active service: ncabatoff/process-exporter: Prometheus exporter that mines /proc to report on selected processes.
So I built some Grafana panels with the most significant metrics:
Update check script
I also created a little, but quite useful, script that sends me the updates of the apps from the Grafana server (and also of the other servers but this is another post…):
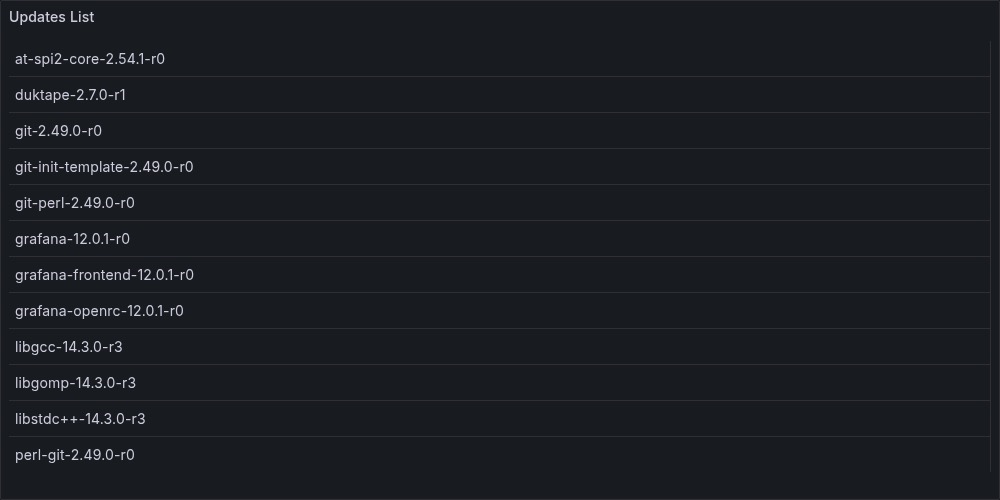
The Grafana panel with a list of available updates
And a push notification with the list:
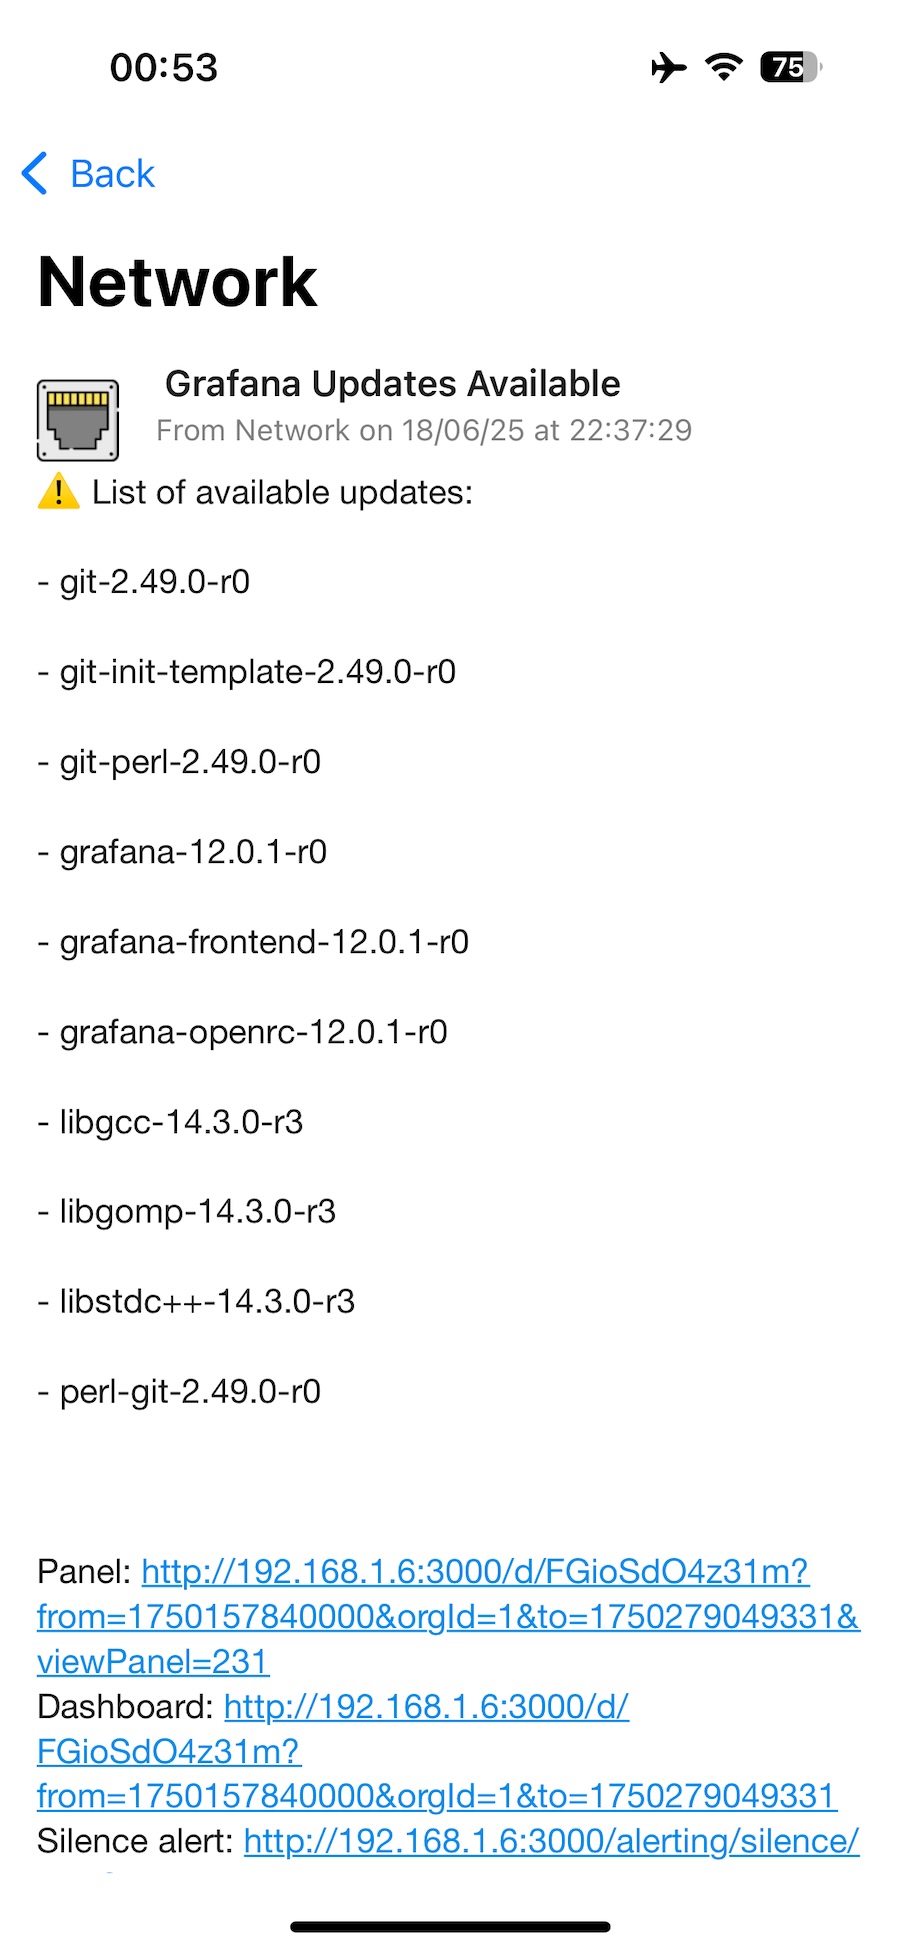
The script that handles it:
#!/bin/sh export PATH="/usr/sbin:/usr/bin:/sbin:/bin" OUTFILE="/var/lib/node_exporter/textfile_collector/apk_updates.prom" apk update > /dev/null 2>&1 PACKAGES=$(apk version -l '<' | awk '/</ {print $1}') COUNT=$(echo "$PACKAGES" | grep -c '^') cat <<EOF > "$OUTFILE" # HELP apk_updates_pending Number of apk packages with updates available # TYPE apk_updates_pending gauge apk_updates_pending $COUNT EOF for pkg in $PACKAGES; do echo "apk_update_available{package=\"$pkg\"} 1" >> "$OUTFILE" doneThe output for Prometheus metrics:
grafana:~# cat /var/lib/node_exporter/textfile_collector/apk_updates.prom # HELP apk_updates_pending Number of apk packages with updates available # TYPE apk_updates_pending gauge apk_updates_pending 10 apk_update_available{package="git-2.49.0-r0"} 1 apk_update_available{package="git-init-template-2.49.0-r0"} 1 apk_update_available{package="git-perl-2.49.0-r0"} 1 apk_update_available{package="grafana-12.0.1-r0"} 1 apk_update_available{package="grafana-frontend-12.0.1-r0"} 1 apk_update_available{package="grafana-openrc-12.0.1-r0"} 1 apk_update_available{package="libgcc-14.3.0-r3"} 1 apk_update_available{package="libgomp-14.3.0-r3"} 1 apk_update_available{package="libstdc++-14.3.0-r3"} 1 apk_update_available{package="perl-git-2.49.0-r0"} 1 grafana:~#Delete unnecessary kernel modules
To avoid wasting energy, I disabled all unnecessary kernel modules:
echo -e "blacklist iwlwifi\nblacklist iwlmvm\nblacklist mac80211\nblacklist cfg80211\nblacklist libarc4" > /etc/modprobe.d/blacklist-wifi.conf echo -e "blacklist btusb\nblacklist btbcm\nblacklist btintel\nblacklist btmtk\nblacklist btrtl\nblacklist bluetooth\nblacklist ecdh_generic\nblacklist ecc\nblacklist rfkill" > /etc/modprobe.d/blacklist-bluetooth.conf echo -e "blacklist psmouse\nblacklist serio_raw" > /etc/modprobe.d/blacklist-psmouse.conf echo -e "blacklist snd_hda_codec_realtek\nblacklist snd_hda_codec_generic\nblacklist snd_hda_intel\nblacklist snd_hda_codec\nblacklist snd_hda_core\nblacklist snd_hwdep\nblacklist snd_sof_amd_rembrandt\nblacklist snd_sof_amd_acp\nblacklist snd_sof_pci\nblacklist snd_sof_xtensa_dsp\nblacklist snd_sof\nblacklist snd_soc_dmic\nblacklist snd_acp6x_pdm_dma\nblacklist snd_sof_utils\nblacklist snd_intel_dspcfg\nblacklist snd_intel_sdw_acpi\nblacklist snd_pci_ps\nblacklist snd_compress\nblacklist snd_rpl_pci_acp6x\nblacklist snd_pcm_dmaengine\nblacklist snd_acp_pci\nblacklist snd_acp_legacy_common\nblacklist snd_pci_acp6x\nblacklist snd_pcm\nblacklist snd_timer\nblacklist snd\nblacklist soundcore\nblacklist snd_pci_acp5x\nblacklist snd_rn_pci_acp3x\nblacklist snd_acp_config\nblacklist snd_soc_acpi" > /etc/modprobe.d/blacklist-audio.confSorted and cleaned the Prometheus scraping points
I organized the Prometheus configuration file to have a better overview of all the scraping points:
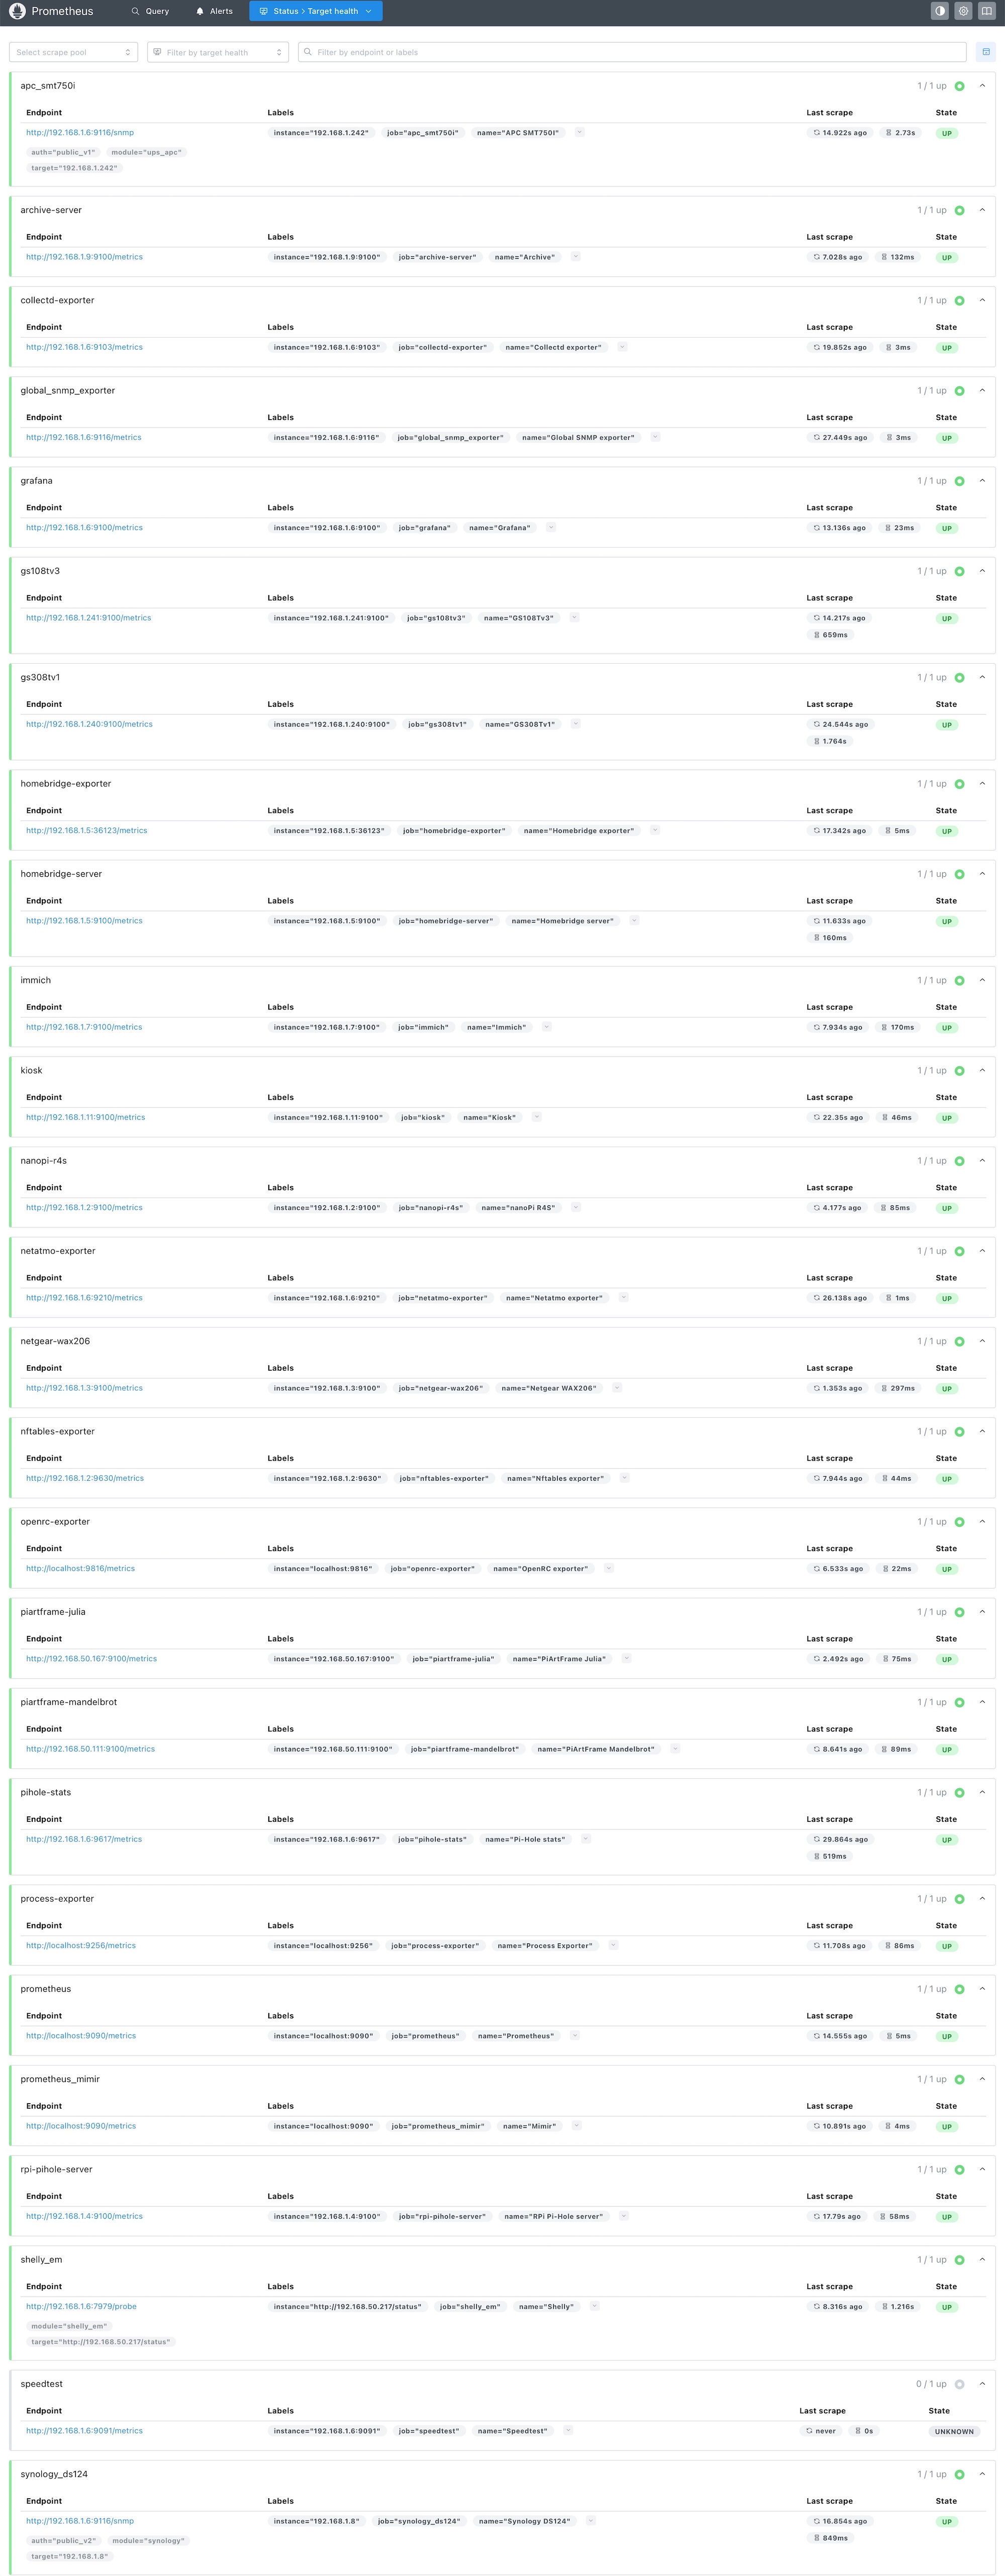
Conclusions
After 1–2 months on this new setup, I’m really impressed by the performance of this mini PC. It’s probably (surely) more powerful than needed, but it’s a future-proof device (and it’s also great to see Grafana panels render in just a few seconds!)
The only downside is the power consumption, which is about double that of a Raspberry Pi 5, but the speed is also 3/4x greater.
PS: soon I’ll publish a new post with all the updates for the “Home setup v6”


