.png)


content, reviewed by leading industry experts and seasoned editors. Ad Disclosure
On-chain data shows the Bitcoin Market Value to Realized Value (MVRV) Ratio is currently still below historical market peaks.
Bitcoin MVRV Ratio May Not Be That Overheated Yet
In a new post on X, the institutional DeFi solutions provider Sentora (previously IntoTheBlock) has discussed about the latest trend in the MVRV Ratio of Bitcoin. The “MVRV Ratio” refers to a popular on-chain indicator that compares the BTC Market cap and Realized cap.
The Realized Cap is an on-chain capitalization model for the asset that calculates its total valuation by assuming the value of each individual token in circulation is equal to the price at which it was last moved on the network. This is different from the usual Market Cap, which just takes the current spot price as the value for all coins.
The previous transaction of any token is likely to represent the last time that it changed hands, so the price at its time could be considered as its current cost basis. Thus, the Realized Cap is essentially the sum of the acquisition values of all coins.
One way to interpret the model is as a measure of the amount of capital that investors as a whole initially put into the cryptocurrency. In contrast, the Market Cap represents the value that they are holding right now.
As the MVRV Ratio takes the ratio of the two models, its value basically tells us whether the investors are holding more than they put in. In other words, the indicator contains information about the profit-loss balance of the entire network.
Now, here is the chart shared by Sentora that shows a long-term view of the Bitcoin MVRV Ratio:
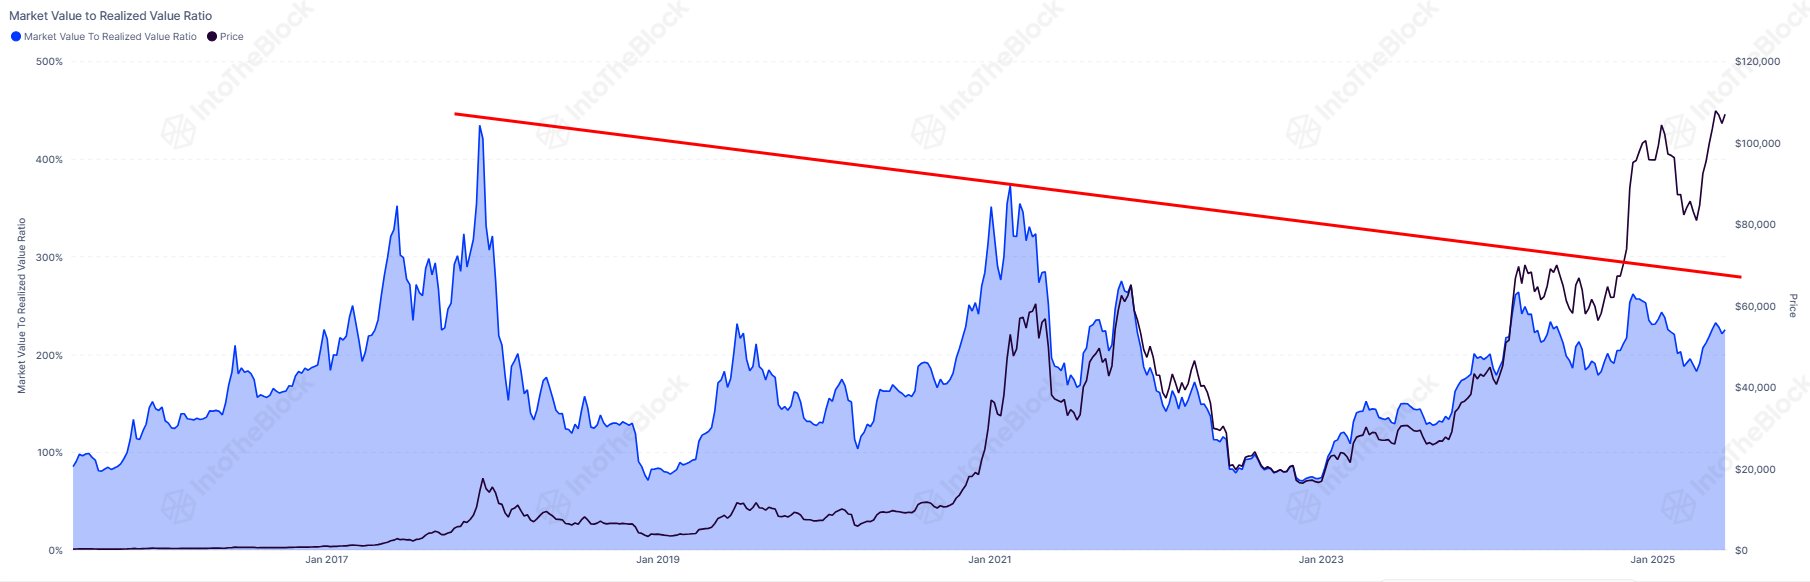
As is visible in the above graph, an extreme peak in the Bitcoin MVRV Ratio has historically coincided with tops in the asset’s price. The explanation behind the pattern lies in the fact that investors become more tempted to take their gains the larger that they grow.
At a high value of the MVRV Ratio, the Market Cap significantly exceeds the Realized Cap, so the average investor can be assumed to be holding onto a notable profit. This often leads to holders participating in mass selloffs to realize their gains, but the bull run keeps going as long as enough demand continues to flow in to absorb the selling pressure.
From the chart, it’s apparent that this balance seems to have been reaching a turning point earlier with each cycle, showcasing that as Bitcoin matures as an asset, its returns are becoming smaller. At present, the MVRV Ratio is sitting at a value of 2.25, which suggests the Market Cap is more than double the Realized Cap. However, even after taking into account for shrinking gains, this value is notably lower than previous cyclical tops.
“This indicates the market still isn’t as overheated as it was during earlier peaks,” notes the analytics firm. It now remains to be seen how the rest of the cycle will play out, and whether BTC will make use of this potential room or not.
BTC Price
Bitcoin has erased its recent recovery as its price has come back down to the $104,200 mark.
Featured image from Dall-E, IntoTheBlock.com, chart from TradingView.com
Editorial Process for bitcoinist is centered on delivering thoroughly researched, accurate, and unbiased content. We uphold strict sourcing standards, and each page undergoes diligent review by our team of top technology experts and seasoned editors. This process ensures the integrity, relevance, and value of our content for our readers.