.png)

My favourite book as a teenager was Swimming with Sharks by Joris Luyendijk - his deep dive into who was really to blame for the financial crisis, and my first encounter with the word quants. Since then, I’ve been fascinated by finance - curious about what really happens behind those Bloomberg terminals of the future finance bros in the LSE library. I got close a few times: as an intern at Rabobank, a PhD trainee at the European Central Bank, and now for the third time living within cycling distance of the City of London.
So, fascination established. Understanding? Not quite. Which is why I decided to dig deeper. What do quant traders actually do all day - and could I, with my VS Code, a few Python scripts, and open data, even begin to replicate that world? Or are these people really worth the money they make? Let’s find out.
(Disclaimer: none of this is investment advice. I’m probably the last person you should ask. About 77 percent of retail day traders lose money - and I’m not betting I’d be in the lucky 23.)
A quant’s day isn’t a string of “buy!” moments - it’s cleaning data, testing ideas, debugging code, and debating whether a weird number is alpha or just an error. They start before markets open, updating models and checking overnight risk; the rest of the day is spent running backtests, tweaking features, and hunting for small, repeatable edges that quietly add up.
Quant traders sit where math meets markets. Their job is to find patterns in chaos - inefficiencies in how prices move, how information spreads, or how investors react. Some chase microsecond price gaps; others design slower, factor-based strategies for pensions or central banks.
Before diving in, let me share a few key ideas that helped me decode this world. Beta is what you get by simply riding the market - how high the wave is you are riding. Alpha is what’s left when you strip that away - the extra edge of return that everyone is fighting for. Quants obsess over Sharpe ratios (return per unit of risk), drawdowns (how far a portfolio falls before recovering), and overfitting - when a model looks great on paper but collapses in real life. Some chase momentum (buying what’s been going up), others trade mean reversion (betting prices snap back to normal), and the boldest feed thousands of signals into machine learning models to squeeze out extra basis points of alpha.
These are the ideas I kept in mind as I built my own 3 models - starting from a simple rule any student could code to something resembling a laptop version of what a hedge fund might actually run.
The first model I built is a finance classic: buy what’s been going up, sell what’s been going down. Economists call it the momentum anomaly (Jegadeesh & Titman, 1993). The logic is simple and still underpins a lot of the professional trading industry - investors chase winners and dump losers.
I ran it on 30 big names - Apple, Microsoft, Coca-Cola, the usual suspects - from 2015 onward. Each day, it checked the past year’s returns (skipping the most recent month, when markets tend to cool off). If momentum was positive, it bought; if negative, it shorted - equal weight, no emotions, just math.
The second model I test is pairs trading. The idea dates back to the 1980s, when Morgan Stanley’s newly minted “StatArb” (statistical arbitrage) desk realised that some stocks moved so closely together that their prices behaved like elastic bands - stretch too far, and they’d snap back. It looks for two stocks that usually move in sync (say, Visa and Mastercard, or Coke and Pepsi), waits until one drifts too far from the other, and bets on the gap closing.
The code tests every possible pair for statistical co-movement, picks the best one, and constantly recalibrates their relationship with a rolling regression. When the price gap gets unusually wide, the model shorts the rich stock and buys the cheap one - betting on mean reversion.
By the third model, I wanted something that looked and felt closer to what real hedge funds run though still lightweight enough for my laptop. So, I built a machine learning model (a Ridge regression, to keep it fast and stable) that tries to predict tomorrow’s stock returns using patterns from recent momentum and volatility.
Here’s what’s under the hood:
Smarter features: Instead of just looking at past returns, the model now builds multiple “momentum fingerprints” - 5-day, 21-day, and 63-day returns - plus measures of trend (moving averages) and risk-adjusted momentum (Sharpe-like metrics). In simple terms, it asks: which stocks have been winning, how steadily, and compared to how risky they were?
Market context: Each stock’s signals are adjusted relative to the market (SPY), to separate stock-specific alpha from general market moves.
Ranking across stocks: Each day, it ranks all stocks in the universe (about 45) by their predictive signals - long the top 25%, ignore or lightly short the bottom few.
Mega-cap weighting: I added a realistic hedge-fund twist - boosting positions in the biggest, most liquid names like Apple and Microsoft. These mega-caps dominate the S&P 500, so overweighting them gives performance closer to how institutional money actually behaves.
Regular refits: Every six weeks, the model retrains itself on new data - a walk-forward approach that keeps it adaptive but fast enough to run on a CPU.
Finally, the model’s portfolio runs fully long, like a traditional equity fund.
Going a bit more in-depth, here are my (naive) assumptions across all models:
The market assumptions: I’m assuming momentum keeps working, tech dominance continues, and markets aren’t fully efficient - meaning machine learning can still find small, exploitable patterns. I model transaction costs as minimal (1e-4 per trade, or about one basis point).
The data assumptions: I assume perfect data - no survivorship bias (every failed company still exists in my dataset), no look-ahead bias (no cheating with future information), and perfectly adjusted prices.
Model assumptions: Linear relationships hold, features stay relevant, and the statistical properties of returns don’t shift over time (stationarity).
The execution assumptions: Flawless execution - trades fill instantly at the closing price, positions can scale infinitely without moving the market, and mega-caps stay mega.
The risk assumptions: No black swans, no regime shifts, and no tech crash taking down my overexposed portfolio.
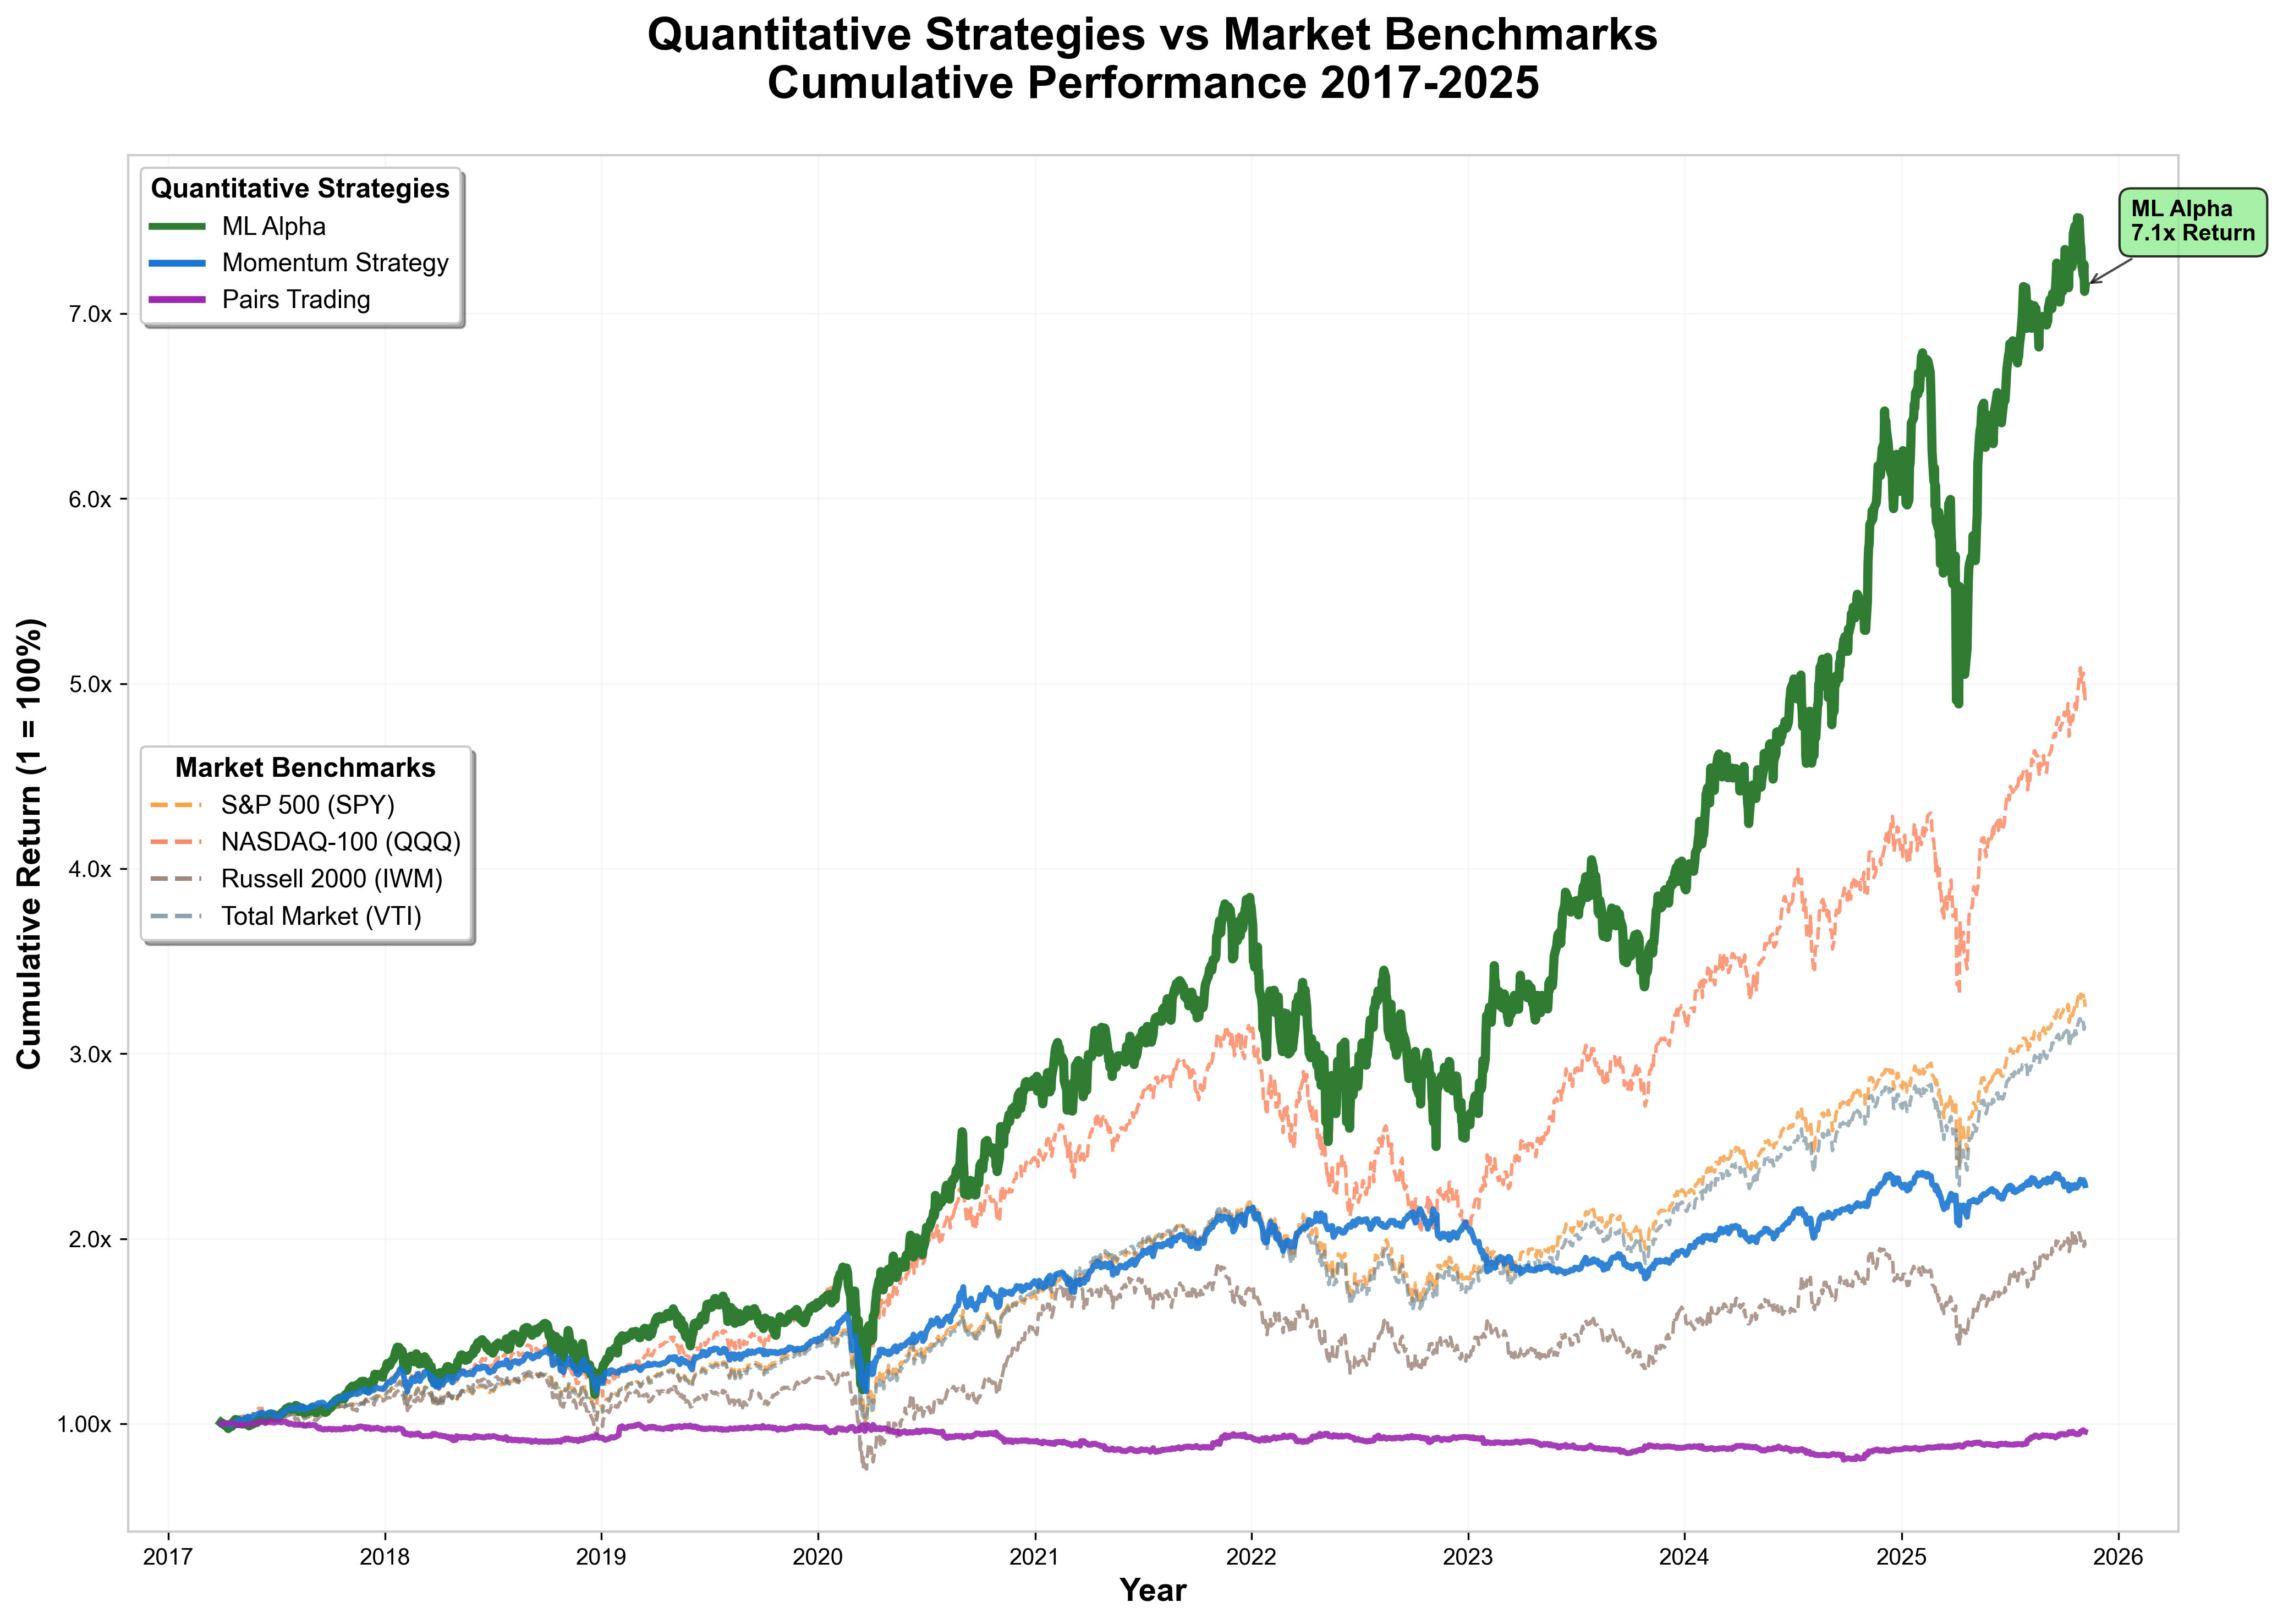
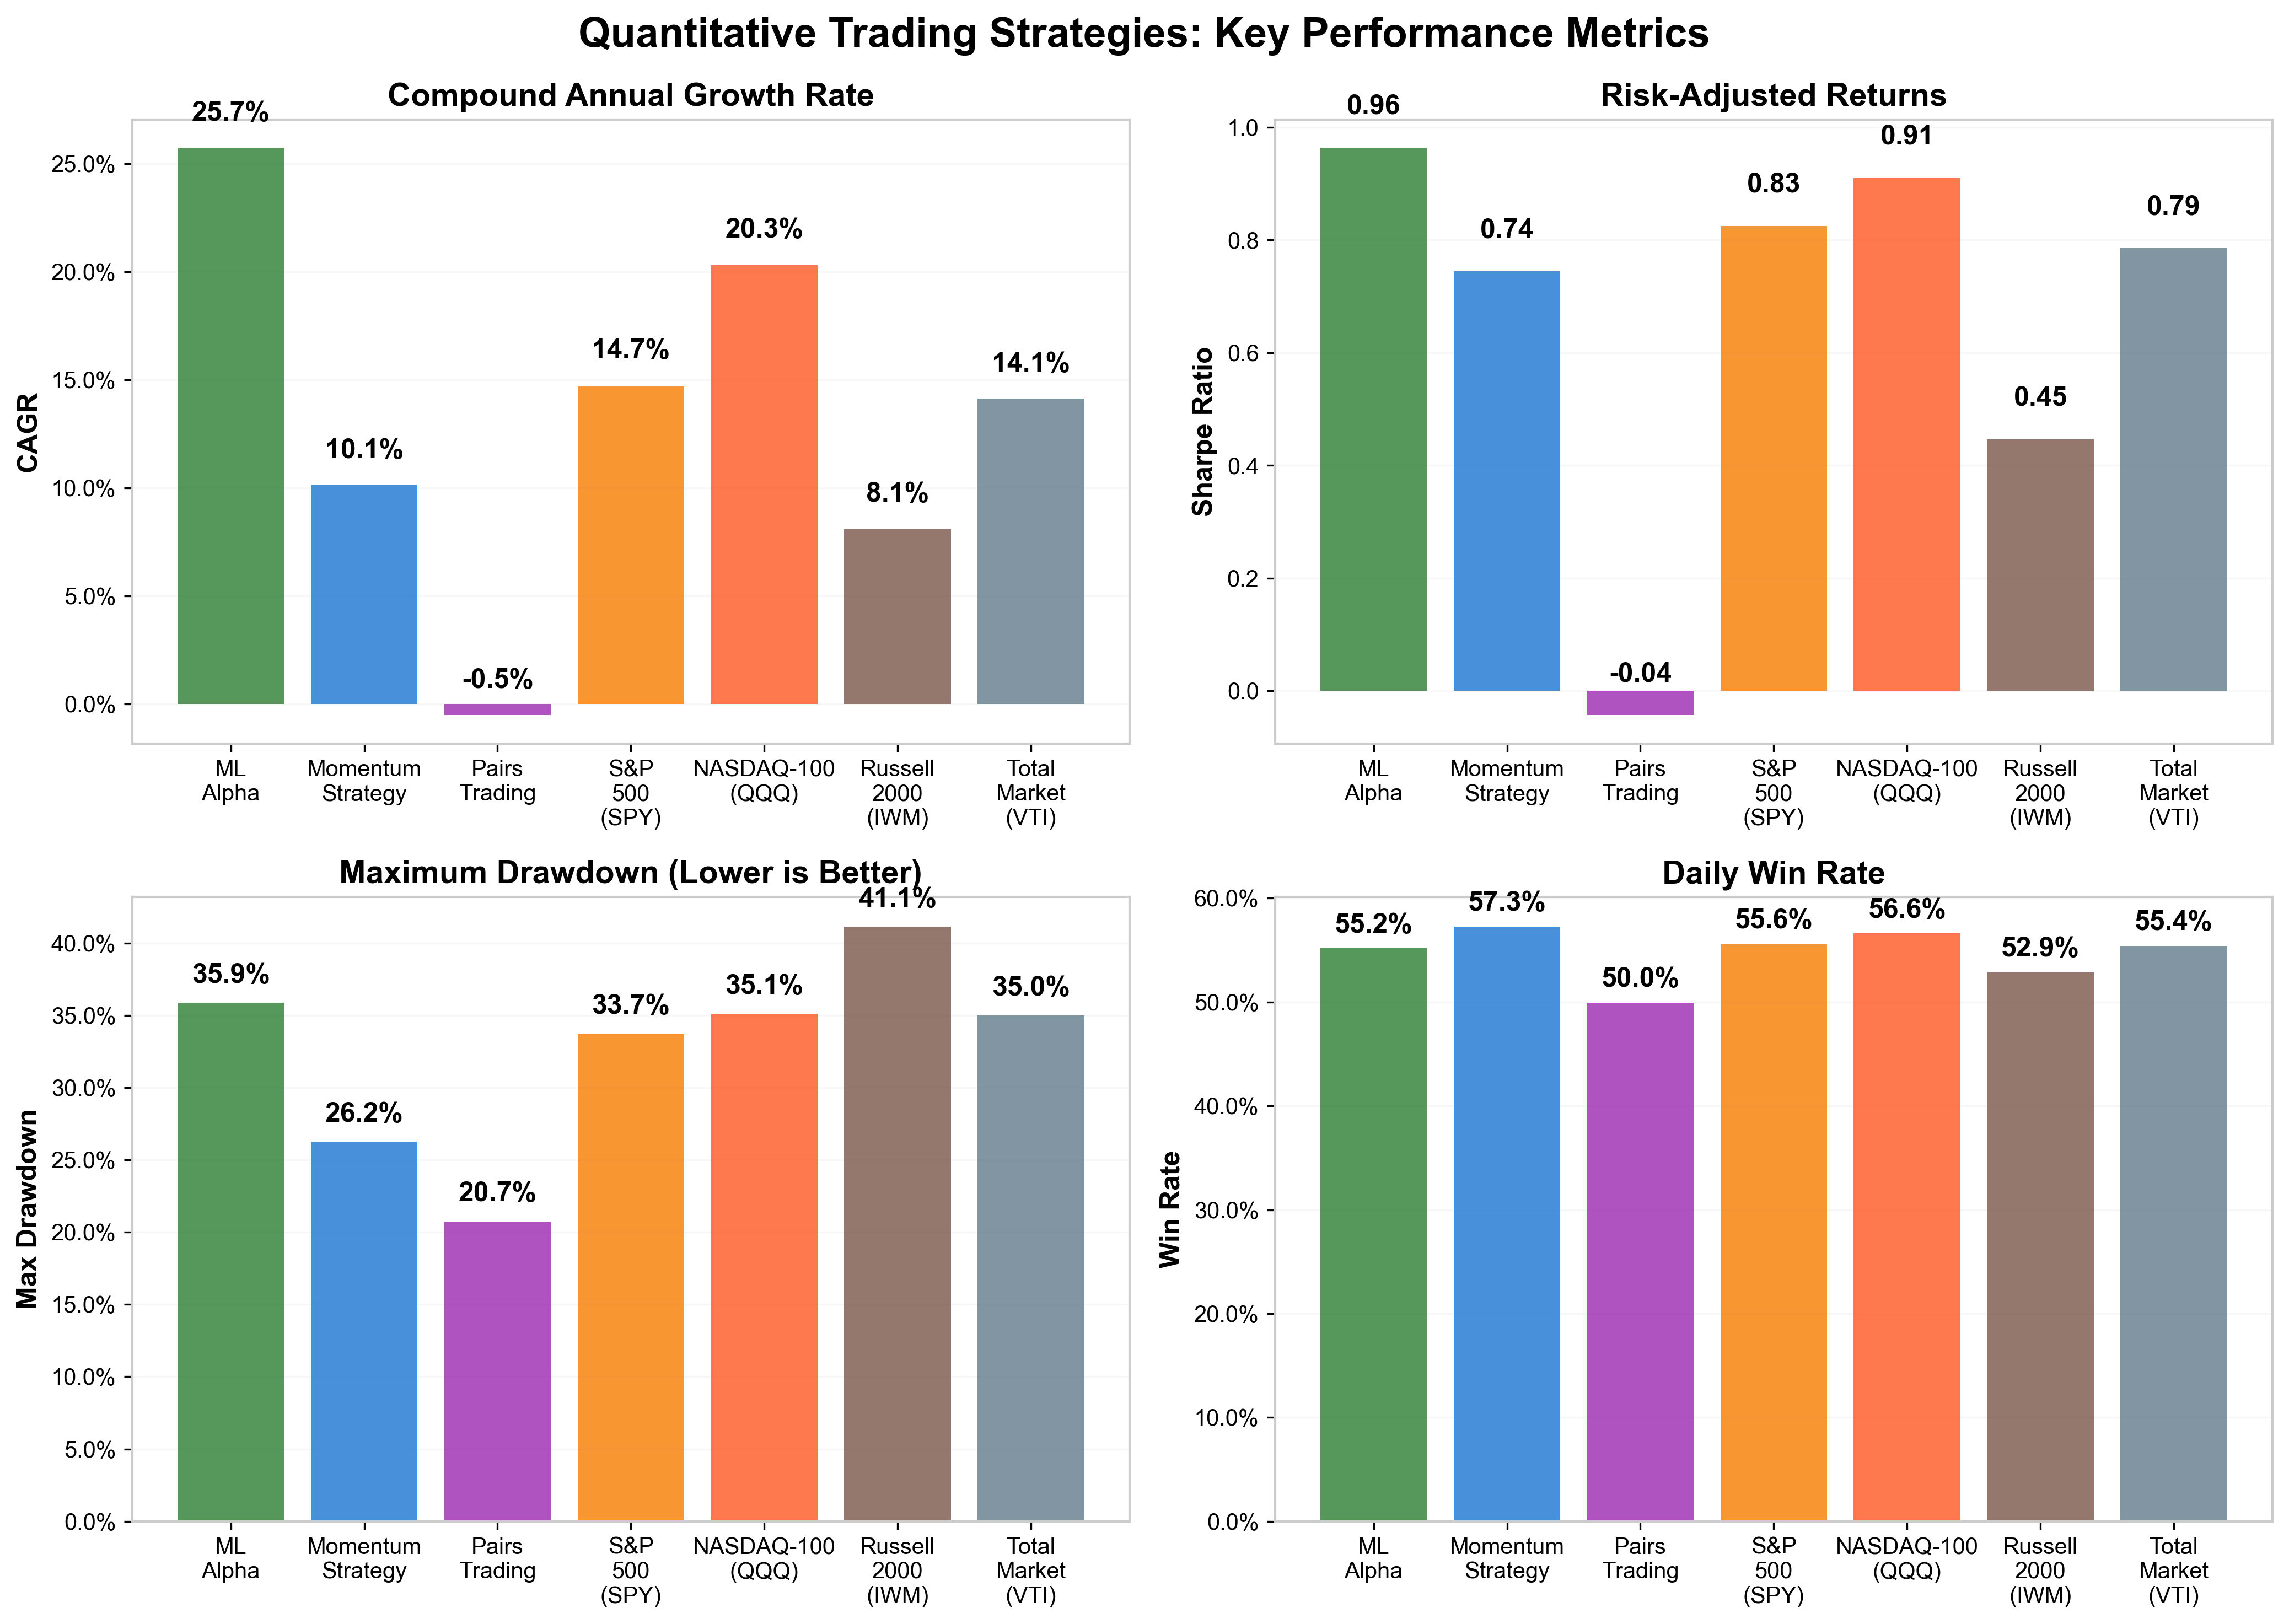
The first chart shows the cumulative returns of my three models against the market. The simple Momentum Strategy (blue) tracks close to the major indices, proving that “buy what’s been going up” works to a certain extend. The Pairs Trading model (purple) barely moves - a flat line (its brief heyday in the 2000s has long faded under high-frequency competition). Then there’s the Machine Learning Alpha strategy (green), shooting up over 7× since 2017, beating every benchmark (even the Nasdaq).
The second chart plots risk versus return. Here, ML Alpha sits firmly in the top-right corner - high returns, high risk, and the largest Sharpe ratio bubble, meaning it delivered the best return per unit of volatility. Momentum sits closer to the middle -solid but conventional - while Pairs Trading is in the low-return, low-risk corner.
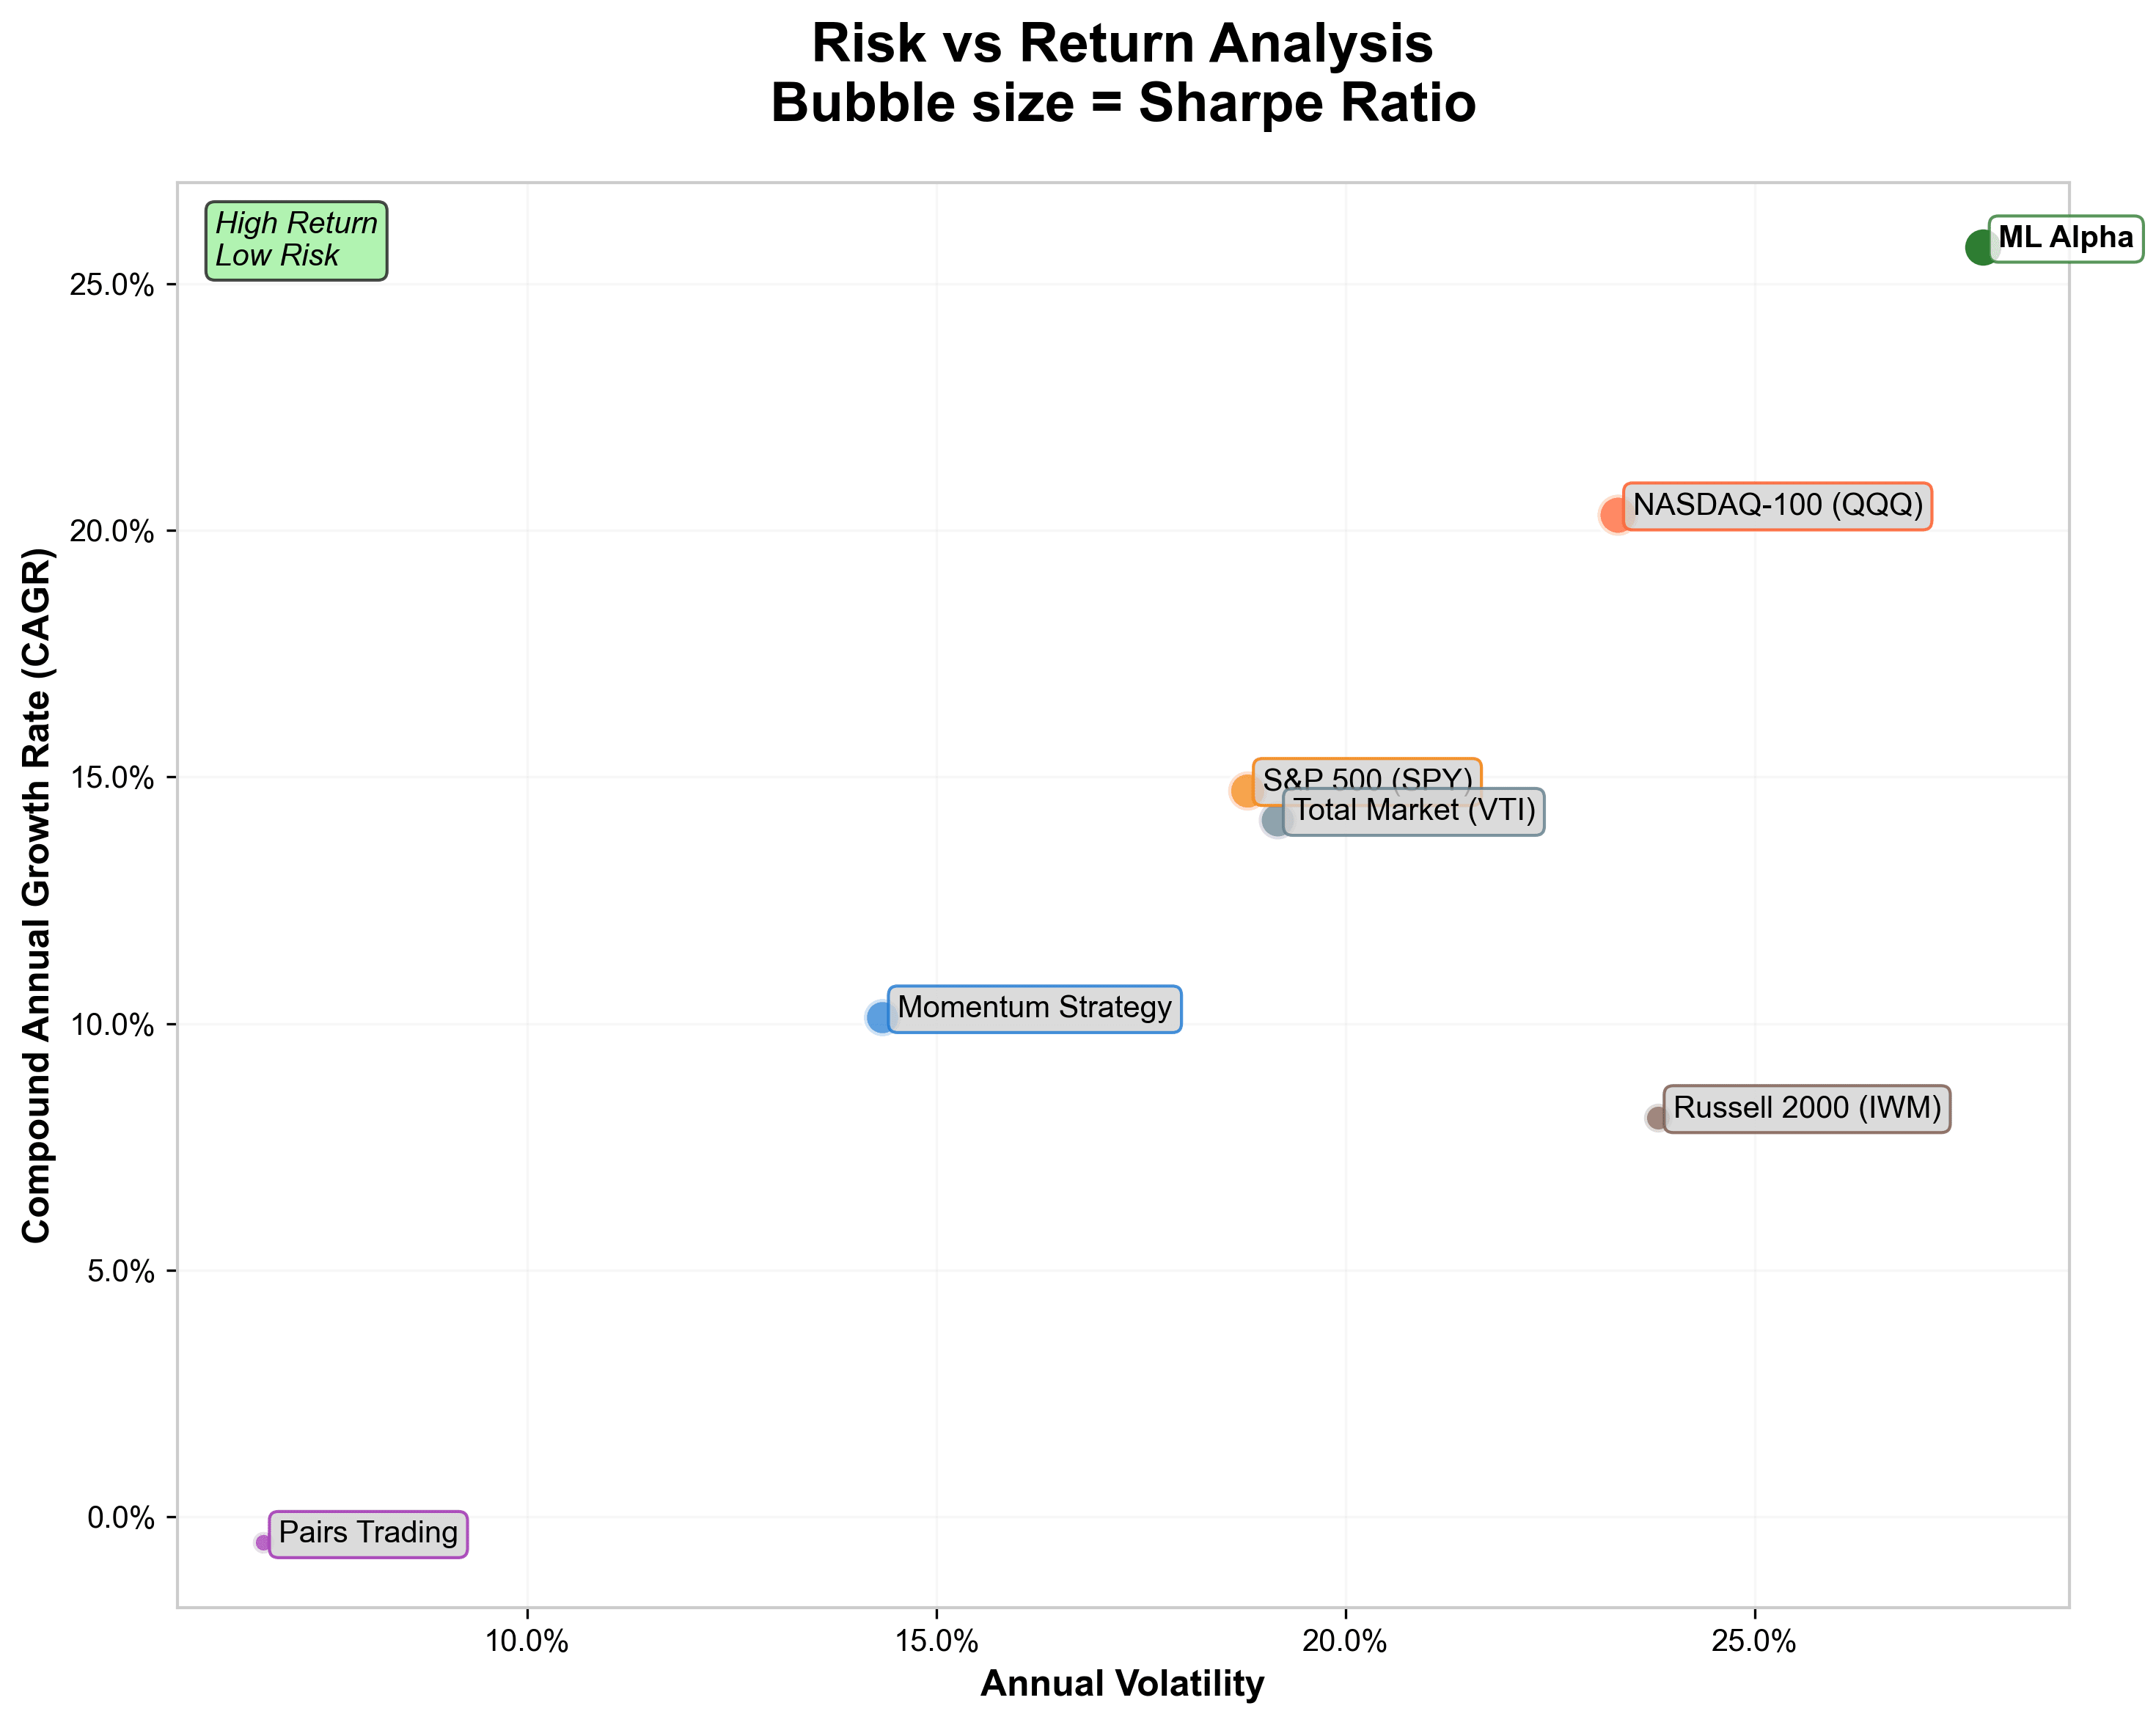
Finally, the performance breakdown: ML Alpha posted a 25.7% annual return with a Sharpe (returns per unit of risk) of 0.96, outpacing every index; Momentum followed with a 10% CAGR (smoothed annual return), while Pairs Trading slipped into mild losses. The trade-off is visible too: ML Alpha had the biggest drawdowns (how much you’d lose before the portfolio recovers).
A fair critique: Of course, comparing these strategies side by side has a big caveat: they don’t all carry the same beta - meaning, they don’t all move with the market to the same degree. A strategy that swings wildly with every market move (high beta) will naturally show higher returns in a bull market, while one that’s market-neutral (low beta) will look dull by comparison, even if it’s producing steadier, risk-adjusted gains.
In practice, quants and academics adjust for this using factor models like Fama-French. Instead of assuming there’s just one market beta, these models break returns into several systematic risk factors: size (small vs. big companies), value (cheap vs. expensive stocks), and later, profitability, investment, and momentum. What looks like “alpha” in a simple market model might just be exposure to one of these well-known factors.
I did my best - but there are reasons the pros still win (without potentially overfitting the model… perhaps I’m slightly guilty). Their edge isn’t luck or clairvoyance; it’s data, infrastructure, and discipline.
Market microstructure data: Millisecond-level order books, bid–ask flows, quote imbalances, and dark-pool prints. This data captures the real mechanics of price formation - where every trade, cancel, and hidden order leaves a trace.
Alternative data: Credit-card transactions, satellite imagery, shipping manifests, web-scraped news, and ESG disclosures - all cleaned and linked to tickers through entity-resolution pipelines. Btw, I’d love to try this myself: track AI mentions in earnings calls or scrape every investment podcast transcript… I’m sure I can make some returns here.
Feature depth: Thousands of engineered variables - liquidity metrics, momentum decays, volatility surfaces, crowding indices - that collectively drown out the noise of public daily prices. Retail data simply lacks the signal-to-noise ratio for durable alpha.
And now, an entirely new layer is emerging. Hedge funds are experimenting with large language models - not to predict prices outright (yet), but to read the market’s language. Using transformer architectures fine-tuned on transcripts, headlines, and even tweets, these systems convert text into high-dimensional embeddings that quantify tone, uncertainty, and sentiment drift in real time. Some funds now map these embeddings to factor returns or volatility spikes; others use them to detect stress in central bank communication (a bit close to home for me - there’s always space to plug my PhD project centralbanktalk.eu, right?).
Instead of one grand model, they run hundreds of small, specialized ones.
Each targets a distinct horizon:
Milliseconds: market-making and order-flow prediction
Hours: short-term flow and liquidity shocks
Weeks: trend and relative momentum
Months: valuation, factor rotation, or regime-switch models
Some firms operate with a higher-level “meta-strategy” which allocates capital dynamically across these sub-models, smoothing performance across time and market conditions.
The same alpha, executed 10 milliseconds faster, can be worth millions. While I play around in my spreadsheet they have to really execute.
Execution algorithms (to hide their footprint and reduce market impact - since dumping the order in the market would move the price against them) like time weighted average price, volume weighted average price, and percent of volume slice orders to minimize market impact.
Real-time risk engines throttle exposure when volatility spikes, i.e., traders dial down how much risk a trading system is taking when volatility suddenly comes in - so a bad day doesn’t become a catastrophic one.
Compute: GPU/FPGA clusters that backtest (simulating how a trading strategy would have performed historically) decades of tick-level data in hours rather than days. For the non experts like me: FPGA is a field-programmable gate array which is hardware you can literally rewire for your exact trading logic making it extremely fast.
Quants can run large long-short books, borrow stock at scale, and use synthetic exposures through prime brokers - options that retail investors (or me and my python file) simply don’t have.
Retail faces strict margin requirements, limited shorting (especially hard-to-borrow names), and almost no access to synthetic shorts like swaps or portfolio margin. Rules like Reg SHO and conservative broker risk models cap leverage before it becomes useful.
Quants, by contrast, use:
portfolio margin based on net risk,
institutional borrow facilities, and
futures and swaps to hedge cheaply and precisely.
This lets them build market-neutral, factor-neutral strategies, while retail is mostly stuck long-only, absorbing factor cycles and drawdowns that pros systematically hedge away.
Quants don’t chase the biggest returns - they chase the most reliable ones. Every strategy is volatility-targeted: positions are scaled so that portfolio risk stays roughly constant (say, 10% annualized).
Capital flows to models that are:
Efficient - high Sharpe ratios (strong returns per unit of risk),
Independent - low correlation with others,
Resilient - small, stable drawdowns.
To keep returns smooth, they use dynamic leverage and hedging. When volatility is low and signals are strong, they scale up; when risk spikes, they cut exposure or hedge with futures and options.
Quants live by process:
Continuous out-of-sample validation, cross-market replication, and paper trading before deploying real capital.
Bayesian model updating: when a signal decays, weight it down automatically.
Feature orthogonalization: constantly searching for uncorrelated alphas rather than doubling down on crowded ones so that if one signal underperforms the other keeps the overall strategy stable.
Quants today are the bridge between the old world of handshakes and the new world of computation - proof that in finance, intelligence has quietly migrated from the trading pit to the server rack. Firms like Citadel, Two Sigma, and AQR aren’t just trading - they’re engineering entire ecosystems of execution algorithms, factor models, and risk engines that run around the clock.
The difference between me, my Python scripts, and a hedge-fund quant isn’t insight - it’s scale. They have cleaner data, faster pipelines, and infrastructure that turns risk into opportunity. But the core logic - turning patterns into probabilities - is something you can reproduce with a few hours in VS Code, a free API, and some linear algebra.
And all of this plays out inside a macro storm. A decade of near-zero rates made cheap capital the oxygen of quant finance. Then came inflation, the fastest tightening cycle in history, the Russian invasion of Ukraine, and now Trump-era volatility 2.0 - election uncertainty, tariff talk, and meme-stock déjà vu. Suddenly, liquidity wasn’t free, volatility returned, and the real alpha became survival. Emerging markets promised higher returns but came with political risk; U.S. tech soared again on AI hype; Europe quietly muddled through.
So yes - in bull markets everyone looks like a genius (especially Nancy Pelosi’s portfolio - I briefly considered scraping Pelosi’s trades for features, but even I have limits.). But in the long run, what separates quants from the rest of us isn’t foresight - it’s discipline. The real skill isn’t predicting the future; it’s building systems that don’t break when the future changes.
If I had a bit more time, I’d shove the pipeline into DuckDB, parallelize backtests with Ray, and JIT-compile my indicators with Numba - just enough to pretend I’m running a hedge fund from a laptop. After all, I didn’t take those data science classes during my PhD for nothing.
Btw, Warren Buffett (who just announced to retire at age 94) would roll his eyes at all this, of course. He once quipped that “you don’t need to be a rocket scientist. Investing is not a game where the guy with the 160 IQ beats the guy with the 130 IQ.” He prefers businesses with moats, not models with momentum. And maybe he’s right: while quants chase microseconds, Buffett’s been compounding at 20 percent for six decades - without a single line of Python.