tl;dr
I trained a neural network in Nushell by wrapping libtorch, the same C++ library
that powers PyTorch, in a Nushell plugin, making it
possible to create and process tensors on the command line.
Furthermore, I wrapped an entire web app and web browser in a second Nushell
plugin to make rendering beautiful, high resolution plots in the terminal
possible.
Together, I used these tools to train a neural network to classify data and
visualize the results, all inside my terminal.
I also compared the results to PyTorch and Matplotlib, which match exactly.
Results Preview
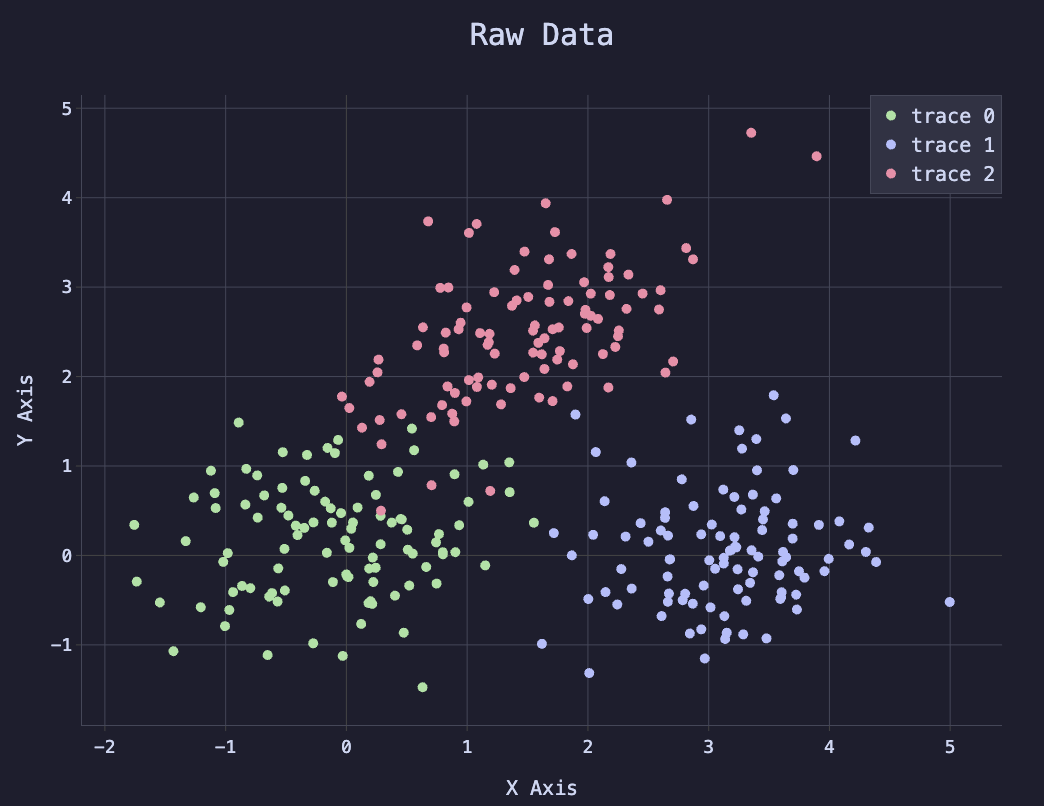
The following plot illustrates the neural network that I created with Nushell. I
started by generating data points that fall into three buckets. I then used a
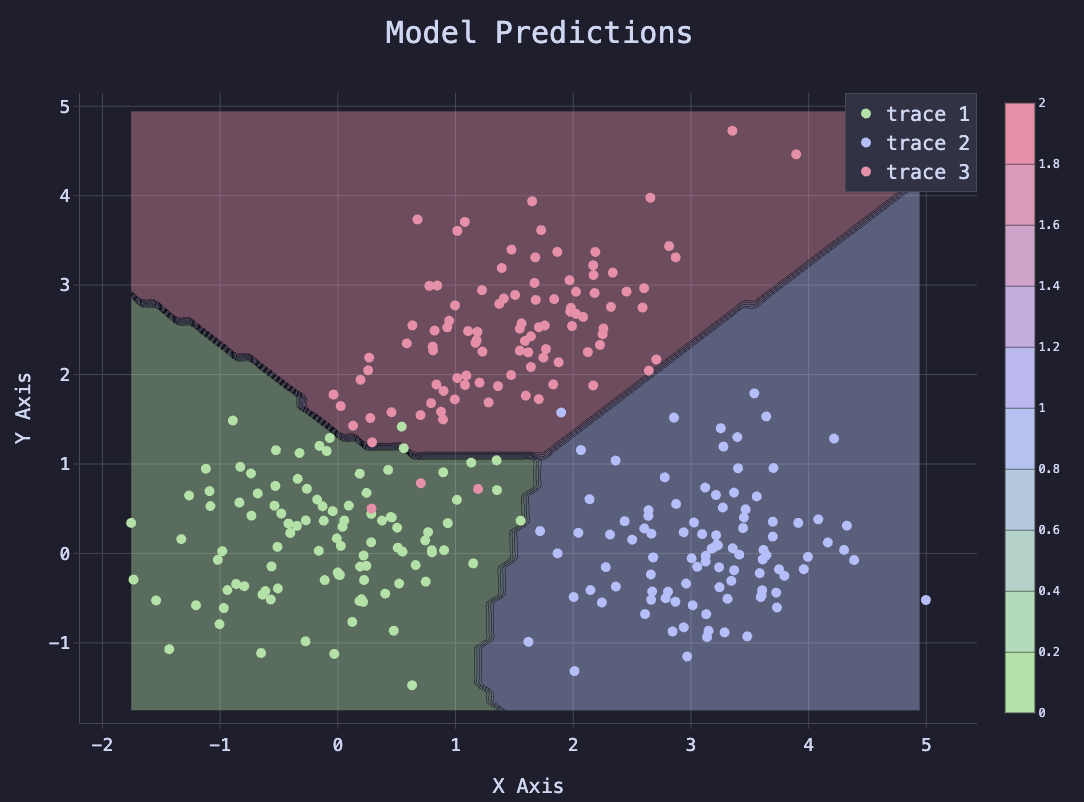
two-layer neural network to classify the points. The final plot shows both the
original “true” data points, and a contour map of the model, showing the model’s
predictions, and how well they match the original data.
What is Nushell?
Nushell is a new shell that is designed to handle
structured data, unlike traditional shells like zsh and bash, which are focused
on text. It is written in Rust and has many features of modern programming
languages, including a powerful type system, good errors, and a plugin system.
Why Nushell?
Although Python is a good programming language, I always thought it would be
cool if I could pipe data into my GPU directly from the command line. Because
Python is not a shell, this is impractical with Python. However, Nushell is a
shell, so it is designed to handle structured data and can easily pipe data from
one command to another.
Although building a similar proof of concept with zsh or bash is possible, no
one would ever want to do data analysis in those languages, because they are too
slow for all import/export operations. Nushell, however, handles structured data
efficiently, so it is sufficiently fast to pipe complex data from command to
command. The tooling for Nushell may not yet be as mature as Python, but in
principle it is just as capable of data analysis as Python, and brings a whole
new dimension of value to the table by being your shell, and thus working out of
the box with all of your existing shell commands and workflows.
How Does it Work?
I created two tools to make this possible: Nutorch and Termplot.
Nutorch
Nutorch is a Nushell plugin written in Rust that wraps
tch-rs, which itself is a Rust
wrapper for libtorch, the C++ library that powers
PyTorch. This plugin allows you to create and manipulate
tensors in Nushell, which are the fundamental data structure used in neural
networks (and a lot of other data analysis). The API is designed to be similar
to PyTorch, so if you are familiar with PyTorch, you will feel right at home. It
also has some convenient Nushell-specific features, such as the ability to pipe
data directly into tensors from other commands.
The fundamental idea of Nutorch is very simple: You can create tensors, either
by piping data into it or generating them from scratch, on any device (CPU or
CUDA or MPS). Those tensors are stored in a hash table which lives as long as
the Nushell plugin needs to live. Nushell decides when the plugin should exit,
which by default lasts 10 seconds since the last command.
Commands then accept tensors as input or arguments, and the tensors are
retrieved from memory and operated on. To view the final result, you can run
torch value which will download the tensor and convert it into a Nushell
value, which can then be printed or piped to another command.
Termplot
Termplot is a Node.js CLI tool that runs an entire
headless web browser (via puppeteer) with a web server
running a React Router web app with an in-memory
database of JSON configuration files to render
plotly.js plots (or, in the future, any other
web-based plotting library). Termplot takes a screen shot of the plot and
renders it to the terminal using
ANSI escape codes.
The standard Termplot CLI tool must open an entire web browser for every plot,
which is slow. So I also made a Nushell plugin for Termplot that manages the web
browser in the background, making plots render almost instantly. The normal CLI
tool takes about 2 seconds to render a plot, but the Nushell plugin renders
plots in about 20 milliseconds.
beautiful.nu
I have also created a simple Nushell script called beautiful.nu that generates
catppuccin-themed plotly.js configuration files, thus
bridging Nutorch and Termplot. The beautiful.nu code can be found on NPM
here and on GitHub in the Nutorch
repo here.
Simple One-Liner Example
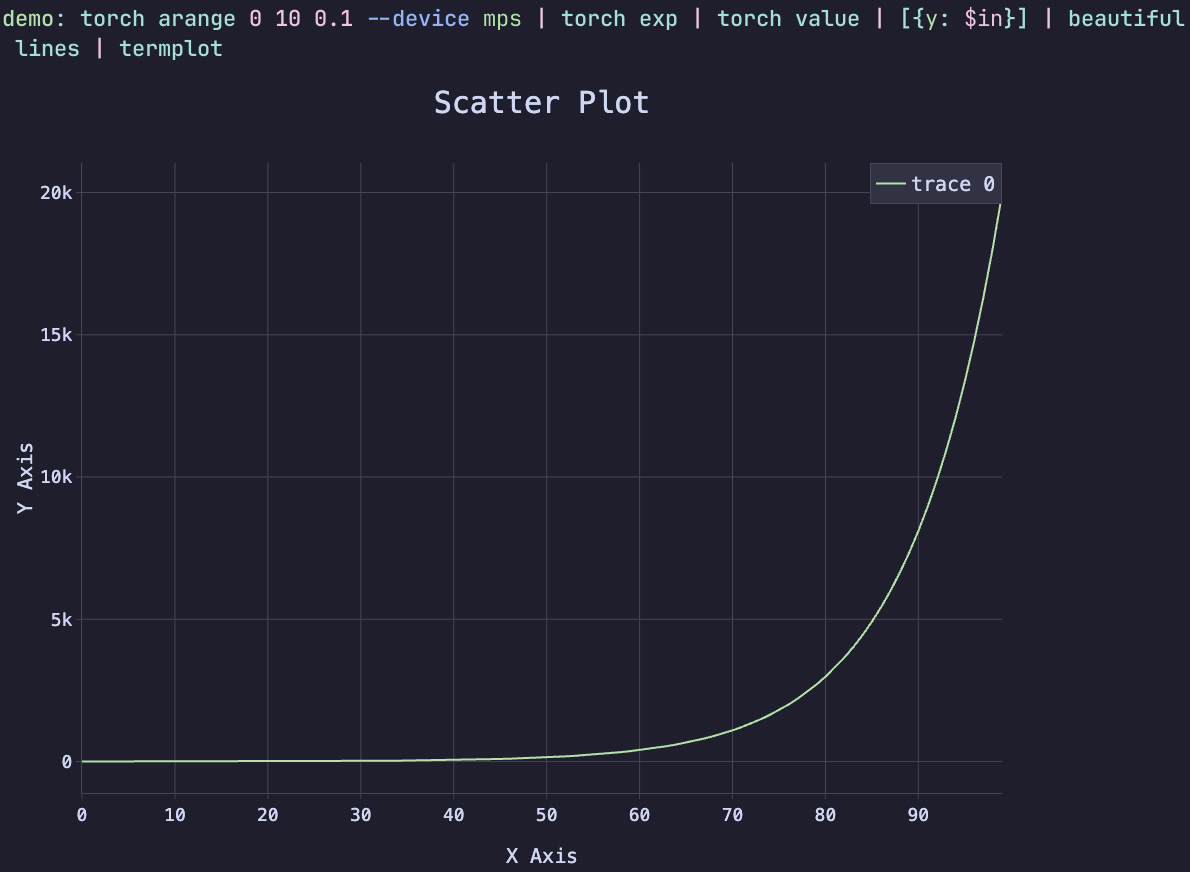
As a simple example of the power of Notorch and Termplot, considering the
following powerful one-liner:
torch arange
0 10 0.1 --device mps | torch exp | torch value | [{y: $
in}] | beautiful lines | termplot
This command generates a tensor of values from 0 to 10 in increments of 0.1,
computes the exponential of each value, downloads the result from the GPU,
generates a “beautiful” plot configuration from the data, and then plots the
result using Termplot. The --device mps flag specifies that the computation
should be done on the Apple M1 GPU (if available). The final result is a
beautiful plot of the exponential function rendered directly in the terminal.
Have you ever seen a one-liner like this does does a computation on the GPU, and
renders the result directly in the terminal? This is the power of Nutorch and
Termplot working together.
Neural Network Example
I trained a neural network in Nushell using Nutorch and Termplot in the
following manner:
- I generated a series of data points that fall into three separate clusters.
Each data point corresponds to a label, which is the cluster it belongs to.
The labels are integers 0, 1, or 2.
- Knowing it was possible to use a two-layer neural network with ReLU activation
to classify the data, I created a Nushell function that initializes the model
parameters (weights and biases) for a two-layer neural network with ReLU
activation.
- I created a Nushell function that performs a forward pass through the model,
which computes the logits (raw outputs) of the model.
- I created a Nushell function that computes the cross entropy loss between the
logits and the target labels.
- I created a Nutorch function, called from Nushell, that performs stochastic
gradient descent (SGD) to update the model parameters based on the loss.
- I created a Nushell function that trains the model for a specified number of
epochs, recording the loss every so often.
- I created a Nushell function that plots the raw data points using Termplot.
- I created a Nushell function that plots the loss over time using Termplot.
- I created a Nushell function that plots the model predictions using Termplot,
which shows the decision boundary of the model and how well it matches the
original data.
- I programmed the exact same logic in Python using PyTorch and Matplotlib to
verify that the results match exactly. Because the underlying library is
libtorch, using the same random seed, the results are exactly the same,
proving the Nushell code is working exactly as intended. The Python code was
written first and used as a template to make sure the Nushell code was
complete.
You can see the code for the Nushell neural network example and the
corresponding code in Python in the appendix below. You can also find additional
information on installing Nutorch and Termplot on their respective GitHub pages:
Visualizing the Results
The following plot shows the initial data points, colored by their class.
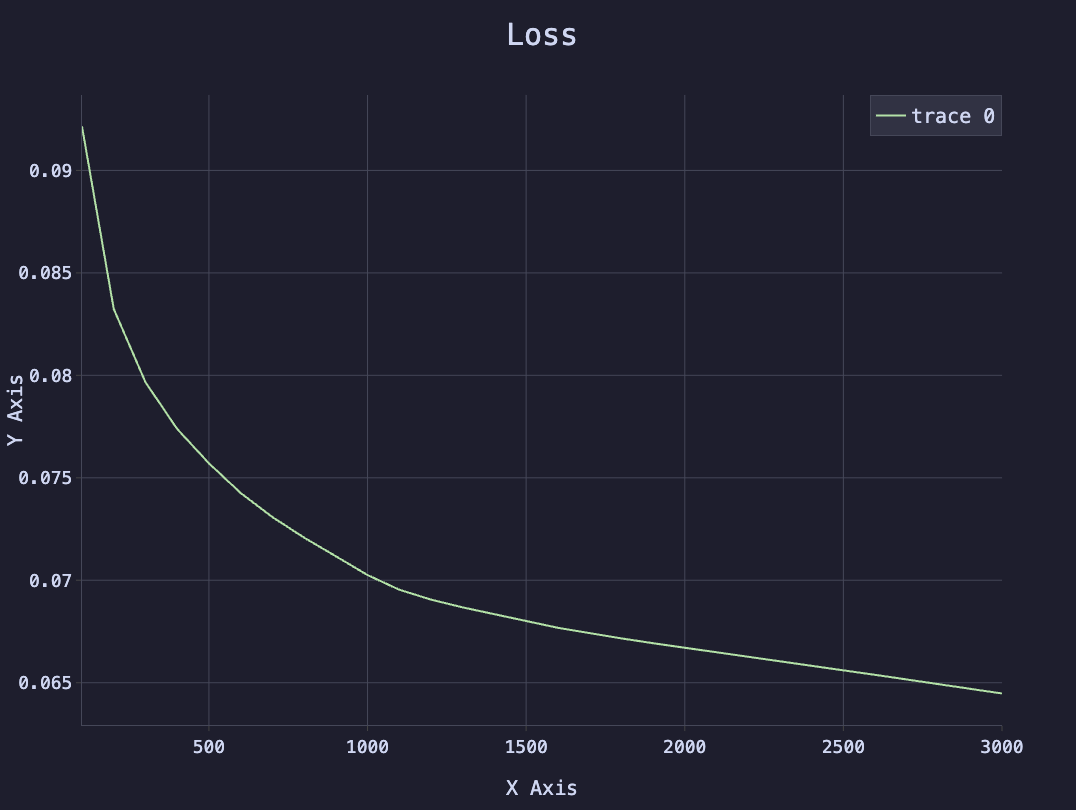
The following plot shows the loss over time during training.
The following plot shows the model predictions, with the decision boundary
overlaid on the original data points.
These plots were created using Nutorch and Termplot, but similar plots can be
produced using the Python code in the appendix below.
Conclusion
Modern technologies including Nushell, libtorch, and tch-rs make it possible to
do data analysis and machine learning in a shell environment. This is extremely
convenient and powerful for anyone who spends a lot of time in the terminal
because it is compatible with all of your existing shell commands and workflows.
A proof of concept neural network was created in Nushell using Nutorch and
Termplot, which demonstrates the power of these tools. The neural network was
trained to classify data points into three clusters, and the results were
visualized using Termplot. The results match exactly with a similar
implementation in Python using PyTorch and Matplotlib, proving that the Nushell
implementation is working as intended.
To learn more about how to use Nutorch and Termplot, please visit their
respective websites, which currently redirect to GitHub:
Appendix A: Nushell Neural Network Example
plugin
use torch
plugin
use termplot
source node_modules/termplot.nu/termplot.nu
use node_modules/beautiful.nu *
torch manual_seed
42
def generate_data [
--n_samples:
int =
300 # Number of samples to generate
--centers:
int =
3 # Number of cluster centers
--cluster_std:
float =
0.7 # Standard deviation of clusters
--skew_factor:
float =
0.3 # Skew factor
for data distribution
]: [
nothing ->
record<X:
string, y:
string>] {
let n_samples_per_class:
int = ($n_samples // $centers)
mut X_list:
list<
string> = [] # nutorch tensors have
string ids
mut y_list:
list<
string> = [] # nutorch tensors have
string ids
let blob_centers:
list<
string> = [
(torch tensor [
0.0 0.0])
(torch tensor [
3.0 0.0])
(torch tensor [
1.5 2.5])
]
for i
in (seq
0 ($centers -
1)) {
mut points:
string = (torch randn $n_samples_per_class
2) | torch mul (torch tensor $cluster_std) | torch add ($blob_centers |
get $i)
if $i ==
1 or $i ==
2 {
let center = ($blob_centers |
get $i)
let skew = torch tensor [[
1.0 ($skew_factor * ($i -
1))] [($skew_factor * ($i -
1))
1.0]]
$points = $points | torch sub $center | torch mm $skew | torch add $center
}
let labels:
string = torch full [$n_samples_per_class] $i --dtype 'int64'
$X_list = $X_list | append $points
$y_list = $y_list | append $labels
}
let X:
string = $X_list | torch cat --dim
0
let y:
string = $y_list | torch cat --dim
0
{X: $X y: $y}
}
def model_init [
--input_size:
int =
2 # Number of input features
--hidden_size:
int =
20 # Number of hidden units
--output_size:
int =
3 # Number of output classes
]: [
nothing ->
record<w1:
string, b1:
string, w2:
string, b2:
string>] {
{
w1: (torch randn $hidden_size $input_size --requires_grad
true)
b1: (torch randn $hidden_size --requires_grad
true)
w2: (torch randn $output_size $hidden_size --requires_grad
true)
b2: (torch randn $output_size --requires_grad
true)
}
}
def model_get_parameters [
--model:
record<w1:
string, b1:
string, w2:
string, b2:
string>
]: [
nothing ->
list<
string>] {
[$model.w1 $model.b1 $model.w2 $model.b2]
}
def model_forward_pass [
--model:
record<w1:
string, b1:
string, w2:
string, b2:
string>
]: [
string ->
string] {
torch mm ($model.w1 | torch t) # Matrix multiplication with input
and first layer weights
| torch add $model.b1 # Add bias
for first layer
| torch maximum ([
0.0] | torch tensor) # ReLU activation
| torch mm ($model.w2 | torch t) # Matrix multiplication with second layer weights
| torch add $model.b2 # Add bias
for second layer
}
def cross_entropy_loss [
--logits:
string # tensor id of model outputs
--targets:
string # tensor id of target labels
]: [
nothing ->
string] {
let logp = $logits | torch log_softmax --dim
1
#
print $"logp: ($logp | torch mean | torch value)"
let loss = $logp | torch gather
1 ($targets | torch unsqueeze
1) | torch squeeze
1 | torch mean | torch neg
$loss
}
def train [
--model:
record<w1:
string, b1:
string, w2:
string, b2:
string>
--X:
string # Input tensor id
--y:
string # Target tensor id
--epochs:
int =
1000
--lr:
float =
0.1
--record_every:
int =
100
]: [
nothing ->
record<model:
record<w1:
string, b1:
string, w2:
string, b2:
string>, losses:
list<number>, steps:
list<number>>] {
mut losses:
list<number> = []
mut steps:
list<number> = []
let ps = model_get_parameters --model $model
for epoch
in (seq
0 ($epochs -
1)) {
let logits = $X | model_forward_pass --model $model
let loss = cross_entropy_loss --logits $logits --targets $y
for p
in $ps {
$p | torch zero_grad
}
$loss | torch backward
torch sgd_step $ps --lr $lr
if ($epoch +
1) mod $record_every ==
0 {
$losses = $losses | append ($loss | torch value)
$steps = $steps | append ($epoch +
1)
print $"epoch: ($epoch +
1)/($epochs), loss: (($loss | torch value | math round --precision
4))"
}
}
return {
model: $model
losses: $losses
steps: $steps
}
}
def plot_raw_data [res:
record<X:
string, y:
string>] {
# Call with named arguments (flags)
let X:
string = $res.X
let y:
string = $res.y
let X_value = $X | torch value
let y_value = $y | torch value
[
{
x: ($X_value | enumerate | each {|xy|
if ($y_value |
get $xy.index) ==
0 { $xy.item.
0 } })
y: ($X_value | enumerate | each {|xy|
if ($y_value |
get $xy.index) ==
0 { $xy.item.
1 } })
}
{
x: ($X_value | enumerate | each {|xy|
if ($y_value |
get $xy.index) ==
1 { $xy.item.
0 } })
y: ($X_value | enumerate | each {|xy|
if ($y_value |
get $xy.index) ==
1 { $xy.item.
1 } })
}
{
x: ($X_value | enumerate | each {|xy|
if ($y_value |
get $xy.index) ==
2 { $xy.item.
0 } })
y: ($X_value | enumerate | each {|xy|
if ($y_value |
get $xy.index) ==
2 { $xy.item.
1 } })
}
] | beautiful scatter | merge deep {layout: {title: {text: "Raw Data"}}} | termplot
}
def plot_loss [
--losses:
list<number> #
list of loss values
--steps:
list<number> #
list of steps (epochs) corresponding to losses
] {
[{x: $steps y: $losses}] | beautiful lines | merge deep {layout: {title: {text: "Loss"}}} | termplot
}
def plot_results [
--X:
string # Input tensor id
--y:
string # Target tensor id
--model:
record<w1:
string, b1:
string, w2:
string, b2:
string> # Model parameters
]: [
nothing ->
nothing] {
let Xl = $X | torch detach | torch value
let yl = $y | torch detach | torch value
#
let yscaledl = $y | torch div ($y | torch max) | torch detach | torch value
let x_min = ($Xl | each {|x| $x |
get 0 }) | math min
let x_max = ($Xl | each {|x| $x |
get 0 }) | math max
let y_min = ($Xl | each {|x| $x |
get 1 }) | math min
let y_max = ($Xl | each {|x| $x |
get 1 }) | math max
let xs = torch arange $x_min $x_max
0.1
#
let ys = torch arange $y_min $y_max
0.1
let ys = $xs
let mesh = torch stack [
($xs | torch repeat ($ys | torch value | length))
($ys | torch repeat_interleave ($xs | torch value | length))
] --dim
1
let logits = $mesh | model_forward_pass --model $model
let Z = torch argmax $logits --dim
1 | torch reshape [($xs | torch value | length) ($ys | torch value | length)]
beautiful plot
| beautiful add contour {
x: ($xs | torch value)
y: ($ys | torch value)
z: ($Z | torch value)
colorscale: (beautiful colorscale
3)
opacity:
0.4
}
| beautiful add scatter {
x: ($Xl | enumerate | each {|xy|
if (($yl |
get $xy.index) ==
0) { $xy.item.
0 } })
y: ($Xl | enumerate | each {|xy|
if (($yl |
get $xy.index) ==
0) { $xy.item.
1 } })
}
| beautiful add scatter {
x: ($Xl | enumerate | each {|xy|
if (($yl |
get $xy.index) ==
1) { $xy.item.
0 } })
y: ($Xl | enumerate | each {|xy|
if (($yl |
get $xy.index) ==
1) { $xy.item.
1 } })
}
| beautiful add scatter {
x: ($Xl | enumerate | each {|xy|
if (($yl |
get $xy.index) ==
2) { $xy.item.
0 } })
y: ($Xl | enumerate | each {|xy|
if (($yl |
get $xy.index) ==
2) { $xy.item.
1 } })
}
| merge deep {layout: {title: {text: "Model Predictions"}}} | termplot
}
let raw_data = generate_data --n_samples
300 --centers
3 --cluster_std
0.7 --skew_factor
0.3
plot_raw_data $raw_data
let net = model_init --input_size
2 --hidden_size
20 --output_size
3
let model_res = train --model $net --X $raw_data.X --y $raw_data.y --epochs
3000 --lr
0.1 --record_every
100
plot_loss --losses $model_res.losses --steps $model_res.steps
plot_results --X $raw_data.X --y $raw_data.y --model $model_res.model
Appendix B: Python Neural Network Example
import torch
from typing
import List,
Tuple,
Dict
import matplotlib.pyplot
as plt
torch.manual_seed(
42)
def generate_data(
n_samples: int = 300,
centers: int = 3,
cluster_std: float = 0.7,
skew_factor: float = 0.3,
) ->
Tuple[torch.Tensor, torch.Tensor]:
n_per_class = n_samples // centers
X_parts, y_parts = [], []
blob_centers = [
torch.tensor([
0.0,
0.0]),
torch.tensor([
3.0,
0.0]),
torch.tensor([
1.5,
2.5]),
]
for i
in range(centers):
pts = torch.randn(n_per_class,
2) * cluster_std + blob_centers[i]
if i
in (
1,
2):
skew = torch.tensor(
[[
1.0, skew_factor * (i -
1)], [skew_factor * (i -
1),
1.0]]
)
pts = torch.mm(pts - blob_centers[i], skew) + blob_centers[i]
X_parts.append(pts)
y_parts.append(torch.full((n_per_class,), i, dtype=torch.long))
return torch.cat(X_parts), torch.cat(y_parts)
Model =
Dict[
str, torch.Tensor]
def model_init(
inp: int = 2, hid: int = 20, out: int = 3) -> Model:
return {
"w1": torch.randn(hid, inp, requires_grad=
True),
"b1": torch.randn(hid, requires_grad=
True),
"w2": torch.randn(out, hid, requires_grad=
True),
"b2": torch.randn(out, requires_grad=
True),
}
def model_get_parameters(
model: Model) ->
List[torch.Tensor]:
return [model[
"w1"], model[
"b1"], model[
"w2"], model[
"b2"]]
def model_forward_pass(
model: Model, x: torch.Tensor) -> torch.Tensor:
w1t = model[
"w1"].t()
x = torch.mm(x, w1t) + model[
"b1"]
x = torch.
max(torch.tensor(
0.0), x)
w2t = model[
"w2"].t()
x = torch.mm(x, w2t) + model[
"b2"]
return x
def cross_entropy_loss(
logits: torch.Tensor, targets: torch.Tensor) -> torch.Tensor:
logp = torch.log_softmax(logits, dim=
1)
chosen = torch.gather(logp,
1, targets.unsqueeze(
1)).squeeze(
1)
return -chosen.mean()
def sgd_step(
ps: List[torch.Tensor], lr: float = 0.1) ->
None:
"""
Vanilla gradient descent: p ← p - lr * p.grad , then reset gradients.
Operates in-place; returns nothing.
"""
with torch.no_grad():
for p
in ps:
if p.grad
is not None:
p -= lr * p.grad
def train(
model: Model,
X: torch.Tensor,
y: torch.Tensor,
epochs: int = 1000,
lr: float = 0.1,
record_every: int = 100,
) ->
Tuple[
List[
float],
List[
int]]:
losses, steps = [], []
ps = model_get_parameters(model)
for epoch
in range(epochs):
logits = model_forward_pass(model, X)
loss = cross_entropy_loss(logits, y)
for p
in ps:
if p.grad
is not None:
p.grad.zero_()
loss.backward()
sgd_step(ps, lr)
if (epoch +
1) % record_every ==
0:
losses.append(loss.item())
steps.append(epoch +
1)
print(
f"epoch {epoch+1:4d}/{epochs} loss {loss.item():.4f}")
return losses, steps
def plot_raw_data(
X: torch.Tensor, y: torch.Tensor) ->
None:
Xl, yl = X.tolist(), y.tolist()
plt.scatter([p[
0]
for p
in Xl], [p[
1]
for p
in Xl], c=yl, alpha=
0.8, cmap=
"viridis")
plt.title(
"Raw data")
plt.show()
def plot_loss(
losses: List[float], steps: List[int]) ->
None:
plt.plot(steps, losses)
plt.title(
"Training loss")
plt.xlabel(
"epoch")
plt.ylabel(
"loss")
plt.show()
def plot_results(
X: torch.Tensor, y: torch.Tensor, model: Model) ->
None:
Xl = X.detach().tolist()
yl = y.detach().tolist()
x_min =
min(p[
0]
for p
in Xl) -
1
x_max =
max(p[
0]
for p
in Xl) +
1
y_min =
min(p[
1]
for p
in Xl) -
1
y_max =
max(p[
1]
for p
in Xl) +
1
xs = torch.arange(x_min, x_max,
0.1)
ys = torch.arange(y_min, y_max,
0.1)
mesh = torch.stack([xs.repeat(
len(ys)), ys.repeat_interleave(
len(xs))], dim=
1)
logits = model_forward_pass(model, mesh)
Z = torch.argmax(logits, dim=
1).reshape(
len(ys),
len(xs))
plt.contourf(xs, ys, Z, alpha=
0.4, cmap=
"viridis")
plt.scatter([p[
0]
for p
in Xl], [p[
1]
for p
in Xl], c=yl, alpha=
0.8, cmap=
"viridis")
plt.title(
"Decision boundary")
plt.show()
if __name__ ==
"__main__":
X, y = generate_data(n_samples=
300, centers=
3, cluster_std=
0.7, skew_factor=
0.3)
plot_raw_data(X, y)
net = model_init(inp=
2, hid=
20, out=
3)
losses, steps = train(net, X, y, epochs=
3000, lr=
0.1, record_every=
100)
plot_loss(losses, steps)
plot_results(X, y, net)
.png)