The basic promise of a query optimizer is that it picks the “optimal” query plan. But there’s a catch - the plan selection relies on cost estimates, calculated from selectivity estimates and cost of basic resources (I/O, CPU, …). So the question is, how often do we actually pick the “fastest” plan? And the truth is we actually make mistakes quite often.
Consider the following chart, with durations of a simple SELECT query with a range condition. The condition is varied to match different fractions of the table, shown on the x-axis (fraction of pages with matching rows). The plan is forced to use different scan methods using enable_ options, and the dark points mark runs when the scan method “won” even without using the enable_ parameters.
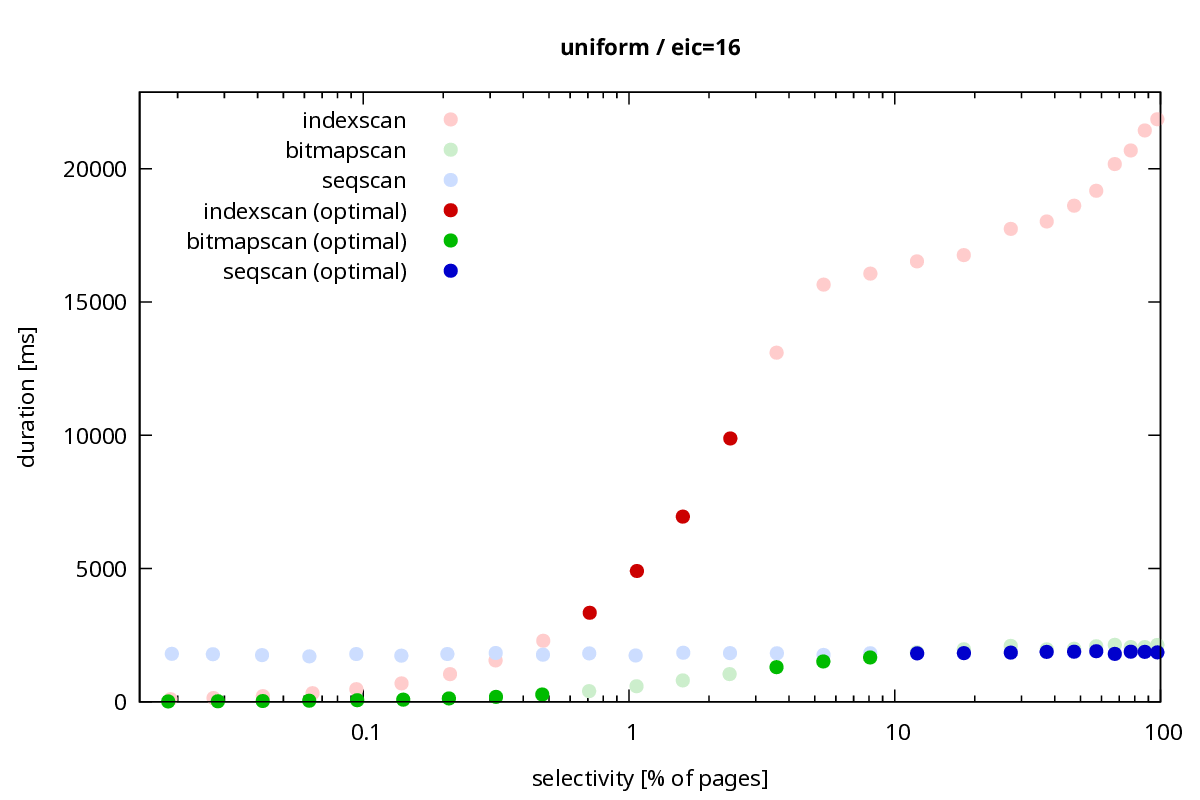
It shows that for selectivities ~1-5% (the x-axis is logarithmic), the planner picks an index scan, but this happens to be a poor choice. It takes up to ~10 seconds, and a simple “dumb” sequential scan would complete the query in ~2 seconds.
This is a good demonstration of why it’s pointless to try to get index scans everywhere, which application developers sometimes aim for.
The 1% selectivity is fairly high, but for lower selectivities it’s not much different. It’s not very visible on the chart, but let’s switch the y-axis to log scale, to see low selectivities better:
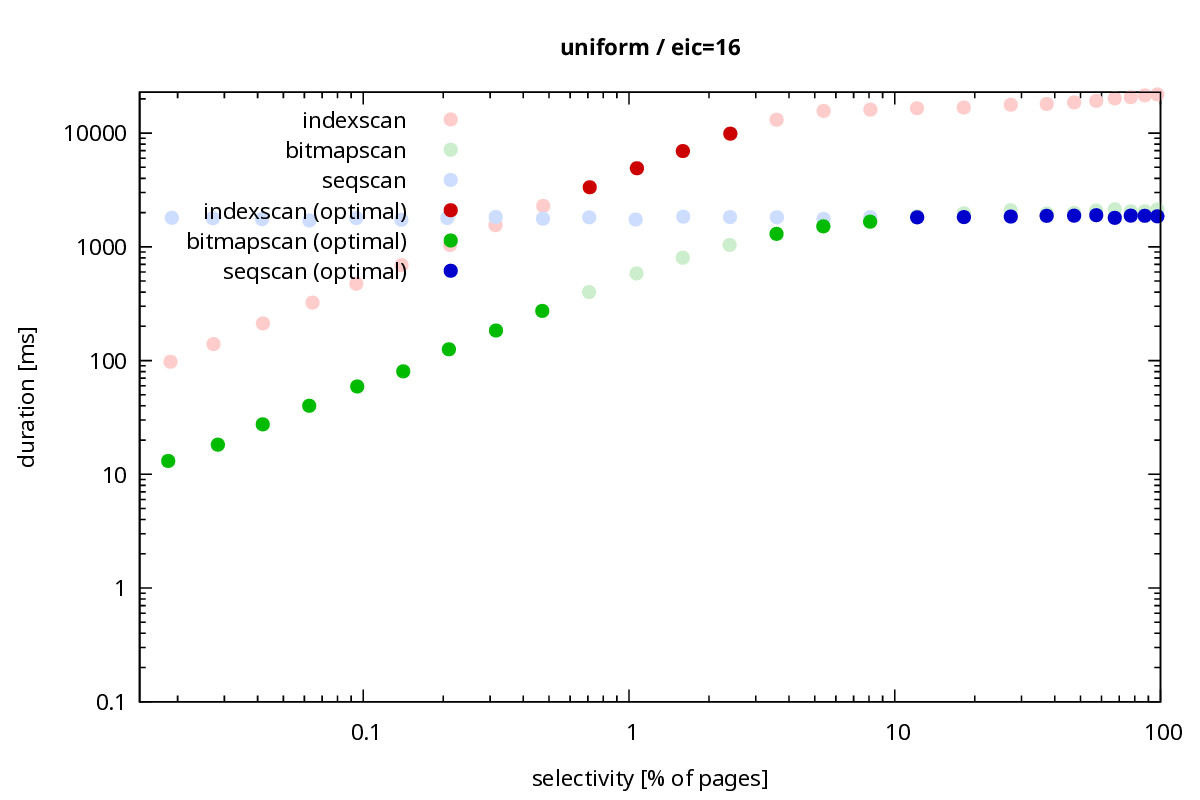
The index scans never win for this query! The bitmap scans dominate, even for the most selective conditions, by a factor of ~10x. The planner does correctly pick the bitmap scans, so that’s good.
Note: The reason is fairly simple - bitmap scans perform prefetching, index scans don’t. Disabling prefetching (or using my WIP patch with index prefetching) eliminates the difference.
The above charts are for a uniform data set, which is a bit extreme. On the one hand it’s the simplest to calculate estimates for. We even assume uniformity / independence in some places. On the other hand, it has the worst data locality.
So what about some other data distributions, with different correlation patterns? I ran this with a number of datasets, and here’s a couple examples. I’ll show the regular and log scale chart for each.
Note: For details about the test, see create.sql SQL script (where all the data sets are created), and the main test script run-test.sh.
cyclic, fuzz=1
First, “cyclic” with a little bit of “fuzz” adding randomness.
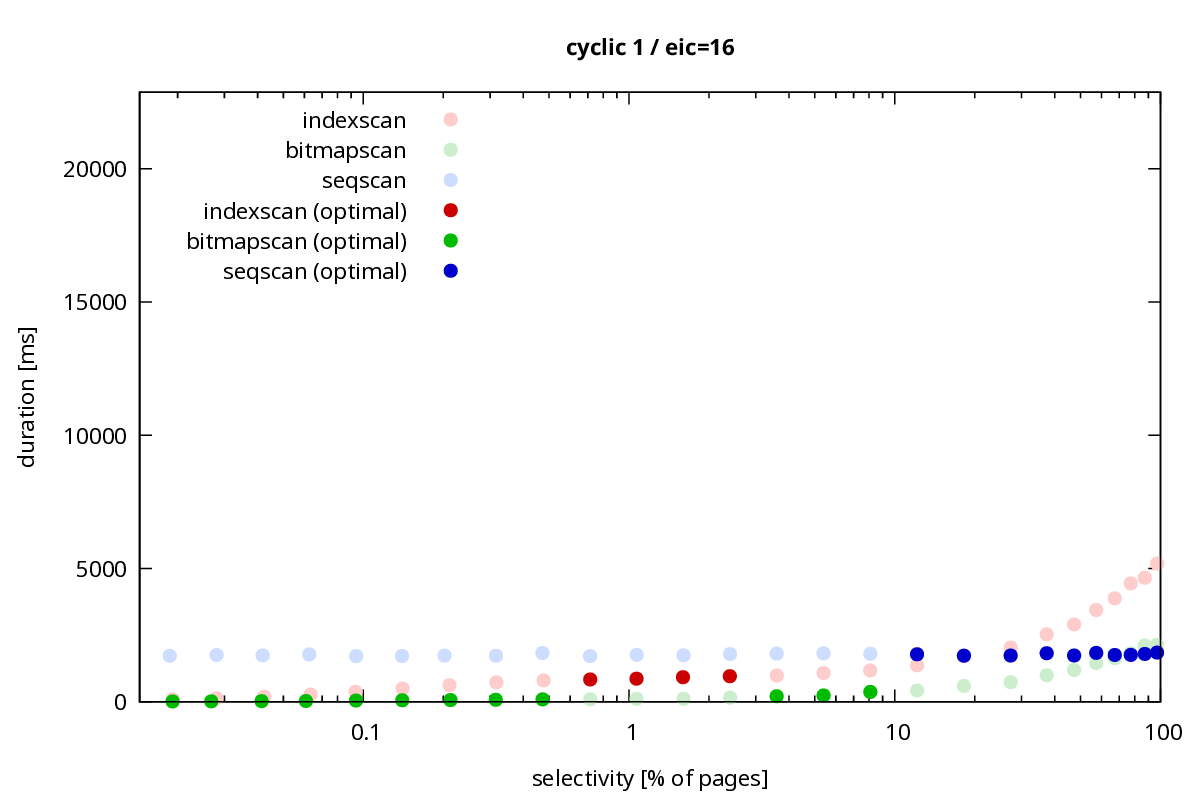

This is (maybe) a bit better than the uniform data set, but we still make some mistakes. We temporarily flip to index scan instead of just sticking to the bitmap scan. And then we flip to seqscan too early.
linear, fuzz=10
First, “linear” data set, with 10x more “fuzz” adding randomness.
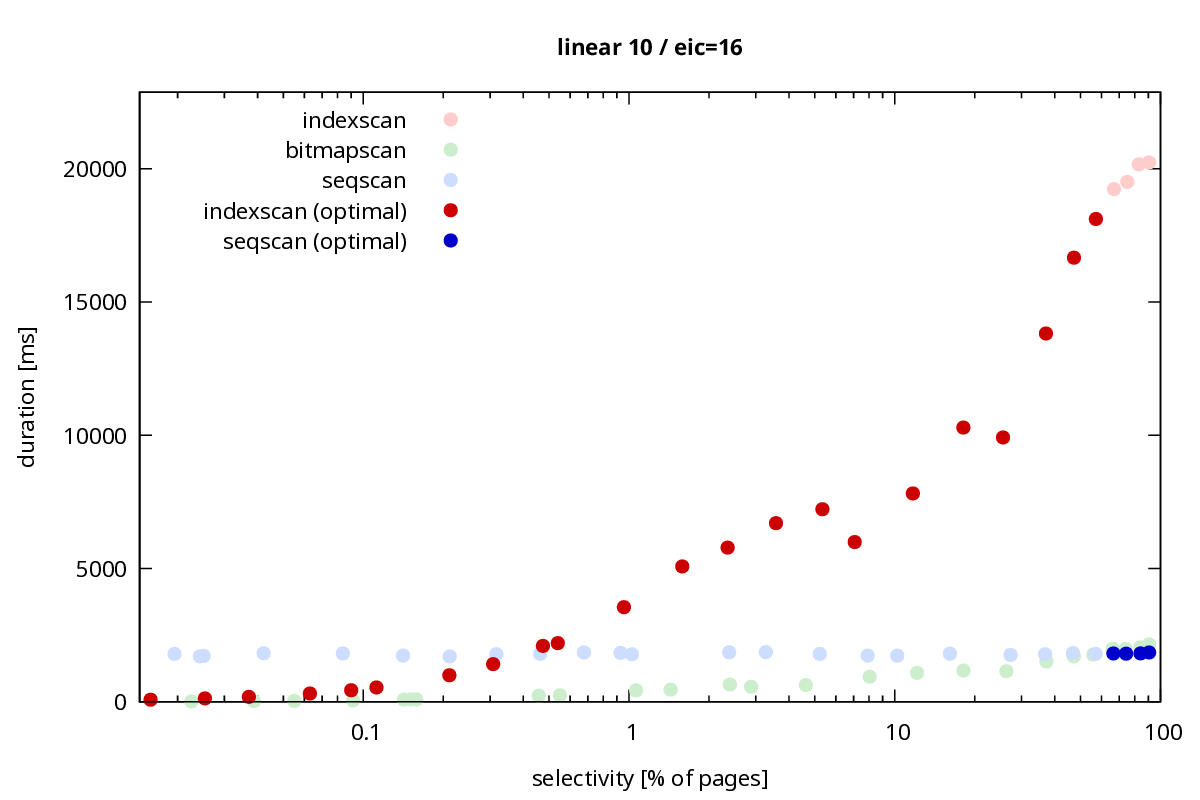
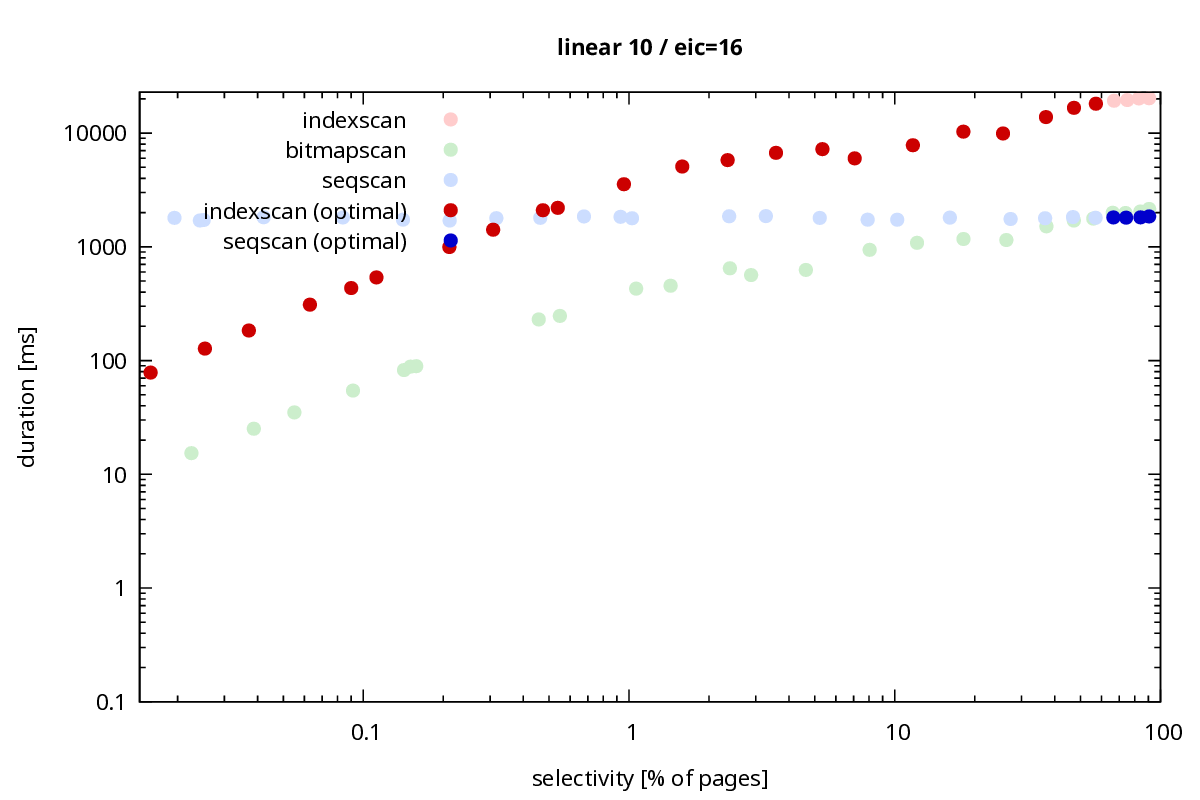
Not great, and clearly worse than what we saw on the uniform chart. The planner is much more persistent in picking the index scan, even for the low selectivities (on uniform it picks bitmap scans). And none of these decisions are optimal - a bitmap scan would be a better choice. Only at the very end (selectivities ~90%) the plan correctly flips to seqscan.
linear (no fuzz)
Finally, a perfectly linear data set - monotonically increasing values. This happens to be the only case where we consistently pick the right (actually fastest) plan.
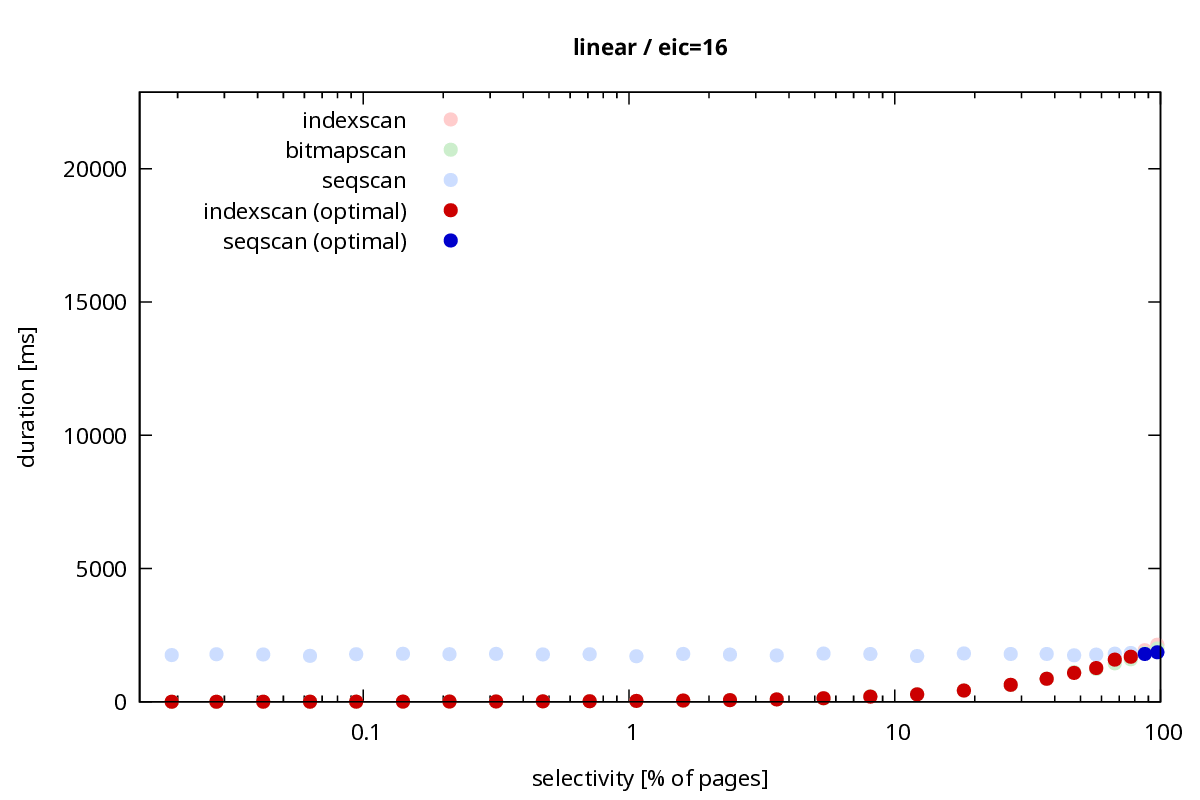
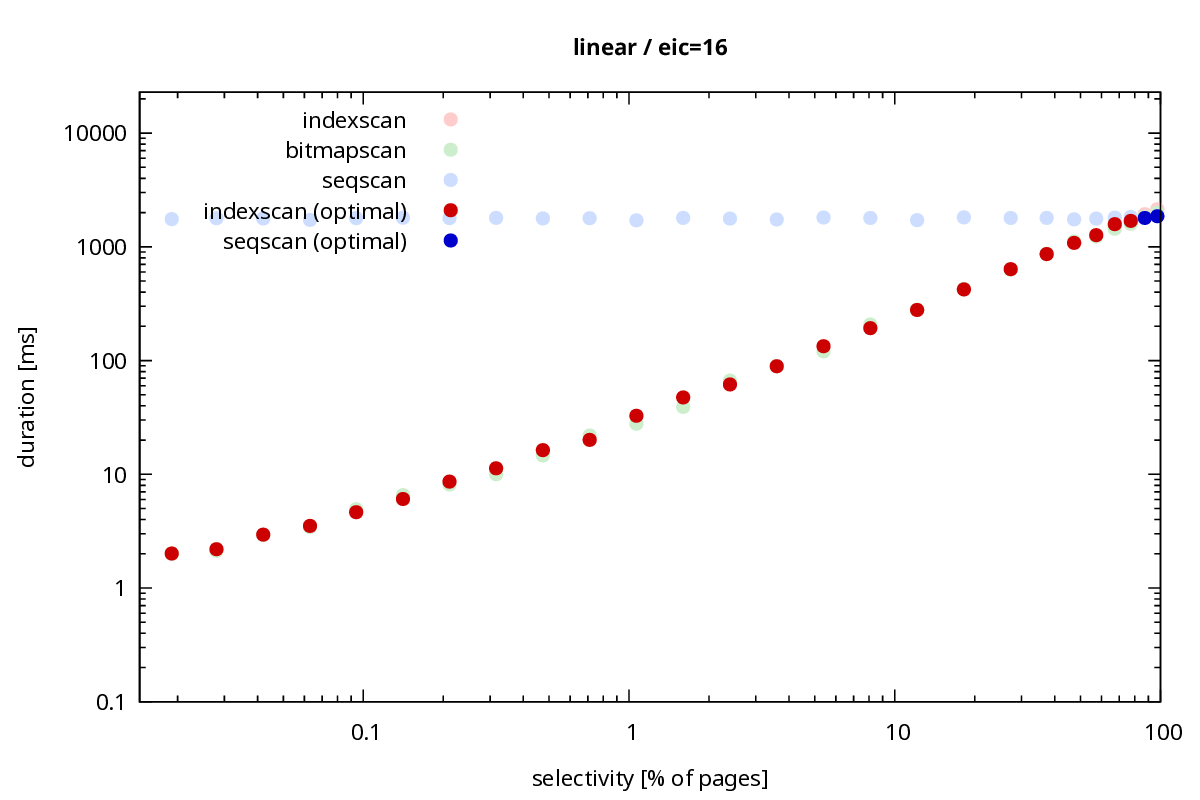
There’s very little difference between index scans and bitmap scans. The data set is perfect for the kernel readahead, and does not benefit from manual prefetching. The flip to seqscan is at the right place too (and even if it didn’t flip, the index scans would work OK).
Summary
The presented results are from a machine with Ryzen 9900X and NVMe RAID. I have far more results from other hardware (e.g. from SATA SSDs), but the overall behavior is exactly the same.
The runs were with cold cache (nothing in page cache or shared buffers). With warm caches some of the differences disappear, or at least become much less significant. For example, all the differences between index scans and bitmap scans go away, because the prefetching makes little difference with all data in cache.
The point I tried to make is that the planner picks the plan it believes to be the optimal one, based on the statistics and cost model. It’d be great if it really was the best plan, but it may not be, and it often is not. The best we can hope for is to not be too far from the best plan.
This may not be immediately obvious, because how would you know there’s a better plan? And then you’d have to force the plan manually. Most users just trust the database, and only notice this for selectivities at the threshold between different plans. This is where the “cliffs” happen, when the query flips between different plans with vastly different performance.
It might be possible to adjust some of the cost parameters to get better plans more often. My experience is that what works for a data set with one distribution may harm another data set. Perfect config for all data sets is probably impossible.
Moreover, the tests use very simple queries - single-table SELECT with a single range WHERE condition. For more complex queries (e.g. joins of tables with different data distributions) the behavior will be much more complicated.
Is there a plausible way to improve this? The planning has to rely on a very compact/small representation of the data (the optimizar stats), in order to be fast. And the stats are necessarily only a much simplified representation of the data. We can improve this and add more statistics (e.g. about correlation between columns etc.), but it’ll always be a lossy compression. It’ll always omit some interesting details.
There’s also the question of the cost model itself, which is a very rough approximation of the hardware behavior. It was rough with on-premise systems, it seems even less accurate in cloud environments with complex storage systems etc.
This seems like a fairly fundamental challenge of cost-based planning. I’m sure we can improve the various steps (better stats, better cost model), but there’ll always be some missing details.
All this being said, I still think cost-based planning is the best available approach. Because what would be a better alternative? Surely not hard-coded plans, or rule-based planning. But it reminds me of the importance of robustness of plans, and perhaps even having a way to adjust the query plan if we realize it’s not quite right.
Do you have feedback on this post? Please reach out by e-mail to [email protected].
.png)


