.png)

Arguments about renewable energy costs are common in climate and energy discussions. And much like the climate debate of the 2000s, a lot of what you hear is just mis-/disinformation from people who are trying to lock us into a fossil fuel future.
One of the most contentious yet stupid arguments is whether renewables reduce energy costs. In this post, I’ll show an analysis of ERCOT data that demonstrates that renewables aren’t just clean, they’re saving Texas consumers serious money.
Let’s compare August 2018 to August 2024. Over this six-year period, average daily peak demand in August increased from 65 GW to 80 GW. At the same time, there was a rapid build-out of solar power, with the average daily peak production increasing from 1.2 GW in 2018 to 18.8 GW in 2024.
Let’s start our analysis by comparing the price of electricity in these two months. Figure 1 shows the wholesale price of power in Texas, as a function of total load:
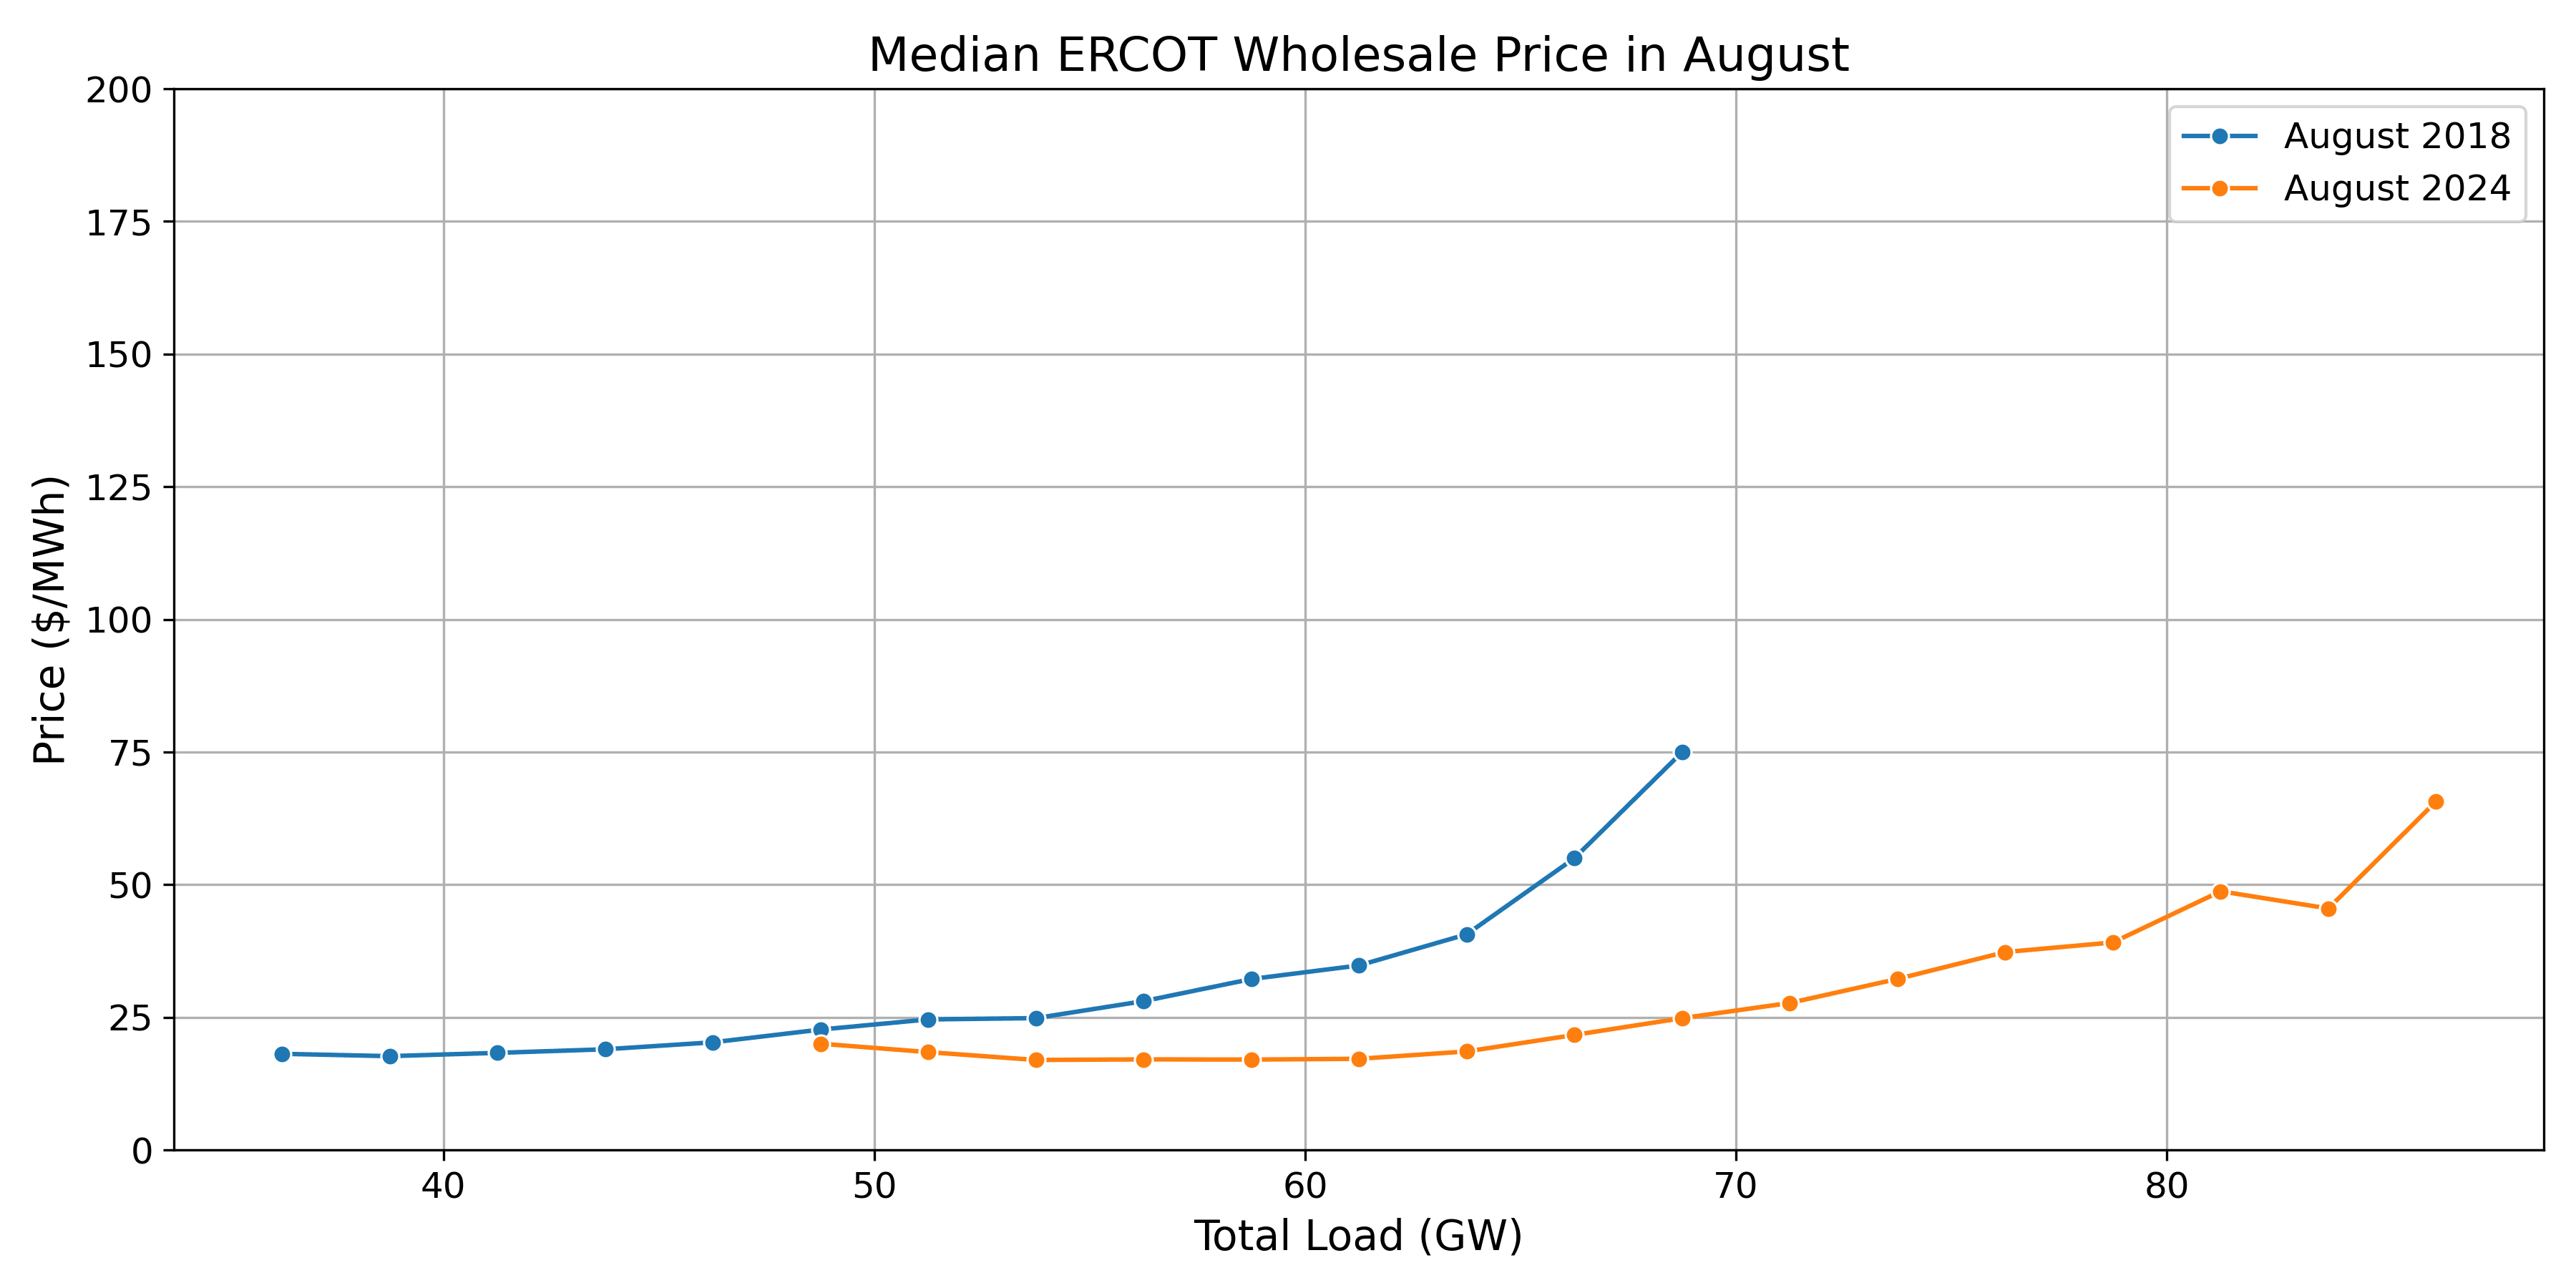
The curves cover different load ranges, reflecting the increase in demand between 2018 and 2024. But, for demand levels that occurred in both years, the cost of electricity was consistently lower in August 2024 than in August 2018.
What’s going on?
In markets like Texas, the wholesale price of electricity is set equal to the price of electricity from the most expensive generator needed to meet demand, often referred to as the marginal generator. Read this post for more info on how this works.
In other words, every generator receives this price, and all consumers pay it. This, by the way, is why solar power is so profitable — it receives the same price as expensive natural gas plants while having much lower costs.
This pricing method has an important consequence: as demand increases, ERCOT must dispatch progressively more expensive generators, which drives up the wholesale electricity price. This explains why the price of electricity generally rises with demand (Fig. 1).
The marginal generator on the Texas grid is almost always a fossil-fuel plant. Thus, it is the amount of electricity produced by fossil fuels that determines the price of electricity on the Texas grid.
We have a metric that for this: net load, which is total load minus renewables (solar + wind + batteries). Net load approximates fossil fuel demand, so it determines electricity prices.
I’ve plotted net load vs. price in Figure 2:
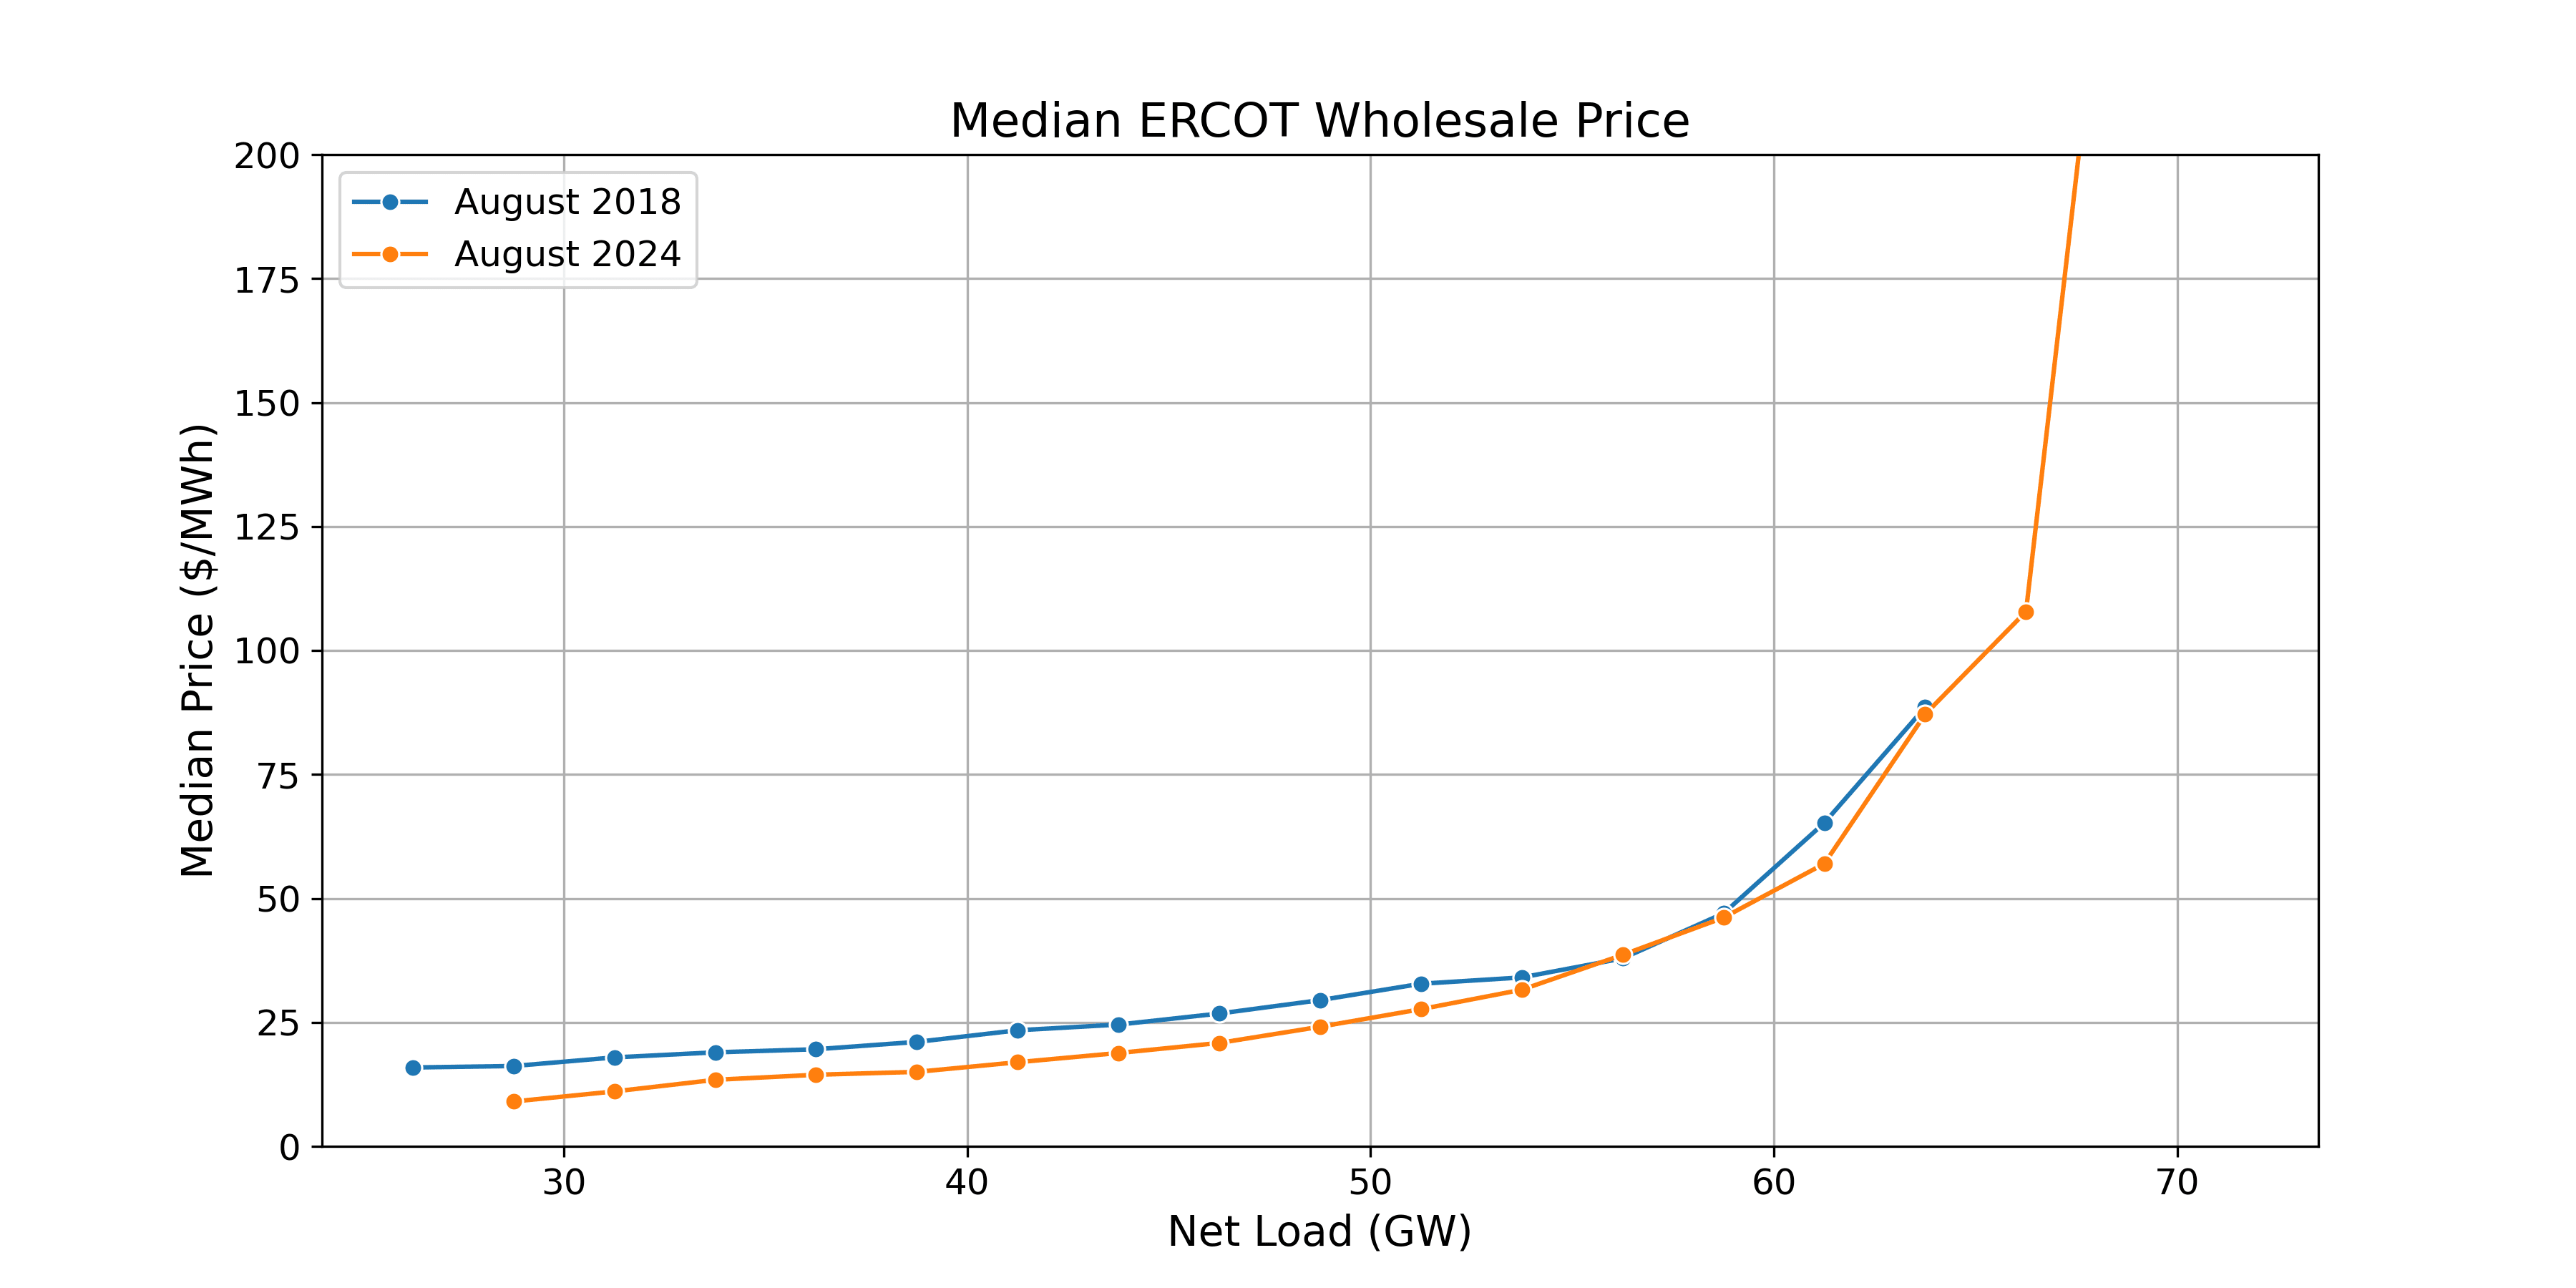
Clearly, there is extremely close agreement between these curves, reflecting the fact that net load is what determines the price of electricity.
It will be clearer with an example. Figure 3 shows the net load (i.e., how much fossil fuel-based electricity you need) as a function of total load:
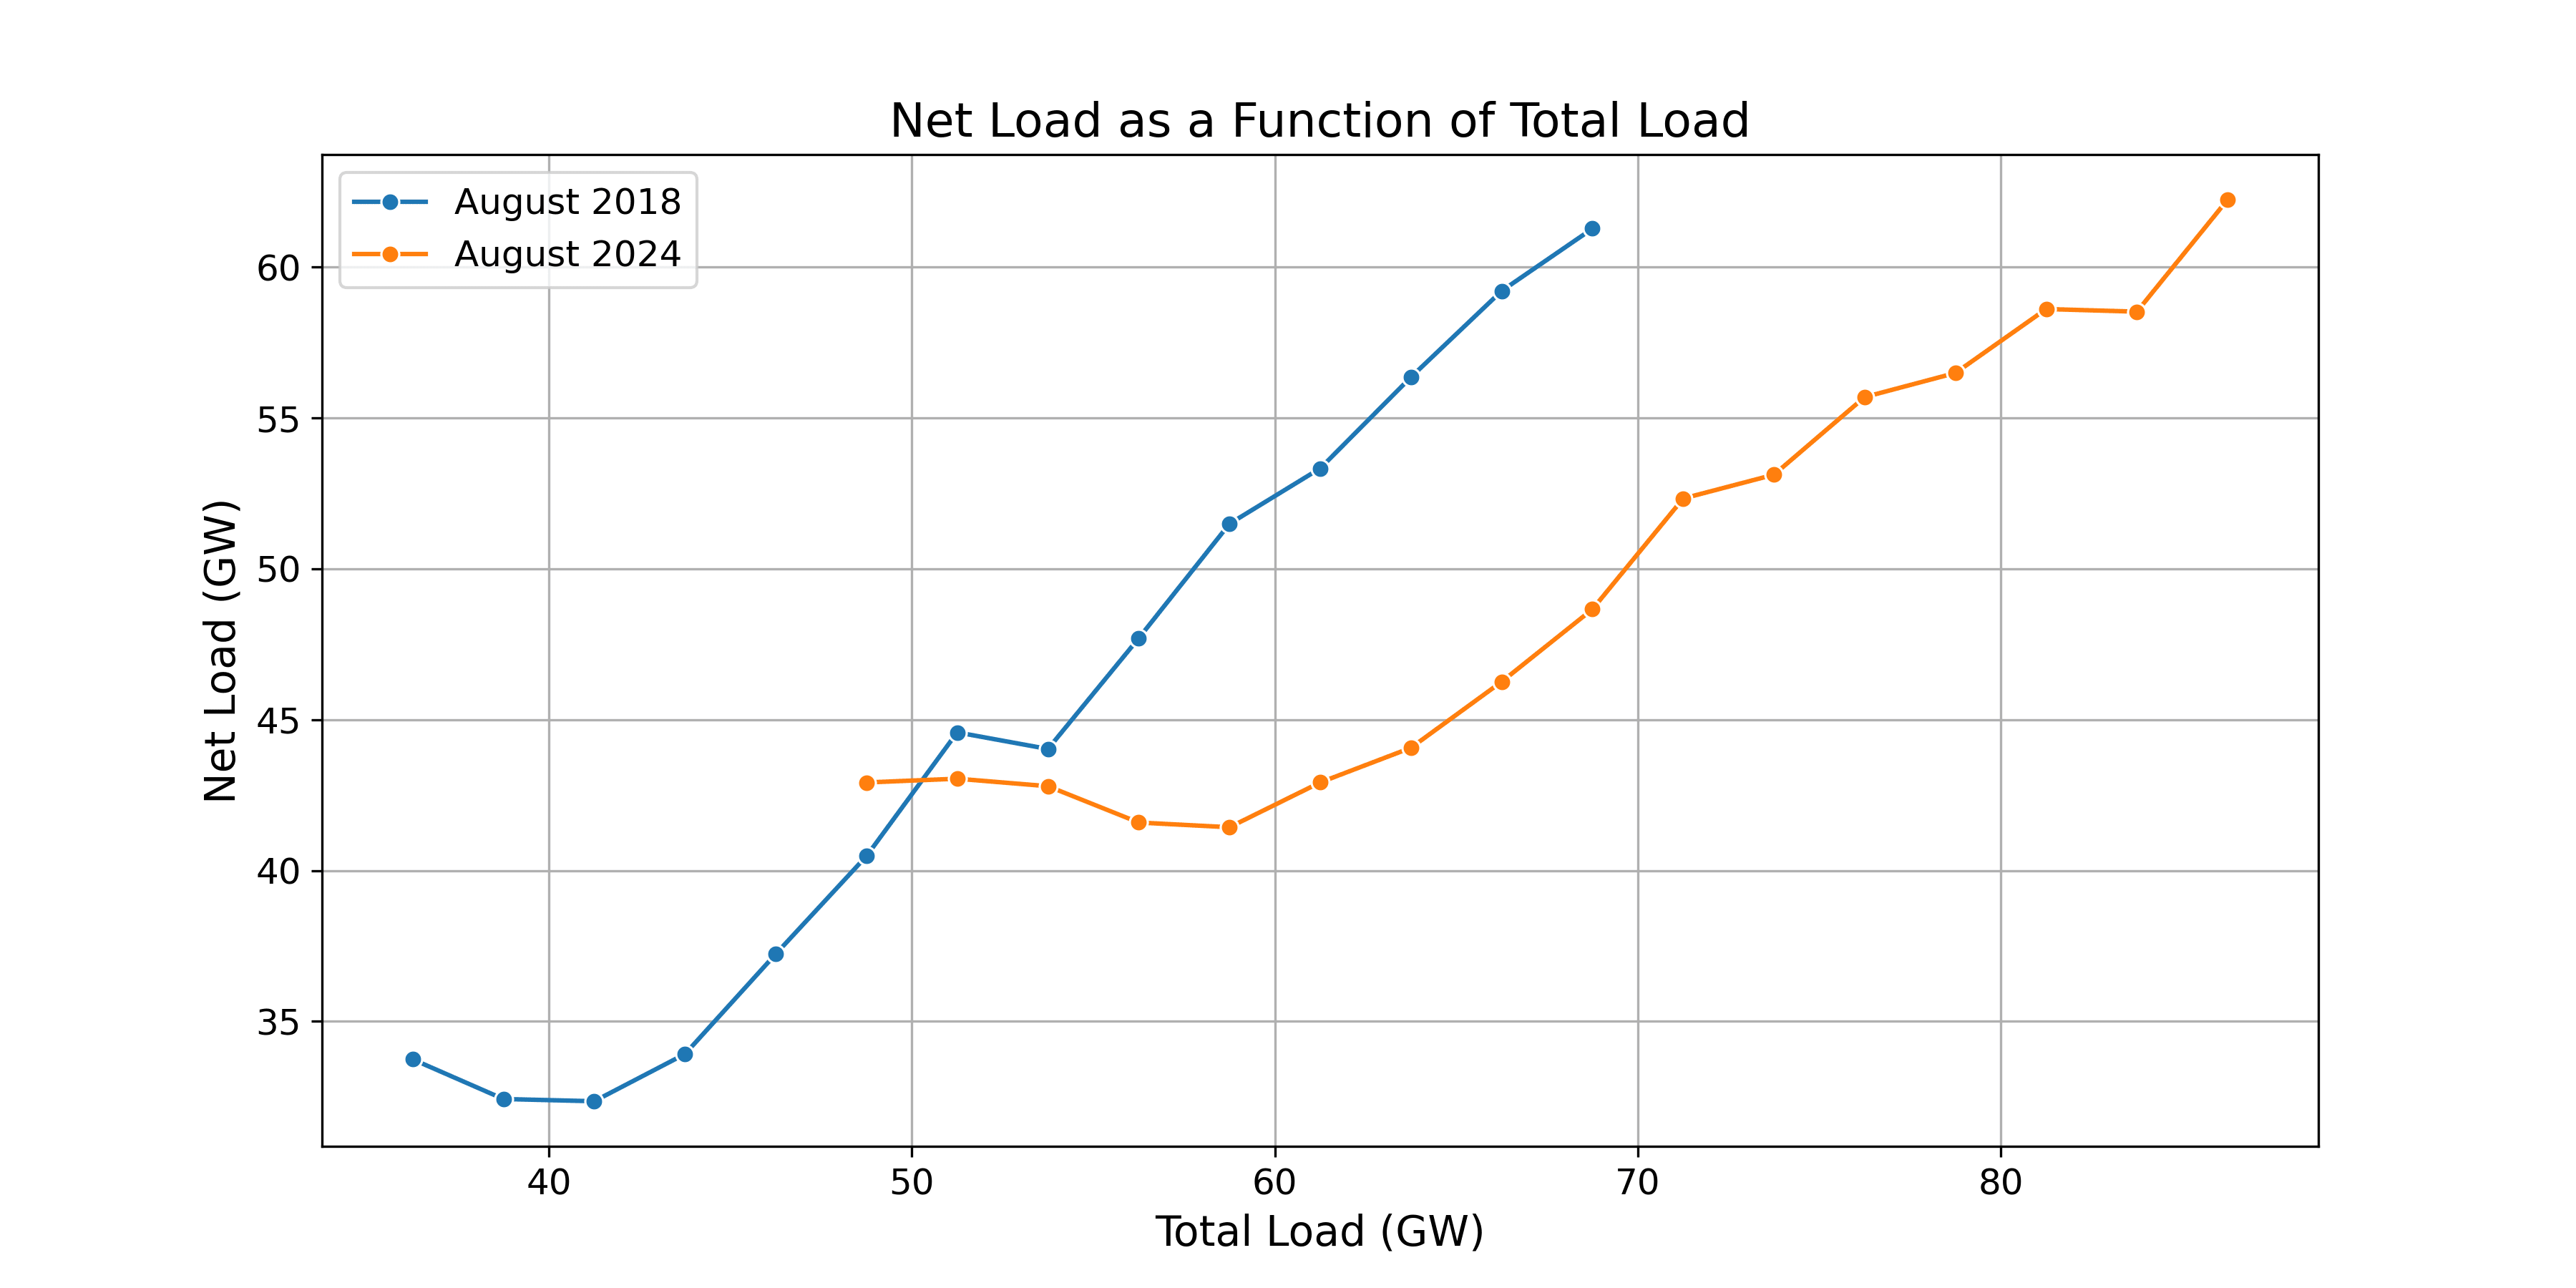
For 60 GW of total load, for example, Figure 3 shows that we needed 52 GW of fossil fuel-based electricity in 2018 but only 42 GW in 2024. This decrease in net load for 60 GW of total load was due to the rapid build-out of solar energy between these years.
We can now use these values of net load to determine the price of electricity. Using Figure 2, we see that 52 GW of net load leads to a cost of electricity of around $30/MWh, while 42 GW of net load corresponds to around $20/MWh.
In other words, the price of electricity for a total load of 60 GW is $30/MWh in 2018 and $20/MWh in 2024. These are close to the numbers you would get from the total load vs. price plot (Fig. 1).
The upshot: We can now explain why wholesale electricity was more expensive in 2018 than in 2024. The rapid build-out of solar power reduced the need for fossil fuel-based electricity in 2024. Since the price of electricity in Texas is set by how much fossil fuel-based electricity is required to satisfy demand, the solar energy build-out reduced the cost of electricity.
Using data directly provided by ERCOT, we can estimate the demand-weighted average price in August 2024: $39/MWh.
We can also calculate what the demand-weighted average price for 2024 would have been with the price-demand relationship for 2018 shown in Fig. 1. The details are in the appendix.
This provides us with a counterfactual estimate of what the average price would have been had we not built so much solar energy between 2018 and 2024: $55/MWh to $90/MWh.
These estimates are both much higher than 2024’s actual price, demonstrating how adding renewable energy, mainly solar, to the grid has reduced the cost of electricity in Texas.
So the next time someone tells you that renewables are expensive, show them the Texas data. With no growth in solar energy between 2018 and 2024, wholesale electricity prices in 2024 would have been at least 40% higher.
This isn't speculation or modeling — it’s what actually happened in one of America's largest electricity markets.
Appendix: How to calculate costs in 2024 using the 2018 price-demand relationship.
For hours when the total load was below 69 GW, we can simply use the relation in Fig. 1 to estimate the cost.
For hours with total load above 69 GW, we need to make an assumption for the price when demand exceeds the highest demand in 2018. To do this, we consider two alternative scenarios: 1) capped scenario: the price stays fixed at the maximum 2018 price (red dashed line), 2) extrapolation scenario: the price-load relation follows a linear extrapolation from the end of the line (purple dashed line):
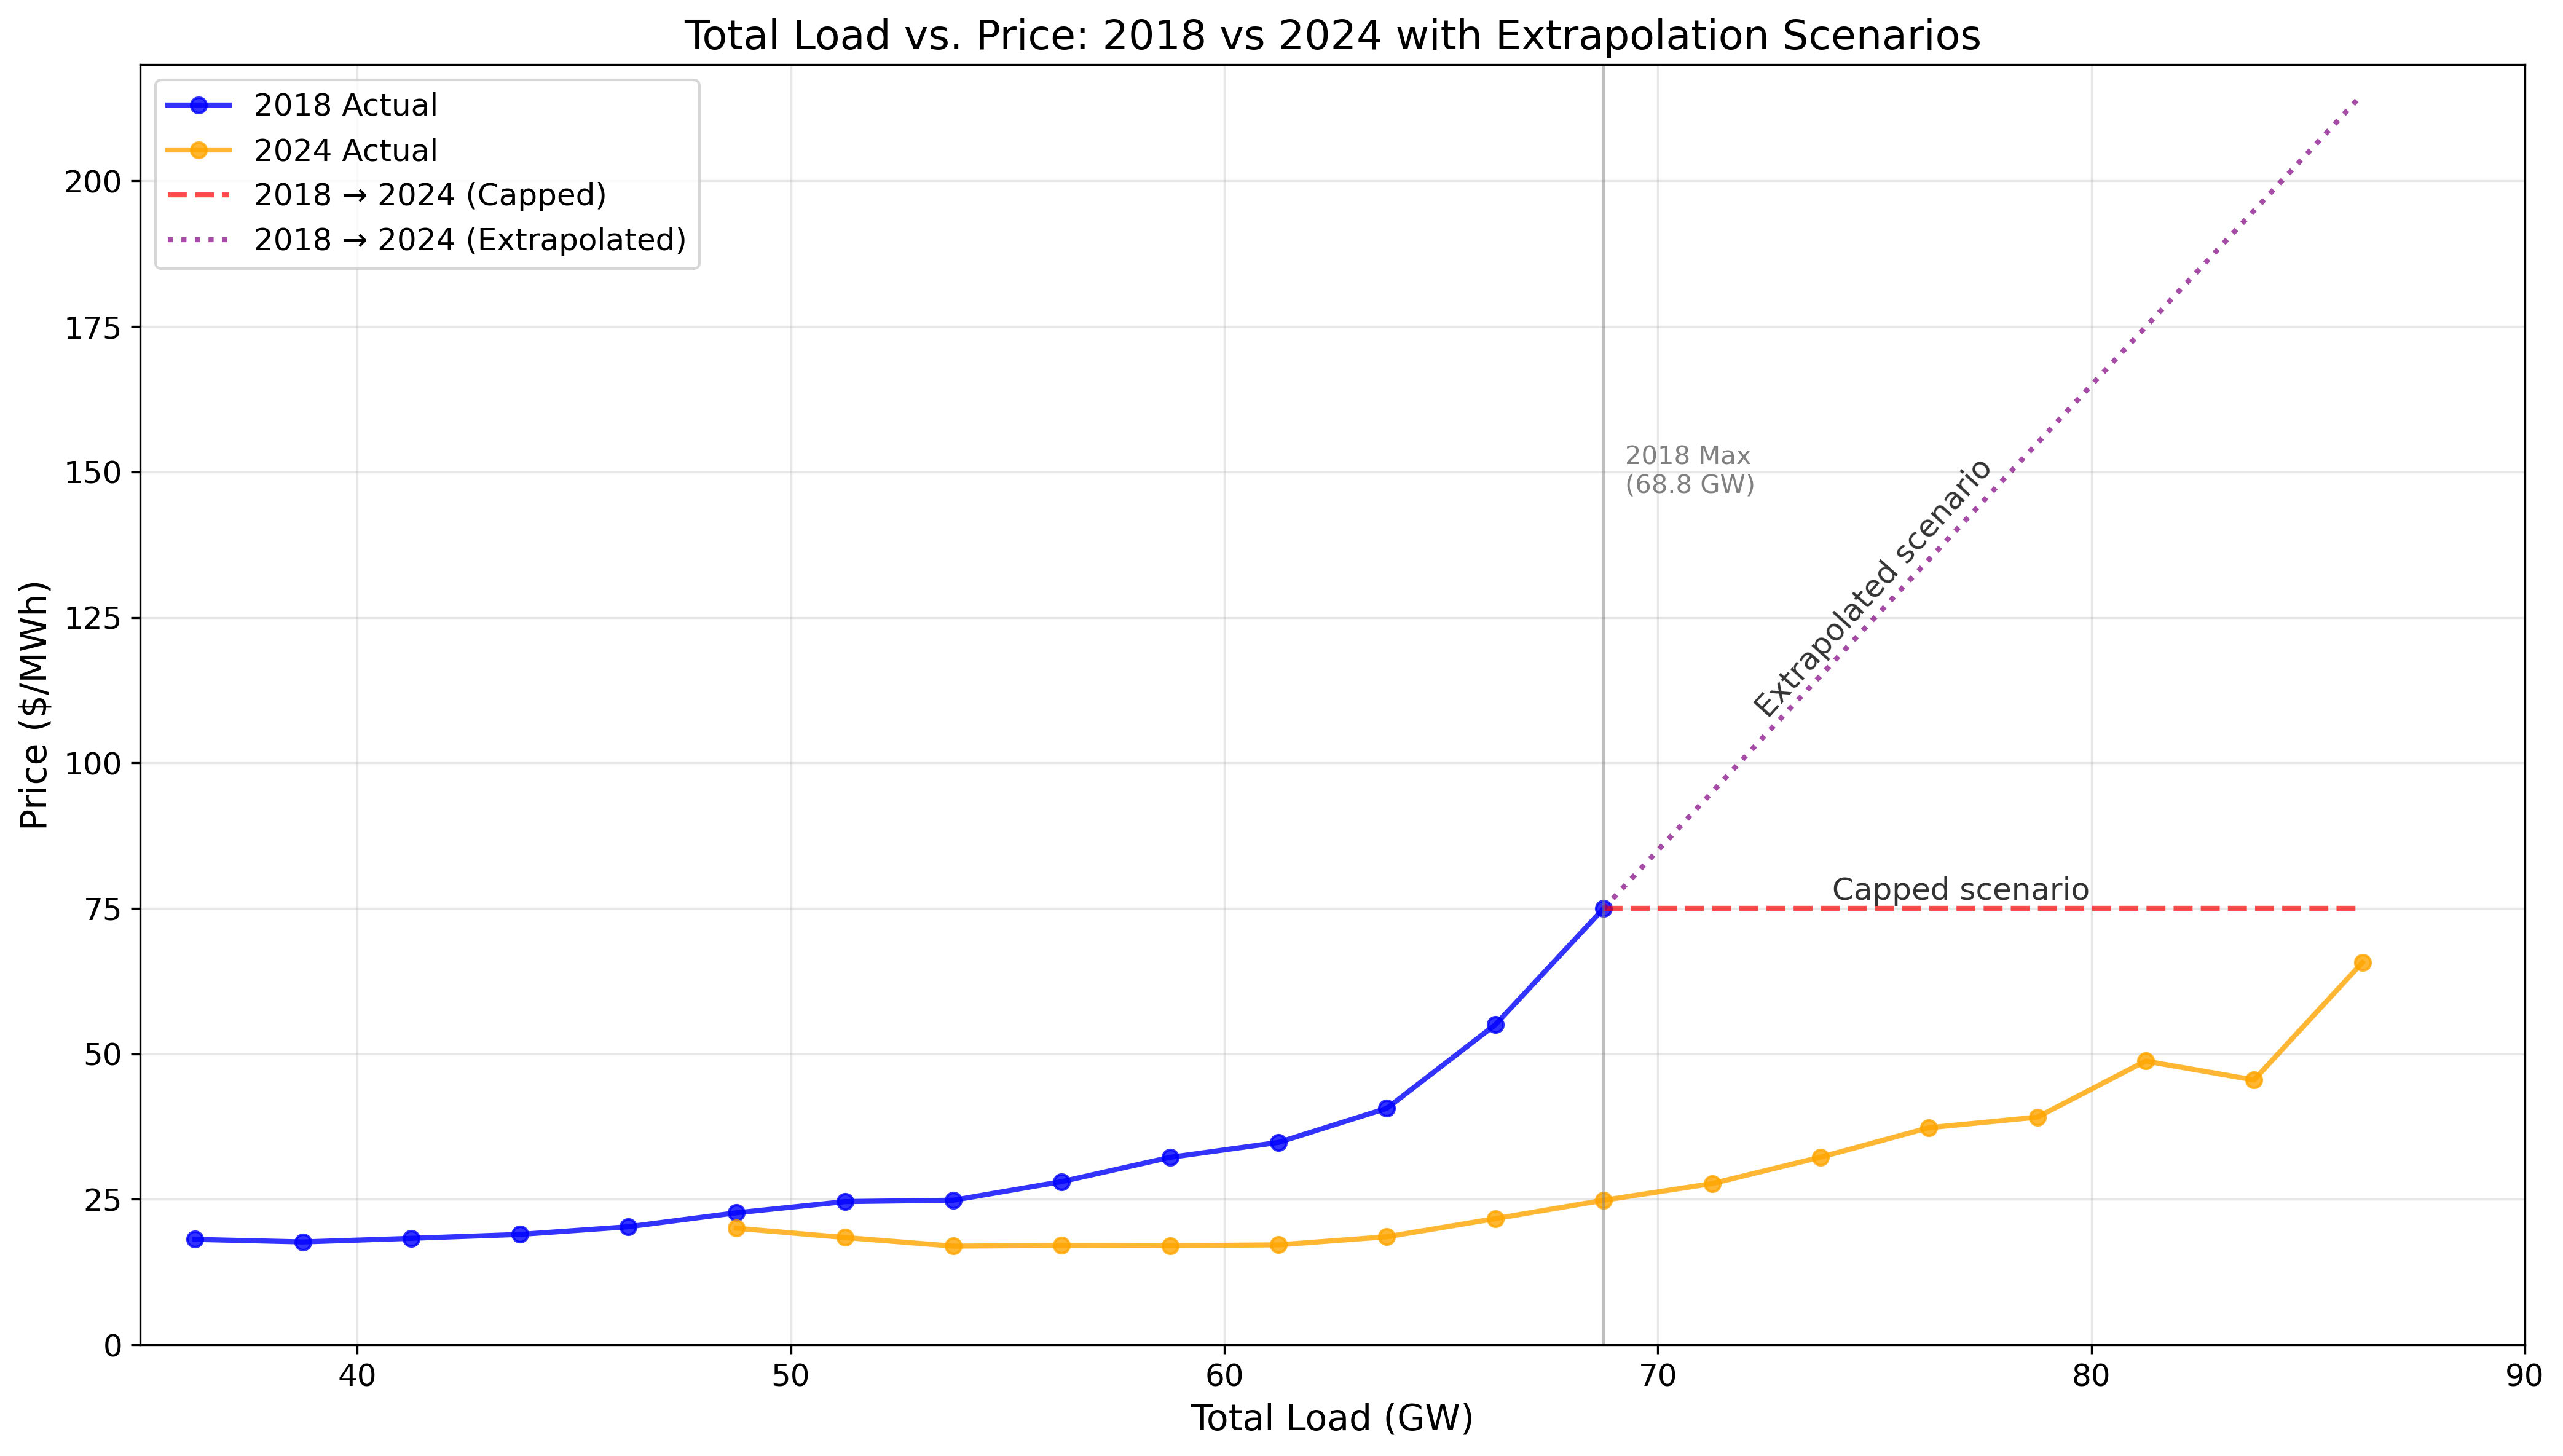
Once we have these two scenarios, we take hourly load from Aug. 2024 and use the curves in Fig. 4 to estimate the price for each hour. Then we can calculate the demand-weighted price.
The two scenarios yield demand weighted average prices of $55/MWh for the capped scenario and $90/MWh for the extrapolation scenario. These are both much higher than the actual price of electricity in 2024.
Renewables are saving money on the ERCOT grid today, which is mostly powered by fossil fuels (e.g., Texas is 30% renewable, with fossil fuels making up most of the rest). As I discussed here, adding renewables continues to reduce the cost of energy until renewables produce about 60% of power, then the costs begin rising again. So you cannot naively extrapolate these results to a 100% renewable grid.
What about subsidies for renewable energy? Certainly there are subsidies on both sides (yes, massive subsidies for fossil fuels, too) and it’s also clear that renewable subsidies in the 2000s and 2010s were responsible for the speed of the renewable build-out. Presently, however, subsidies for renewables are quite small. For example, see page 10 of this document. At this point, the main impact of subsidies is to speed up the deployment. Pro tip: anyone who talks about subsidies for renewables but studiously avoids talking about subsidies for fossil fuels should be ignored.
I’ve ignored the impact of ancillary services on the wholesale price of electricity. In some years (e.g., 2023), these services significantly increased the price of electricity. Given the good agreement between 2018 and 2024 in Fig. 2, this seems reasonable.
A completely different approach to this problem was used by Dr. Josh Rhodes a few years ago to estimate how much money was saved when renewable energy displaced expensive and dirty fossil fuel energy. The answer is a lot.
Here is Hannah Ritchie’s take on how renewables affect electricity prices.
Previous TCB posts:
An explanation of how renewable energy saves you money
Is renewable energy cheaper than fossil fuels?
No, renewables don’t need expensive backup power on today’s grids