.png)

One morning, Campsite was slow. Normally snappy interactions had loading spinners and delayed data.
Our observability tooling let us know it wasn’t just us, and it gave us some hints about what was happening.
- An Axiom monitor sent us a “high API request queue time” message via our Campsite integration. Web server processes were fully utilized, and requests were forced to wait.
- Fly.io metrics showed HTTP response times were significantly elevated, but didn’t show an increase in traffic.
- PlanetScale insights didn’t show any increase in database query latency.
The spikes in request queue times and response times lined up with a deploy, so with no better leads, we reverted the change, which had refactored how we transform rich text. Request queue times and response times returned to normal levels, and Campsite felt fast again.
A refactor
Campsite stores lots of rich text, including in posts, comments, messages, and call summaries. We store that rich text as HTML.
Before the PR that introduced the performance regression, we had a single PlainText class responsible for transforming HTML into plain text. Simplified, it looked something like this:
This served us well, but it was a little messy. The large and growing case statement was smelly to us. We had a new requirement coming — along with transforming content to plain text, we needed to transform content to Markdown.
We decided to refactor this code to a more object-oriented solution.
In our new approach, we had more, smaller classes that each focused on transforming particular node types. It became straightforward to share code between plain text and markdown outputs.
Each node class called a register_selector method that accepted a CSS selector string defining which elements the class should transform. In the snippet above, the HtmlTransform::Code class transforms nodes matching the CSS selector code.
We updated our tests to run against the new approach. With them passing, we deployed the change. Immediately after, we saw the performance regression.
Spelunking in flamegraphs
To figure out why the new code was slow, after the revert, we profiled it in development. We use rack-mini-profiler in development and production to profile Ruby code.
rack-mini-profiler works best out-of-the-box for traditional Rails applications that render HTML. Our Rails app primarily serves as an API for our client Next.js application, so it mostly renders JSON, but we still find rack-mini-profiler valuable. One way is with rack-mini-profiler’s built-in route that serves a blank page with a speed badge.
To debug this performance regression we started with flamegraphs, which rack-mini-profiler and stackprof generate.
We created a post with lots of elements in development. Then, we navigated to the GET post API endpoint and appended ?pp=flamegraph to the URL. We clicked “left heavy” so that identical stacks would be grouped together and we could easily see which method calls were taking up the most time.
We searched for HtmlTransform, and we found a call to plain_text that took close to 200ms and 40% of the total request time.
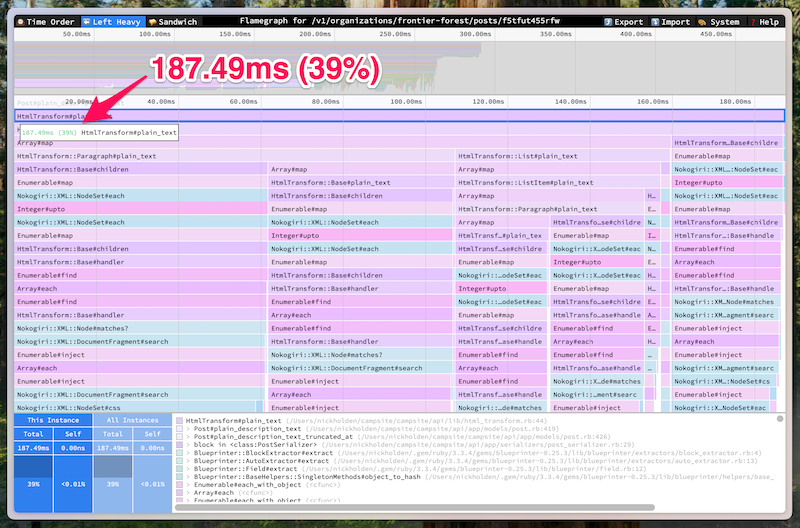
We sifted through the methods HtmlTransform#plain_text called. We figured our application code caused the performance regression, so we started looking for expensive methods that we explicitly called in our code.
The most suspicious calls were to Nokogiri::XML::Node#matches?. These were the calls furthest down the stack that we recognized from our code, and they accounted for nearly all of the time spent in HtmlTransform#plain_text.
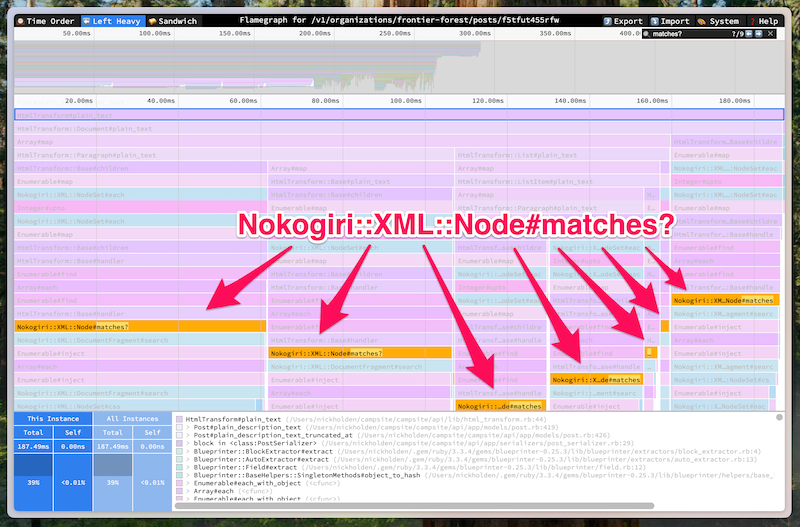
This was a change between our original implementation and the refactor. In the original version, our case statement compared node.name to strings. In the new version, we passed CSS selectors to node.matches?.
Removing suspicious method calls
To replace node.matches? in our refactored code, we introduced a new HANDLERS_BY_NODE_NAMES hash constant. Each key is a node name string and each value is a class inheriting from HtmlTransform::Base. Instead of calling node.matches? with a CSS selector, we look up HANDLERS_BY_NODE_NAMES[node.name].
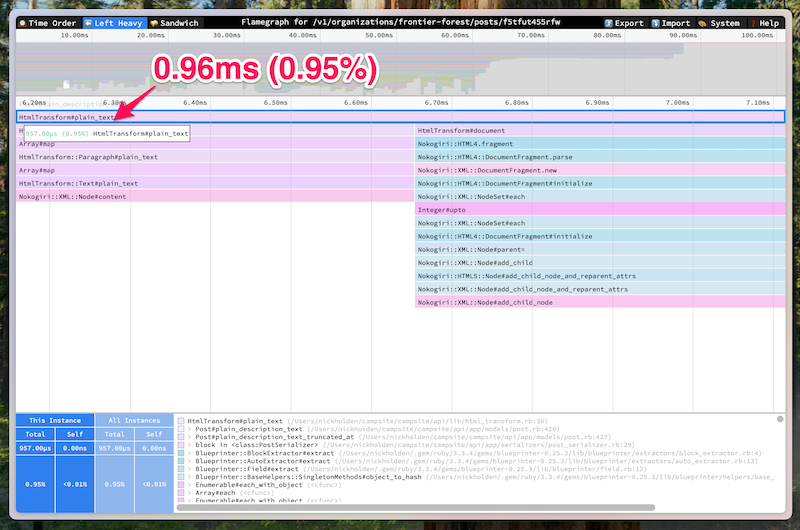
With the new code in place, the time spent in plain_text went from nearly 200ms and 40% of the total request time to under 1ms and less than 1% of the total request time.
Less work, faster code
Looking at the source, when you call Nokogiri::XML::Node#matches?, Nokogiri…
- Generates a list of ancestors for this node
- Picks the last ancestor and searches it for all of the descendants matching the CSS selector
- Checks if this node is included in the searched descendants
As we learned, that can get expensive when you do it many times in a web request. In our case, we could skip all the traversal and searching and only consider the node’s name.
With the new version of the refactor deployed, we continued to see snappy interactions in Campsite. We had a great new foundation for transforming rich text, and we had a renewed appreciation for profiling and flamegraphs.