.png)


One of my favorite novels is Michael Moorecock’s The Warhound and the World’s Pain. The book tells the story of Ulrik von Bek, a mercenary fighting during Europe’s 30 years war which devastated much of Europe and was responsible for approximately 8 million deaths. Ulrik gets separated from the company of soldiers he leaves finding a solitary castle where only a beautiful woman lives, Lady Sabrina. He stays at this castle and falls in love with the woman deciding that he wishes to stay for the rest of his days there. Eventually the castle’s master returns and Ulrik finds himself face to face with Lucifer, Lord of Darkness, Master of Hell. Lucifer agrees to allow Ulrik to take both possession of the castle and it’s Lady if Ulrik goes on a quest, the retrieval of the Holy Grail. After a number of adventures Ulrik succeeds, finding the Holy Grail close to the North Pole, guarded by Lilith, second wife of Adam. By releasing the Holy Grail, Ulrik also grants humanity access to all the knowledge and reason of the universe, bringing about the Enlightenment.
A couple years ago I won a grant from the Norwegian Research Council. The proposal I wrote was ambitiously titled “SerpRateAI: Constraining Peridotite Alteration Rates with AI and ML” and it promised, amongst other things to create a collection of machine learning models that could connect the various environmental processes that controlled how a particular type of rock called a “peridotite” absorbs CO2 (you can read more about one of these efforts here). This rock is common and found in outcrops in Oman, Norway, California, and elsewhere. Anything that naturally absorbs CO2 is interesting since if you can control that process you can begin to do something with all the CO2 we are pumping into the atmosphere. If you want to know more about that, you can ask Al Gore.

A central component to all this work was to listen to these rocks. The belief was that by listening to what is going on underground with these rocks and by characterizing those sounds by other, ongoing environmental processes, I would be able to quantify how much CO2 was naturally absorbed by these rocks and ultimately save the planet. In order to listen to these rocks, boreholes were dug into the rock, hydrophones were inserted at deeper and deeper locations in the rock, and these hydrophones listened at 1000Hz, rather low if you are an audiophile, for 9 months to try and “hear interesting stuff”. Additionally, 40 geophones were deployed on the surface for the last month of the 9 months.
You may already see that this introduces a difficult machine learning problem. We want to listen to the rocks for long periods of time and note whenever “something interesting” happens. Once we hear something we determine is interesting we then search for some physical mechanism to describe what we hear. But how do we determine if something is interesting? Essentially this becomes a search for a Holy Grail. How do you convince a computer to examine raw data and automatically decide what is interesting or not if you don’t give it any opinion about what is interesting, such as training data?
The first step is to simply look at the data.

Here we can see a spectrogram of an hours worth of data from one of the geophones. You can already see lots of interesting things. You can see these minutes long, broad band “explosions”, you can see these horizontal, narrow-band lines, you can see that there are some narrow band “gliding” motions, there is some kind of low frequency noise going on. This is all rather interesting and finding this in this data is promising. Perhaps we will know something more about this data set. Zooming into a few seconds of data (recall we are sampling 1000 times a second), you see this interesting “gliding” behavior that occurs at very short intervals.

So I set about to develop an algorithm that detects these kinds of events. The first thing you notice is that they are quite narrow band, although that band does seem to move around. And they do appear somewhat energetic. So I thought, perhaps this could simply threshold most of the stuff away, and since there is some structure to the things that are “interesting”, you could probably use some kind of sliding window to amplify everything in the image that is connected, and then arrive at some reduced version of the image with the “interesting” stuff as 1s and the non-interesting stuff as 0s.
But then I talked to a colleague and he said, oh but there are 40 geophones, don’t you remember? So we shouldn’t do this for only one geophone but only for things that appear across many geophones. So then we put together this stacked histogram based on whether some subset of geophones had all detected the same energy at the same frequencies at the same time. If this threshold was matched, we would then try to label those things. An example of this is below.

Here you can see all of the “pixels” that are showing up across some subset of geophones. There is already some interesting behavior here. You can see there are these horizontal lines at about 50Hz and 100Hz. You can see there are some smaller horizontal lines at other frequencies. You can see there is some gliding behavior where these narrow band signals increase in frequency between 50 and 100Hz. What is going on here? Is any of this interesting? Maybe. In discussion with colleagues there is some idea that this could be fluids and gasses moving in cracks underground. How do you verify that? Well, there are plenty of papers (for example) that talk about gas bubbling up on the surface in these regions with these kinds of rocks. So it is possible that is what we are hearing. Fluids moving through a crack can resemble some organ-pipe mode characteristics.
But for some reason I found all of this intellectually displeasing. Today, thinking back, if I had focused my efforts on finding interesting statistics in the labeled regions, perhaps I would have written a paper about something. At the time, I had used regionprops in skimage to labeled everything and tried to count up some statistics about the various things I found. But the statistics weren’t interesting. Everything just accumulated over time without any connection to other variables. Now that I think about it, I think there probably is some signal in the statistics. First, If you already see something interesting, continuing to investigate it typically leads to more interesting things. Second, if the entire data pipeline had been cleaned up a lot and focused on picking out some of the more interesting phenomena we would have statistics only about interesting things having filtered out all of the noise. However, at the time, I thought that developing the algorithm would benefit me in some way more than pursuing the scientific line of thought. I had verified there were interesting things in the data, but something in my mind said there must be some sort of more intellectually pleasing way of doing this verification.
If you are currently at this moment in your work, I will tell you now, THIS IS A TRAP. You will not find a more intellectually pleasing algorithm, you will not find some smoking gun, YOU ARE NOT GOING TO FIND A HOLY GRAIL. You will simply spin your wheels looking for something while you have something already sitting there that you have decided to throw aside. Get something done and delivered then move to the next step.

So instead of trying to build some working statistics from my cobbled together algorithm that mostly worked, I set that all aside and I decided to explore if I could arrive at this labeling without labeling (something I already had managed to implement!), by using UMAP and autoencoders to label everything in an unsupervised way. I decided that unsupervised labeling using autoencoders is very elegant. Autoencoders, in their simplest form, use a succession of convolutional layers that reduce in resolution per step and at the center, these layers create a reduced-dimensionality bottleneck layer in your neural network that can output a latent space that describes your data that you can then use some kind of clustering algorithm on. You would not be beholden to personal opinion or sway and you wouldn’t need to do intensive effort, you could simply take your magically perfect data, dump it on your magically perfect model, and it would give you magically perfect results. And you know what, the magic worked.
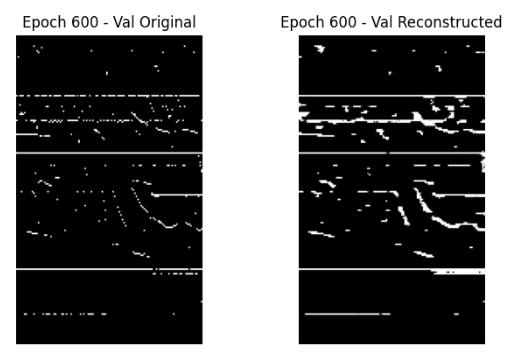
I worked with a summer intern student (who was brilliant and currently enrolled in law school) and developed an autoencoder model that could reconstruct the binarized spectrogram, it was doing a reasonable job of separating them into different classes using UMAP and was in fact doing so in ways that was somewhat better than I had done before, these classes had no physical meaning, but that didn’t matter. We were doing something elegant! And yet, we had arrived at the conclusion I already had arrived at. And ultimately, none of this work turned into any kind of deliverable like a paper or even a conference talk. Except now, I use it for fodder for my substack because I decided I must think about what happened and if it is possible to turn all this effort into a meaningful paper about something. The good news is that these ideas aren’t new and there are several options available to you if you want to try out similar libraries that are more mature. We may even try one or two in our endeavor to label everything. I am currently working with Karina Løviknes on this problem and we are actually getting somewhere (that’s a different post).
The problem here is, you can label anything you want. But you can’t describe what it is. I had, in some ways, inverted the original goal. Instead of trying to understand how these various systems interacted together, I had focused on instead developing methods that I found elegant to make observations of the data. But the data has already been collected. All of these additional analyses only verify what we already know, the data contains stuff that could be considered “interesting” by somebody. But because there had always been this nebulous goal “label interesting sounds” we arrived at a nebulous conclusion. And that is because there is no holy grail. There is no way that I can label everything and simultaneously determine what those labels mean without some kind of interpretation going on at some point. And that interpretation has to come from me.

Ultimately, I realized that this question of “how to label interesting things” is along the same lines people are asking about Artificial General Intelligence (AGI). AGI is what you were promised in Star Wars, a walking, talking anthropomorphized computer that can interact with you like a person, understand anything you give it, but also works the same way as a computer, so you can leverage that. An AGI could talk to you about your research ideas, then while you go make yourself a coffee, auto-generate 5000 lines of code to perform 10 different explorations, and deliver you a report to read before you discuss what to do next while simultaneously making stock trades in your portfolio. It could pilot your starship while also generating a holographic fantasy land for you to play in. It could do anything you can imagine and it can do it better than you ever can do it and it will do only at the expense of unlimited resources and unlimited energy. To be honest, I think that this is all ultimately possible. There is no reason to think with essentially unlimited resources we could build a computational engine that could do anything and be anything to anybody. But in my case, I didn’t find AGI. I found the things that I already knew were there hoping to find them in ever more elegant ways until one day my computer would be able to both listen to all my data and write all of my papers and reports while I sipped my coffee. So be wary when you search for elegance. Elegance will likely not find you a holy grail.

I hesitated pressing “submit” here since I basically am describing how I failed at something that I really wanted to make happen while realizing along the way that maybe it was a dumb idea to begin with. But I think that, ultimately, I’m not doing anyone favors talking only about when I succeed. Hopefully someone finds this interesting.