.png)

Introduction
Amidst increasing urban populations1, access to urban nature is imperative, supporting physical health, mental wellbeing, and improving nature connectedness2. Trees form a principal component of urban nature, providing ecosystem services that mitigate many of the negative effects of dense urban spaces3, including improving air quality4, moderating urban heat5, and reducing stormwater runoff6. Trees also benefit human health, improving physical and mental wellbeing7. Thus, trees are critical for the livability and sustainability of urban spaces.
While some ecosystem services of trees, such as carbon sequestration, may provide benefits across a large spatial scale, for most urban ecosystem services, the closer a person's proximity to a tree, the greater the benefits they receive from it8,9,10. For this reason, a growing number of studies consider if the spatial distribution of urban forests is equal (i.e., even) across a city11,12,13, ideally incorporating number, size, and taxonomic diversity across space to provide a fulsome understanding of where urban forests and their benefits are located. Because of the potential for distributional inequities (i.e., unfairness) for marginalized populations14, equity analyses are an important additional step to elucidate commonalities and differences in the distribution of trees in relation to sociodemographics12.
There are several measures that can be considered in assessing the distributional equality and equity of trees. One common, simple measure is the number of trees per unit area, referred to in this paper as the density of trees. Research has highlighted inequitable associations between tree density and income, population density, racial minority population proportions, and residential instability15,16,17,18. Distribution of trees can also be measured based on tree size, using either median diameter at breast height (DBH), describing the size of individual trees, or basal area, the cross-sectional trunk area calculated using DBH and summed for all trees within the plot19. Tree size has been found to be positively associated with income and disadvantaged subpopulations16,20,21, although there is variation by race21.
In addition to tree abundance and size, tree diversity is also a common concern of urban foresters22,23. Higher tree species diversity can reduce the relative vulnerability of an urban forest to pests and pathogens24 as areas lacking diversity can lose trees quickly under a pest outbreak25. Distributional diversity studies often focus on the “luxury effect”, where species diversity is higher in neighborhoods that are more affluent26 where residents have greater access to resources and political capital27. The luxury effect has been found in the distribution of urban tree species in North America and Europe15,28; however, contrasting effects have been found in Pakistan29, Beijing30, Chile31, and Australia32.
While there are numerous studies focusing on the spatial distribution of urban forests, most are limited to a single city or region. These single-city studies do not allow for inter-city comparisons that could provide crucial insights for understanding why urban forest inequities occur so frequently. Notable exceptions include Locke et al.13 and Volin et al.,33 each of which compares distributional equity in several cities; however, both studies exclusively use canopy cover as their measure of urban forest presence, which has generally low association with several of the ecosystem services urban forests provide34. Other studies that have compared distributional equality or equity across multiple cities used measures that include all vegetation35 and do not consider the size or diversity of trees. By including all vegetation, as often occurs with land cover-based studies, the specific benefits of trees versus shrubs and grasses are ignored36 and the urban forestry management unit (i.e., a tree) is obscured37. Additionally, by not considering the size or diversity of trees, many prior studies do not account for the positive relationship between tree size and ecosystem services38 nor the distribution of monocultures25, which influence the vulnerability of the urban forest to pests and pathogens24.
Our study addresses these gaps by assessing the spatial distribution of street trees in 32 Canadian cities (Fig. 1), examining tree density, size, and species diversity. In Canada, street trees are managed and maintained by municipal urban forestry departments. Unlike privately-owned trees, municipal governments can influence species selection, density, and maintenance, all of which collectively influence the distribution of tree density, size, and species diversity39. Previous localized research has found street trees to be unequally and inequitably distributed40,41,42, warranting a national-scale comparison of cities to identify consistencies and variabilities in distributional equality and their association with sociodemographics. Through this comparative analysis, we focus on two research questions: (1) Using the Gini Index, what are normative levels of distributional inequality in street tree count and basal area? and (2) Are there consistent associations between street tree density, size, and species diversity with population density and indices of deprivation?
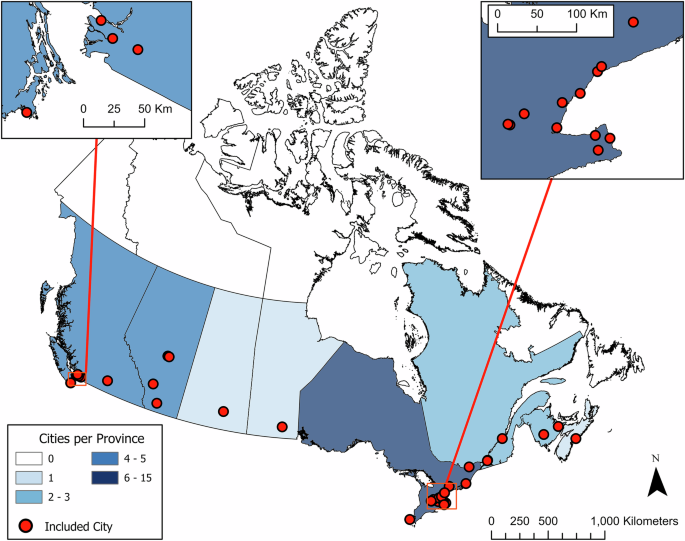
Red dots with black outlines indicate the study cities.
To examine potential inequities, we used population density and the four variables included in the Canadian Index of Multiple Deprivation (CIMD): i) residential instability, a measure of resident fluctuation, ii) economic dependency, a measure of a population’s reliance on the workforce, iii) ethno-cultural composition, a measure of immigrant and racialized group populations, and iv) situational vulnerability, a measure of additional demographic characteristics such as education levels and home ownership43.
For urban foresters, landscape planners, and allied professionals, this study benchmarks street tree distributional inequalities and inequities in Canada. This helps identify how one city compares to others through a quantitative measure of distributional inequality, calculated using the Gini Index, and the association of street tree distribution to sociodemographic variables. For researchers, this study highlights consistencies and variations in sociodemographic associations with - and distributional inequities in—street tree density, size, and species diversity. The study results identify issues with extrapolating locally identified associations to the national and international scale.
Results
Across the 32 Canadian cities examined in this study, street tree density ranged from as few as 183 trees per km2 in Kelowna, BC to 1283 trees per km2 in Vancouver, BC (median for all study cities (x͂) = 569 trees) (Fig. 2). Street tree density varied within and across the eight provinces included in the study. Median street tree DBH, an indicator of where larger trees are located, ranged from 8 cm in Ajax, ON to 35 cm in Regina, SK. Like street tree density, median DBH varied within and across provinces. Basal area of street trees per km2 of included census dissemination areas (DAs) ranged from 20.82 m2/km2 in Moncton, NB to 144.60 m2/km2 in Vancouver, BC (x͂ = 43 m2/km2). Cities closer to the Rocky Mountains and Atlantic Ocean generally had lower basal area.
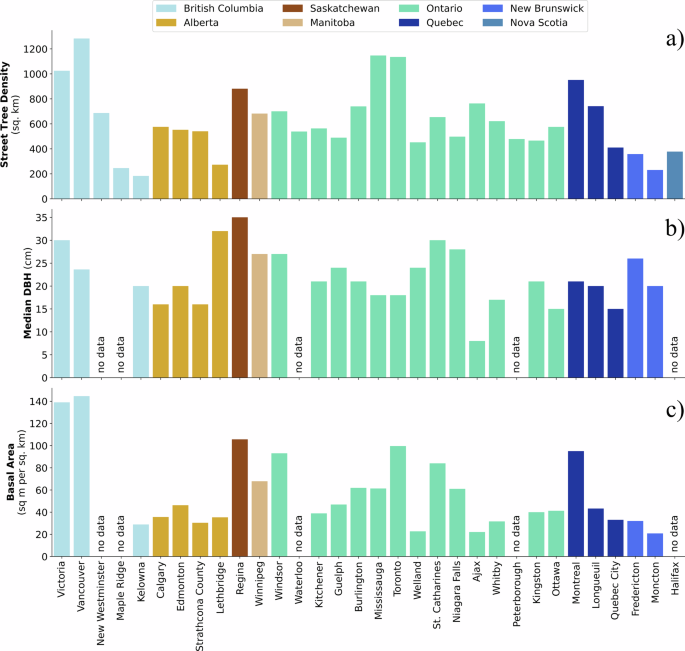
Street tree density (a) is reported for all cities. Median diameter at breast height (DBH) (b) and basal area (c) are reported for 27 study cities as five study cities did not collect DBH measurements.
Street tree species diversity was measured at the DA-level using Shannon’s Diversity Index (H). Typical H values range from 1, indicating low diversity, to 3.5, indicating high diversity44. When considering the median H across a city, species diversity ranged from 1.17 in Strathcona County, AB to 3.12 in Toronto, ON.
Presence of inequalities
Moderate distributional inequalities were present across the study cities, as indicated by the Gini Index (G). The Gini Index considers the cumulative distribution of a good (e.g., percent of street tree population) per a cumulative proportion of the population with Gini Index results from 0, indicating perfect equality, to 1, indicating perfect inequality45. Because the variables must be cumulative, we use raw counts (i.e., not standardized by land area) at the census dissemination area (DA) level.
Based on the Gini Index, the distribution of street tree count was most equal in Fredericton, NB (G = 0.259) and least equal in Maple Ridge, BC (G = 0.681). The median Gini Index for street tree count was 0.401 with quartiles one and three of 0.350 and 0.490, respectively. Showing greater levels of inequality, the distribution of street tree basal area was most equal in Windsor, ON (G = 0.324) and least equal in Lethbridge, AB (G = 0.709). The median Gini Index for street tree basal area was 0.469 with quartiles one and three of 0.417 and 0.532, respectively. The Gini Index values for each city for tree count and basal area are included in Supplementary Table 1.
Street tree density
Based on Lagrange multiplier (LM) tests, multivariate regressions for street tree density were best modelled with spatial lag models (SLM) in 19 cities and spatial error models (SEM) in 4 cities. Nine cities could not be fit to models. All but three cities had between two and five significant model terms (Fig. 3). Two of the three cities, Lethbridge, AB, and Longueuil, QB, had no significant associations between tree density and any sociodemographic variables. The third city, Maple Ridge, BC, had only one significant model term (situational vulnerability). The models for each city are included in Supplementary Table 2.
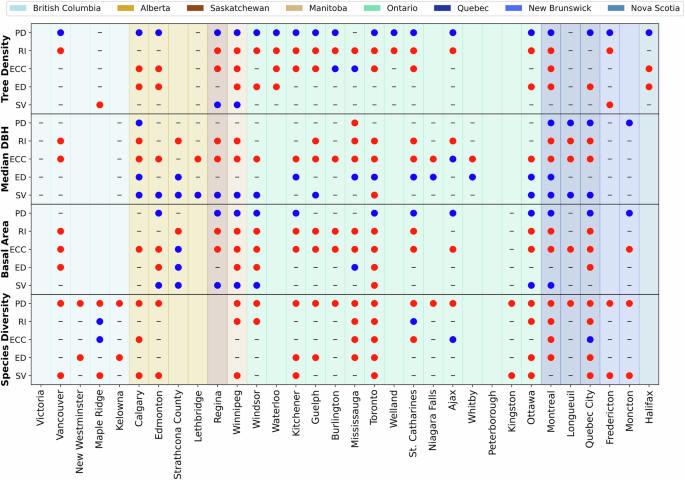
Blank cells indicate models that could not be fit, including cities without diameter at breast height (DBH) data. Census demographics are indicated by codes PD population density, RI residential instability, ECC ethno-cultural composition, ED economic dependency, and SV situational vulnerability.
In comparing the positive versus negative associations, population density was consistently positively associated with street tree density in 19 cities (Table 1, Fig. 3). Residential instability and economic dependency were consistently negatively associated with street tree density in 16 and nine cities, respectively. Ethno-cultural composition was negatively associated with street tree density in eleven cities but positively associated in Burlington and Mississauga, ON. Street tree density associations with situational vulnerability were sparse and varied, with two positive associations (Regina, SK, and Winnipeg, MB) and two negative associations (Maple Ridge, BC, and Fredericton, NB).
Apart from Mississauga, ON, every city with negative associations between residential instability and street tree density also had positive associations between population density and street tree density (Fig. 3). Two patterns—positive associations with population density and negative associations with residential instability—were present across the provinces of Ontario (n = 11), Manitoba (n = 1), and Saskatchewan (n = 1). No other census variables showed the same provincial patterns.
Street tree size
In evaluating street tree size, we considered two variables: median DBH, which is a proxy for where the largest trees are located, and basal area per km2, which is a proxy for the volume of trees and ecosystem services provided. Based on LM tests, median DBH was best modelled with SLM in 24 cities and SEM in one city—Quebec City, QC. Of the seven remaining cities, five did not collect DBH measurements, while models could not be fit for the sixth and seventh cities—Kingston and Welland, ON. Across the 25 cities where models could be fit, 20 cities had at least two significant model terms, two had one significant model term, and three cities had no significant associations between median DBH and any sociodemographic variables (Fig. 3). The models for each city are included in Supplementary Table 3.
In comparing the positive versus negative associations, residential instability was consistently negatively associated with median DBH, occurring in 13 cities, while economic dependency was consistently positively associated with median DBH, occurring in 10 cities (Table 1, Fig. 3). Ethno-cultural composition had the greatest number of significant associations. Median DBH was negatively associated with ethno-cultural composition in 19 cities but positively associated in Ajax, ON. Situational vulnerability had the opposite direction with twelve positive associations with median DBH and only one negative association (Toronto, ON). Population density had five positive associations and one negative association, totalling only six cities while 19 cities had non-significant associations.
Commonly, if situational vulnerability was positively associated with median DBH, ethno-cultural composition was also negatively associated with median DBH (n = 11) (Fig. 3). An exception to this was Toronto, ON where both were negatively associated. Provincial-level patterns were visible for median DBH. Across the prairie provinces (Alberta, Saskatchewan, Manitoba), situational vulnerability was consistently positive and ethno-cultural composition was negative (apart from Strathcona County, AB, which was non-significant). Ethno-cultural composition was almost consistently negatively associated with median DBH in Ontario. Quebec had the greatest consistency in significant associations, which held the pattern of greater median DBH in areas of higher population density and situational vulnerability but lower median DBH in areas of higher residential instability and ethno-cultural composition, indicative of distributional inequities.
Basal area was best modelled with SLM in 18 cities and SEM in two cities. Of the 12 remaining cities, five did not collect DBH measurements, and models could not be fit for the other seven cities. Across the 20 cities where models could be fit, 17 cities had at least two significant model terms, two had one significant model term, and only one city, Kingston, ON, had no significant associations between basal area and any sociodemographic variables (Fig. 3). The models for each city are included in Supplementary Table 4.
In comparing the positive versus negative associations, population density was consistently positively associated with basal area, occurring across 12 cities, while residential instability was consistently negatively associated with basal area, occurring across 14 cities (Table 1, Fig. 3). The three remaining variables had small inconsistencies in their patterns. Ethno-cultural composition was frequently negatively associated with basal area (n = 18) but positively associated in Strathcona County, AB. Economic dependency was typically negatively associated with basal area (n = 6), but positively associated in Strathcona County, AB, and Mississauga, ON. Lastly, situational vulnerability was often positively associated with basal area (n = 7), but negatively associated in Toronto, ON.
There were few consistent patterns across cities and provinces (Fig. 3). However, 13 cities had negative associations between basal area and both residential instability and ethno-cultural composition. Negative associations between basal area and residential instability and ethno-cultural composition were common for Saskatchewan, Manitoba, Ontario, and Quebec. Similarly, positive associations with basal area and population density were common for Saskatchewan, Manitoba, and Quebec.
Street tree species diversity
Street tree species diversity was best modelled by SLM in 14 cities, SEM in eight cities, and OLS in one city. Models could not be fit for the remaining nine cities. Across the 23 cities where models could be fit, 20 cities had at least two significant model terms, while three cities had only one significant model term. In contrast to the other three tree variables, no cities lacked significant association between species diversity and any sociodemographic variables (Fig. 3). The models for each city are included in Supplementary Table 5.
In comparing the positive versus negative associations, population density was universally negatively associated with species diversity, occurring across 23 cities with no city having a non-significant or negative result (Table 1, Fig. 3). Species diversity was also consistently negatively associated with economic dependency (n = 9) and situational vulnerability (n = 12). Species diversity was mixed in its association with residential instability and ethno-cultural composition. Residential instability was negatively associated with species diversity in seven cities but positively associated in two cities. Ethno-cultural composition was negatively associated with species diversity in five cities but positively associated in three cities.
Because of the many significant negative associations between species diversity and population density, the pattern was found across the country (Fig. 3). The only other identifiable pattern was the negative association between species diversity and situational vulnerability in New Brunswick.
Discussion
Through a national-level examination of Canadian urban tree inventories, we found inequalities in the distribution of street trees in all 32 study cities. Yet, despite the existence of these distributional inequalities, we found nuanced patterns in the association between street tree variables—density, size, and species diversity—and sociodemographic variables. Most cities displayed a combination of some inequitable and some non-significant associations between distribution of street tree density and size across different sociodemographic variables.
The Gini Indices identified in our study suggest varying levels of distributional equality exist across Canadian cities. While there are different interpretations of Gini Indices in urban greening, the general heuristic is that Gini Indices under 0.2 indicate equality, 0.2 to 0.3 indicate relative equality, 0.3 to 0.4 indicate relative fairness, 0.4 to 0.5 indicate concerning disparity, and above 0.5 indicate significant disparity46. None of the 32 cities had equal distributions of trees (i.e., > 0.2), although greater equality was found in the distribution of street trees by count than basal area. The most equal distribution was found in the street tree count of Fredericton, NB (G = 0.259), which could reflect the city’s low population and long history of proactive approaches to tree planting and management47. Conversely, the least equal distribution of street tree count was in Maple Ridge, BC (G = 0.681), which may be due to the city’s more diverse land use and recent rapid urban growth, which could limit opportunities for street tree establishment, or the prioritization of tree planting in parks and on private property48, which would not be reflected in our study of street trees.
There are limited comparable studies of the Gini Index for street trees. However, a canopy cover-based assessment of distributional equality in 40 US cities found Gini Indices ranging from 0.15 to 0.4733, indicating potentially greater distributional inequality in Canadian cities’ street tree populations. Similarly, when basal area is considered, inequalities in size distribution could reflect different stages of urban development or tree planting38. In some cases, a moderate Gini coefficient may even be preferable given that it could represent a larger diversity in tree sizes and thus a more resilient future urban forest20,49.
The Gini Index is solely a measure of equality and does not capture distributional inequities related to sociodemographics45. Therefore, we used multivariate regression to assess how DA-level sociodemographics were associated with street tree density, size, and species diversity. While all cities exhibit distributional inequalities in street tree measures, there are notable variations in sociodemographic associations both within and between cities. This variability underscores the complexity of urban tree equity and necessitates a nuanced exploration of intra- and inter-city comparisons.
Street tree density was frequently negatively associated with residential instability (a measure of resident fluctuation), ethno-cultural composition (a measure of immigrant and racialized group populations), and economic dependency (a measure of a population’s reliance on the workforce). A similar pattern was observed for median DBH and basal area with residential instability and ethno-cultural composition. These negative associations mean that as these three measures of deprivation—residential instability, ethno-cultural composition, and economic dependency—increase, tree density, median DBH, and basal area decrease. These are indicative of prevalent inequities that align with previous studies that identified income, race-, ethnicity-, and homeownership-based inequities in urban forest or street tree distribution11,40,50. The fact that there are consistent patterns at the provincial level for many of these inequities implies similar patterns of tree planting and land use planning that result in inequities.
In contrast to the other Canadian Index of Multiple Deprivation (CIMD) variables, inequitable associations were less frequent between situational vulnerability and tree density, with often non-significant associations, and tree size, which often has positive associations. In the case of positive associations, this means that as situational vulnerability increases, median DBH and, less commonly, basal area, also increase. This was surprising given that situational vulnerability includes median dollar value of the dwelling and education attainment43, which have previously been found to be associated with urban forest inequities51. Situational vulnerability also includes the proportion of the population that identifies as Indigenous43. Indigenous Peoples have been found to be under-engaged in urban forest management planning (an issue of recognitional inequity)52, but the positive associations for situational vulnerability suggest that distributional inequity is not as prevalent an issue as under-engagement. Interestingly, only one city, Mississauga, ON, displayed negative associations between population density and street tree density and size. The positive associations found in the other study cities may reflect common municipal goals to prioritize street tree planting and maintenance in residential areas53 and policies protecting street trees during development54.
In contrast to street tree density and size, street tree diversity was universally negatively associated with population density, likely due to challenging growing conditions in densely populated areas, limiting street tree species suitability25,55. Similarly, street tree diversity was often negatively associated with CIMD variables, perhaps reflecting differences in residents’ access to resources and political capital27 or underlying associations between CIMD variables and challenging growing sites, including areas with greater impervious surface area or air pollution25. Diversifying street tree species in these areas can help mitigate the potential impact of invasive pests and pathogens that would otherwise cause localized canopy cover loss and drive distributional inequalities due to streets being composed entirely of one genus42,56.
While there were consistencies in patterns of inequities, there were 10 instances where associations between tree variables and sociodemographic variables had both positive and negative associations (Fig. 3). For example, species diversity was positively associated with ethno-cultural composition in three cities, yet negatively associated in another five cities. Relatedly, there were several cities that deviated from otherwise consistent patterns of positive or negative associations. There were also few instances of patterns consistent across provinces or large regions like British Columbia’s Lower Mainland or Ontario’s Greater Golden Horseshoe. Further, there were seldom instances where one socio-demographic variable was generally negatively or positively associated across all four tree variables. Residential instability is the noteworthy exception with 50 negative associations across the four tree variables and only two positive associations (species diversity in Maple Ridge, BC and St. Catharines, ON).
The variation in associations between sociodemographics and street tree variables supports other multi-city studies that identify unique city-level patterns of distributional inequity of urban trees13,33,57,58. Given these differing patterns of inequity, researchers must be wary of extrapolating patterns of inequity observed in studies examining one or only a few cities. Distributional patterns of street tree density, size, and diversity are influenced by municipal socio-political and biophysical factors, both historical and current59,60,61. Considering these localized factors is important in interpreting distributional inequalities and inequities.
Because we specifically examined street trees, we quantified spatial distribution of a subset of the total tree population in Canadian cities. Private trees, park trees, and riparian vegetation can all contribute to canopy cover62; however, inventories of private, park, and riparian trees are not routinely collected63. Private trees are also subject to management based on the preference of homeowners, particularly in the absence of stringent legislation preventing unpermitted removal62. Testing our findings for other land use types may highlight counter relationships or alignment with street tree distributions. While ground-based inventories do not usually include privately-owned trees and sporadically include park and riparian trees, the increasing use of light detection and ranging (LiDAR) in urban environments will provide an opportunity to advance this research to include all trees within cities.
Urban tree inventories can also be subject to measurement error and incorrect species identification. While we removed trees with a DBH above 350 cm, which suggests measurement or recording errors, erroneous values under this threshold may influence the results49. However, urban forest managers must make decisions based on their inventories25, and this study uses the information available to managers in examining street tree distribution. Street trees represent an accessible source of urban nature and an asset that is provided and maintained by cities for the betterment of their residents39. With recent recommendations that people be able to see three trees from their residence10, street trees provide a means for cities to accomplish this imperative.
While trees provide many benefits for residents, some residents may not want trees near their homes64,65. Given such preferences, some residents may not be concerned about the lack of trees around their residence. Likewise, some may wish to have streets lined with the same species66, resulting in low local diversity. Others may prefer small ornamental street trees that result in a smaller median DBH67. Our study did not identify such preferences. Rather, we considered spatial distribution because equitable distribution of tree density, size, and diversity promotes equity in urban forest ecosystem services and sustainability8,9,10,24. Yet, urban forest equity does not simply mean that all streets or neighborhoods have the exact same assemblage of trees. Distributional justice is only the first step in creating an equitable urban forest68. Localized efforts to increase recognitional and procedural equity69, especially considering residents’ preferences for treed streets, will only further Canadian urban environmental justice.
Methods
Study cities, collection of inventories, and data cleaning
This study examined 32 Canadian cities (Fig. 1), all of which were part of the Canadian Institute of Forestry / Institut forestier du Canada (CIF-IFC) Open Urban Forests Project (OUFP) repository, which aims to include all street tree inventories across Canada70. The 32 cities span five ecozones71 and eight provinces, although nearly half were in Ontario (n = 15, 47%), which had 10 more cities than the second most common province, British Columbia (n = 5, 16%).
The OUFP repository does not include all variables collected in the inventories, so the inventory data were sourced directly from the open data catalogues of the cities themselves (Supplementary References 1). The inventories were downloaded on May 24th, 2024. Inventories were included if tree species identification (ID) or diameter at breast height (DBH) was available. In 28 inventories, both species ID and DBH were reported. Three inventories collected species ID but were excluded from DBH analyses because they lacked this measure (New Westminster, BC and Peterborough, ON) or collected DBH in ranked bins (Halifax, NS). We also excluded Maple Ridge, BC, and Waterloo, ON from the DBH analysis as DBH measurements were only collected for 9% and 63% of their street trees, respectively. Only one city’s available tree inventory (London, ON) contained neither variable, so it was excluded from this study. Another tree inventory identified in the OUFP repository (Markham, ON) only includes trees on major thoroughfares, so it was excluded from this study.
The downloaded inventories were cleaned, including removing dead trees and stumps, setting 0 cm DBH tree measurements to null, removing trees outside city limits, and removing non-street trees. Based on histograms of the DBH measures, an outlier threshold of 350 cm DBH was established per Martin et al.49. Any DBH measure above 350 cm was set to null. Diseased, dying, or trees in poor condition were not removed from the inventories. Trees with missing species identification were set to “unknown”.
There were 31 inventories that included both street and non-street trees. In 18 of them, non-street trees were identified in a variable that was used to subset inventories into those that only contained street trees. In the remaining 13 cities where non-street trees were not identified in the inventory itself, the proximity of trees to the city’s road network (Supplementary References 2) was used to isolate street trees following methodology used by Galle et al.72 While Galle et al.72 included all trees within a distance of two-times the lane width multiplied by the number of lanes based on road centerlines, we used a larger catchment area. This was largely owing to many Canadian residential streets that are classified as one lane of traffic (i.e., one lane in either direction), but have room for three or more car widths (e.g., parking plus one lane in either direction), thus a larger buffer area from the road centerline is required. To account for parking, in the four cities with road data that included lane counts, the street tree catchment was set as four meters times the number of lanes plus 12 meters, measured from the centerline. For the remaining nine cities without lane count data, a catchment area of 20 meters from the centerline was used, equivalent to a two-lane roadway. Because no inventory included privately owned trees, the main source of error was potential inclusion of park trees that border streets. The proportion of street trees to total inventoried tree count is similar between the column-based and street buffer-based methods at 72.48% and 75.01%, respectively, suggesting the catchment method is appropriate.
Measurements of trees
This study examines four measurements common to urban forestry: tree density (number of trees per square kilometer), median DBH, basal area per square kilometer, and Shannon’s Diversity Index. Each of these measurements was calculated per dissemination area (DA), the smallest spatial unit of the Canadian Census for which data is routinely reported by Statistics Canada.
Tree density was calculated as the number of trees per DA, divided by the size of the DA in square kilometers. Median DBH was calculated in centimeters for each DA. Basal area was calculated by converting the DBH measurements to a circular area for each tree (cm2), then summing across the DA and dividing by the size of the DA. The Shannon’s Diversity Index was calculated for species diversity measures because it includes both richness and evenness and better accounts for rare or underrepresented species than the similar Simpson’s Index72. Given the high portion of exotic species in urban areas, many tree species may be represented by only a few individuals37.
Dissemination areas and census variables
Human demographic associations with urban trees were analyzed within DAs. DAs have populations of 400–700 people73. DA boundaries are delineated by physical landscape features (e.g., rivers, major streets) and are informed by local experts to be sociodemographically homogenous73. While some studies have used the larger Census Tracts (CTs), smaller municipalities in our study had too few CTs to conduct meaningful analyses. In cities surrounded by rural areas, such as in the prairie and Atlantic regions of Canada, CTs also cover low population density agricultural or exurban spaces within the city boundaries. Thus, the use of DAs, above a population density minimum, more accurately reflects urban tree distribution in Canadian cities.
In our study, DAs were included if they were within the cities’ boundaries and had population densities above 400 people per square kilometer. This minimum threshold is based on Statistics Canada’s classification of urban areas74 and excluded agricultural and exurban areas.
Population density and the Canadian Index of Multiple Deprivation (CIMD) by DA were used to assess the sociodemographic correlates of street tree metrics. The CIMD, developed by Statistics Canada to provide a longitudinal measure of Canadian marginalization using 2021 census data, provides four indicators of population marginalization at the DA level: i) residential instability, which measures fluctuations in neighborhood residents, ii) economic dependency, which addresses a population’s reliance on the workforce, iii) ethno-cultural composition, which measures the immigrant and visible minority populations, and iv) situational vulnerability, which describes additional demographic characteristics such as education levels and home value43. All indicators were assessed as factor scores, where higher values indicate higher levels of marginalization. The national-scale CIMD values, which use the same variables across all cities for each of the four indicators, were used for all cities. The CIMD was chosen to represent these metrics of marginalization because its breadth allows for comparisons to a wide range of existing studies on urban forest equity, and representation as factors allows for the incorporation of many census variables without introducing multicollinearity issues into multivariate analyses. The CIMD was downloaded on April 4, 2025. We supplemented the CIMD variables with population density (people per square kilometer) as a proxy for built density, which may limit space for street trees.
Statistical analyses
To examine the distributional equality within each city, the Gini Index was used. The Gini Index was originally developed as a measure of income inequality but has since been employed in examining the distribution of hospitals, grocery stores, parks, and trees45. Its primary benefit is its simplicity, measuring the proportion of the asset—in this case, trees—available to a proportion of the population which is divided into groups—in this case, DAs. The tree count and basal area per DA were sorted in ascending order for each city and the Gini Index (G) was calculated using the equation
$$G=1-\frac{{\sum }_{i=1}^{n}\left({P}_{i}-{P}_{i-1}\right){E}_{i}}{n{\sum }_{i=1}^{n}{E}_{i}}$$
(1)
where Ei is the cumulative proportion of the city’s trees up to the ith DA, Pi is the cumulative proportion of the population up to the ith DA, and n is the number of DAs within the city's boundary. The Gini Index (G) is bound by 0 ≤ G ≤ 1 with values closer to 0 indicating no inequality and 1 indicating complete inequality.
Linear regression models were estimated using ordinary least square (OLS) to assess the relationship between street tree measurements and sociodemographic variables. The validity of each model was assessed, including for the presence of multicollinearity, heteroskedasticity, and non-normal distribution of model error terms. When heteroskedasticity or non-normally distributed error terms were present, spatial autoregressive (SAR) models—namely spatial lag (SLM) and error (SEM) models—were used75. SLMs incorporate a spatially lagged dependent variable (WY) to account for instances where the dependent variable in one DA is influenced by the dependent variable in neighboring DAs76,77. The general form is
$$Y=X\beta +\rho {WY}+\varepsilon$$
(2)
where Y is the vector of dependent variables, X is the vector of explanatory variables, β is the vector of regression coefficients, ρ is the spatial lag coefficient, W is the spatial weights matrix, and ε is the vector of independently distributed error terms.
By contrast, SEMs incorporate a spatially lagged error term (Wu) to account for spatial dependence in the error terms77, capturing unobserved spatial processes not captured in model variables. The general form is
where Y is the vector of dependent variables, X is the vector of explanatory variables, β is the vector of regression coefficients, and u is the vector of spatially correlated error terms, calculated with the formula
$$u=\lambda {Wu}+\varepsilon$$
(4)
where λ is the spatial error coefficient, W is the spatial weights matrix, u is the vector of spatially correlated error terms, and ε is the vector of independent error terms.
First order queen contiguity was used in the SAR modelling, and Lagrange multiplier (LM) lag and error tests were used to determine whether SLM or SEM should be used77. When only one LM value was significant, the applicable SAR model was applied. Where both LM tests were significant, the robust LM tests and their magnitude were used to select the model. In cases where neither robust test statistics were significant, the model was reassessed at the OLS level for fit issues78. All multivariate analyses, including spatial structure assessment and modelling, were done in R 4.4.079.
In 36 models, associating each street tree variable with sociodemographic variables could not be modelled using OLS, SLM, or SEM. These models exhibited issues with heteroskedasticity or non-normally distributed residuals, and the corresponding SAR models were not statistically significant. Variable transformations were explored, but did not address model fit issues. To avoid compromising interpretability through more complex or iterative model specifications, these models were omitted from the results, which present the remaining 91 models.
Data availability
Tree inventory data will be provided upon reasonable request to the corresponding author.
References
United Nations. World urbanization prospects: the 2018 revision. (United Nations Department of Economic and Social Affairs: Population Division, 2019).
Dunn, R. R., Gavin, M. C., Sanchez, M. C. & Solomon, J. N. The pigeon paradox: Dependence of global conservation on urban nature. Conserv. Biol. 20, 1814–1816 (2006).
Turner-Skoff, J. B. & Cavender, N. The benefits of trees for livable and sustainable communities. Plants People Planet 1, 323–335 (2019).
Nowak, D. J., Crane, D. E. & Stevens, J. C. Air pollution removal by urban trees and shrubs in the United States. Urban For. Urban Green. 4, 115–123 (2006).
Ziter, C. D., Pedersen, E. J., Kucharik, C. J. & Turner, M. G. Scale-dependent interactions between tree canopy cover and impervious surfaces reduce daytime urban heat during summer. Proc. Natl. Acad. Sci. USA 116, 7575–7580 (2019).
Carlyle-Moses, D. E., Livesley, S., Baptista, M. D., Thom, J. & Szota, C. in Forest-Water Interactions (eds Delphis F. Levia et al.) 397–432 (Springer International Publishing, 2020).
Wolf, K. L. et al. Urban trees and human health: a scoping review. Int. J. Environ. Res. Public Health 17 https://doi.org/10.3390/ijerph17124371 (2020).
Ulmer, J. M. et al. Multiple health benefits of urban tree canopy: the mounting evidence for a green prescription. Health Place 42, 54–62 (2016).
Browning, M. & Lee, K. Within what distance does “greenness” best predict physical health? A systematic review of articles with GIS buffer analyses across the lifespan. Int. J. Environ. Res. Public Health 14 https://doi.org/10.3390/ijerph14070675 (2017).
Browning, M. H. E. M. et al. Measuring the 3-30-300 rule to help cities meet nature access thresholds. Sci. Total Environ. 907, 167739 (2024).
Gerrish, E. & Watkins, S. L. The relationship between urban forests and income: a meta-analysis. Landsc. Urban Plan. 170, 293–308 (2018).
Nesbitt, L., Meitner, M. J., Sheppard, S. R. J. & Girling, C. The dimensions of urban green equity: a framework for analysis. Urban For. Urban Green. 34, 240–248 (2018).
Locke, D. H. et al. Residential housing segregation and urban tree canopy in 37 US Cities. npj Urban Sustain. 1, 15 (2021).
Nesbitt, L., Meitner, M. J., Girling, C., Sheppard, S. R. J. & Lu, Y. H. Who has access to urban vegetation? A spatial analysis of distributional green equity in 10 US cities. Landsc. Urban Plan. 181, 51–79 (2019).
Avolio, M. et al. Tree diversity in southern California’s urban forest: the interacting roles of social and environmental variables. Front. Ecol. Evol. 3 https://doi.org/10.3389/fevo.2015.00073 (2015).
Anderson, E. C., Locke, D. H., Pickett, S. T. A. & LaDeau, S. L. Just street trees? Street trees increase local biodiversity and biomass in higher income, denser neighborhoods. Ecosphere 14, e4389 (2023).
Nelson, J. R., Grubesic, T. H., Miller, J. A. & Chamberlain, A. W. The equity of tree distribution in the most ruthlessly hot city in the United States: Phoenix, Arizona. Urban For. Urban Green. 59, 127016 (2021).
Fleming, A. & Steenberg, J. The equity of urban forest change and frequency in Toronto, ON. Urban For. Urban Green. 90, 128153 (2023).
Bond, J. Best Management Practices—Tree Inventories. 2 edn, (International Society of Arboriculture, 2013).
Lin, J., Wang, Q. & Li, X. Socioeconomic and spatial inequalities of street tree abundance, species diversity, and size structure in New York City. Landsc. Urban Plan. 206, 103992 (2021).
Lin, J. & Wang, Q. Are street tree inequalities growing or diminishing over time? The inequity remediation potential of the MillionTreesNYC initiative. J. Environ. Manag. 285, 112207 (2021).
Ma, B. et al. An assessment of street tree diversity: findings and implications in the United States. Urban For. Urban Green. 56, 126826 (2020).
Alvey, A. A. Promoting and preserving biodiversity in the urban forest. Urban For. Urban Green. 5, 195–201 (2006).
Lacan, I. & McBride, J. R. Pest Vulnerability Matrix (PVM): a graphic model for assessing the interaction between tree species diversity and urban forest susceptibility to insects and diseases. Urban For. Urban Green. 7, 291–300 (2008).
Martin, A. J. F. Potential impacts of the invasive Agrilus planipennis on various demographics in Winnipeg, Canada. Trees For. People 9, 100307 (2022).
Leong, M., Dunn, R. R. & Trautwein, M. D. Biodiversity and socioeconomics in the city: a review of the luxury effect. Biol. Lett. 14 https://doi.org/10.1098/rsbl.2018.0082 (2018).
Aznarez, C. et al. Luxury and legacy effects on urban biodiversity, vegetation cover and ecosystem services. npj Urban Sustain. 3, 47 (2023).
Clarke, L. W., Jenerette, G. D. & Davila, A. The luxury of vegetation and the legacy of tree biodiversity in Los Angeles, CA. Landsc. Urban Plan. 116, 48–59 (2013).
Shams, Z. I. et al. Town socio-economic status and road width determine street tree density and diversity in Karachi, Pakistan. Urban For. Urban Green. 47, 126473 (2020).
Jiao, M. et al. Tree abundance, diversity and their driving and indicative factors in Beijing’s residential areas. Ecol. Indic. 125, 107462 (2021).
Guevara, B. R., Uribe, S. V., de la Maza, C. L. & Villaseñor, N. R. Socioeconomic disparities in urban forest diversity and structure in green areas of Santiago de Chile. Plants 13, 1841 (2024).
Threlfall, C. G., Gunn, L. D., Davern, M. & Kendal, D. Beyond the luxury effect: Individual and structural drivers lead to ‘urban forest inequity’ in public street trees in Melbourne, Australia. Landsc. Urban Plan. 218, 104311 (2022).
Volin, E. et al. Assessing macro-scale patterns in urban tree canopy and inequality. Urban For. Urban Green. 55, 126818 (2020).
Felipe-Lucia, M. R. et al. Multiple forest attributes underpin the supply of multiple ecosystem services. Nat. Commun. 9, 4839 (2018).
Quinton, J., Nesbitt, L. & Czekajlo, A. Wealthy, educated, and… non-millennial? Variable patterns of distributional inequity in 31 Canadian cities. Landsc. Urban Plan. 227, 104535 (2022).
Robinson, S. L. & Lundholm, J. T. Ecosystem services provided by urban spontaneous vegetation. Urban Ecosyst. 15, 545–557 (2012).
Conway, T. M. & Bourne, K. S. A comparison of neighborhood characteristics related to canopy cover, stem density and species richness in an urban forest. Landsc. Urban Plan. 113, 10–18 (2013).
Morgenroth, J., Nowak, D. J. & Koeser, A. K. DBH distributions in America’s urban forests—an overview of structural diversity. Forests 11, 135 (2020).
Miller, R. W., Hauer, R. J. & Werner, L. P. Urban forestry: planning and managing urban greenspace. 3 edn, (Waveland Press, Inc., 2015).
Landry, S. M. & Chakraborty, J. Street trees and equity: evaluating the spatial distribution of an urban amenity. Environ. Plan. A Econ. Space 41, 2651–2670 (2009).
Landry, F., Dupras, J. & Messier, C. Convergence of urban forest and socio-economic indicators of resilience: a study of environmental inequality in four major cities in eastern Canada. Landsc. Urban Plan. 202, 103856 (2020).
Martin, A. J. F. & Conway, T. M. Invasive pests and pathogens as potential drivers of urban forest distributional inequalities and inequities. Urban For. Urban Green. 128671 https://doi.org/10.1016/j.ufug.2025.128671 (2025).
Statistics Canada. The Canadian Index of Multiple Deprivation: User Guide, 2021. (Statistics Canada, 2024).
Magurran, A. E. Ecological diversity and its measurement. (Chapman and Hall, 1988).
Martin, A. J. F. & Conway, T. M. Using the Gini Index to quantify urban green inequality: A systematic review and recommended reporting standards. Landsc. Urban Plan. 254, 105231 (2025).
Zhao, W. et al. The multi-scale spatial heterogeneity of ecosystem services’ supply-demand matching and its influencing factors on urban green space in China. Forests 14, 2091 (2023).
Steeves, A. Fredericton Tree Commission: 2019 and 2020 Annual Reports. (Fredericton Tree Commission, 2020).
City of Maple Ridge. Urban Forest Management Plan. (City of Maple Ridge, 2024).
Martin, A. J. F. et al. The structural diversity of Canada’s urban forests: a national summary and an analysis of street tree size across Ecozones, City Sizes, and Within Cities. J. For. https://doi.org/10.1007/s44392-025-00011-6 (2025).
Watkins, S. L. & Gerrish, E. The relationship between urban forests and race: a meta-analysis. J. Environ. Manag. 209, 152–168 (2018).
Landry, S. & Pu, R. The impact of land development regulation on residential tree cover: An empirical evaluation using high-resolution IKONOS imagery. Landsc. Urban Plan. 94, 94–104 (2010).
Martin, A. J. F. et al. History, engagement, and visibility of Indigenous Peoples in urban forest management plans from Canada and the United States. Environ. Sci. Policy 166, 104026 (2025).
Miller, R. W., Hauer, R. J. & Werner, L. P. Urban forestry: planning and managing urban greenspaces. 3rd Ed. edn, (Waveland Press, Inc., 2015).
Martin, A. J. F., Fleming, A. & Conway, T. Protecting trees in the urban forest: a systematic review of literature on acts, bylaws, ordinances, and regulations. Environ. Rev. https://doi.org/10.1139/er-2024-0118 (2025).
Roman, L. A. & Eisenman, T. S. in The Politics of Street Trees (eds J. Woudstra & C. Allen) 83-96 (Routledge, 2022).
Greene, C. S. & Millward, A. A. The legacy of past tree planting decisions for a city confronting emerald ash borer (Agrilus planipennis) invasion. Front. Ecol. Evol. 4 https://doi.org/10.3389/fevo.2016.00027 (2016).
Riley, C. B. & Gardiner, M. M. Examining the distributional equity of urban tree canopy cover and ecosystem services across United States cities. Plos One 15, e0228499 (2020).
Guo, J., Liu, Z. & Zhu, X. X. Assessing the macro-scale patterns of urban tree canopy cover in Brazil using high-resolution remote sensing images. Sustain. Cities Soc. 100, 105003 (2024).
Roman, L. A. et al. Human and biophysical legacies shape contemporary urban forests: a literature synthesis. Urban For. Urban Green. 31, 157–168 (2018).
Hilbert, D. R. et al. Conceptualizing the human drivers of low tree diversity in planted urban landscapes. Ambio 52, 1532–1542 (2023).
Hilbert, D. R. et al. Development practices and ordinances predict inter-city variation in Florida urban tree canopy coverage. Landsc. Urban Plan. 190, 103603 (2019).
Daniel, C., Morrison, T. H. & Phinn, S. The governance of private residential land in cities and spatial effects on tree cover. Environ. Sci. Policy 62, 79–89 (2016).
Ma, B. et al. A global basis of urban tree inventories: What comes first the inventory or the program. Urban For. Urban Greening 60 https://doi.org/10.1016/j.ufug.2021.127087 (2021).
Pearsall, H. et al. Barriers to resident participation in tree-planting initiatives across a metropolitan area. Urban For. Urban Green. 95, 128326 (2024).
Carmichael, C. E. & McDonough, M. H. Community stories: explaining resistance to street tree-planting programs in Detroit, Michigan, USA. Soc. Nat. Resour. 32, 588–605 (2019).
Plant, L. & Kendal, D. Toward urban forest diversity: resident tolerance for mixtures of tree species within streets. Arboric. Urban For. 45, 41 (2019).
Dilley, J. & Wolf, K. L. Homeowner interactions with residential trees in urban areas. Arboric. Urban For. 39, 267 (2013).
Grant, A., Edge, S., Millward, A. A., Roman, L. A. & Teelucksingh, C. Centering community perspectives to advance recognitional justice for sustainable cities: lessons from urban forest practice. Sustainability 16, 4915 (2024).
Grant, A., Millward, A. A. & Edge, S. Pursuit of environmental justice in urban forest planning and practice. Front. Sustain. Cities 5 https://doi.org/10.3389/frsc.2023.1233878 (2023).
Canadian Institute of Forestry/Institut forestier du Canada. (2024).
Natural Resources Canada. (ed Government of Canada) (2010).
Galle, N. J. et al. Mapping the diversity of street tree inventories across eight cities internationally using open data. Urban For. Urban Green. 61, 127099 (2021).
Statistics Canada. In: Dictionary, Census of Population, 2021 (ed Statistics Canada) (Statistics Canada, Ottawa, ON, 2021).
Statistics Canada. Urban and rural areas - ‘Urban’ versus ‘rural’ variant, <https://www23.statcan.gc.ca/imdb/p3VD.pl?Function=getVD&TVD=113331&CVD=113332&CLV=0&MLV=2&D=1&adm=0&dis=0> (2019).
Chi, G. & Zhu, J. Spatial regression models for demographic analysis. Popul. Res. Policy Rev. 27, 17–42 (2008).
Elhorst, J. P. Applied spatial econometrics: raising the bar. Spat. Econ. Anal. 5, 9–28 (2010).
Anselin, L. & Rey, S. Properties of tests for spatial dependence in linear regression models. Geogr. Anal. 23, 112–131 (1991).
Anselin, L. Local indicators of spatial association—LISA. Geogr. Anal. 27, 93–115 (1995).
The R Project for Statistical Computing (2022).
Ethics declarations
Competing interests
The authors declare no competing interests.
Additional information
Publisher’s note Springer Nature remains neutral with regard to jurisdictional claims in published maps and institutional affiliations.
Supplementary information
Rights and permissions
Open Access This article is licensed under a Creative Commons Attribution 4.0 International License, which permits use, sharing, adaptation, distribution and reproduction in any medium or format, as long as you give appropriate credit to the original author(s) and the source, provide a link to the Creative Commons licence, and indicate if changes were made. The images or other third party material in this article are included in the article’s Creative Commons licence, unless indicated otherwise in a credit line to the material. If material is not included in the article’s Creative Commons licence and your intended use is not permitted by statutory regulation or exceeds the permitted use, you will need to obtain permission directly from the copyright holder. To view a copy of this licence, visit http://creativecommons.org/licenses/by/4.0/.
About this article
Cite this article
Martin, A.J.F., Fleming, A. & Conway, T.M. Distributional inequities in tree density, size, and species diversity in 32 Canadian cities. npj Urban Sustain 5, 18 (2025). https://doi.org/10.1038/s42949-025-00210-2
Received: 12 November 2024
Accepted: 19 April 2025
Published: 03 May 2025
DOI: https://doi.org/10.1038/s42949-025-00210-2