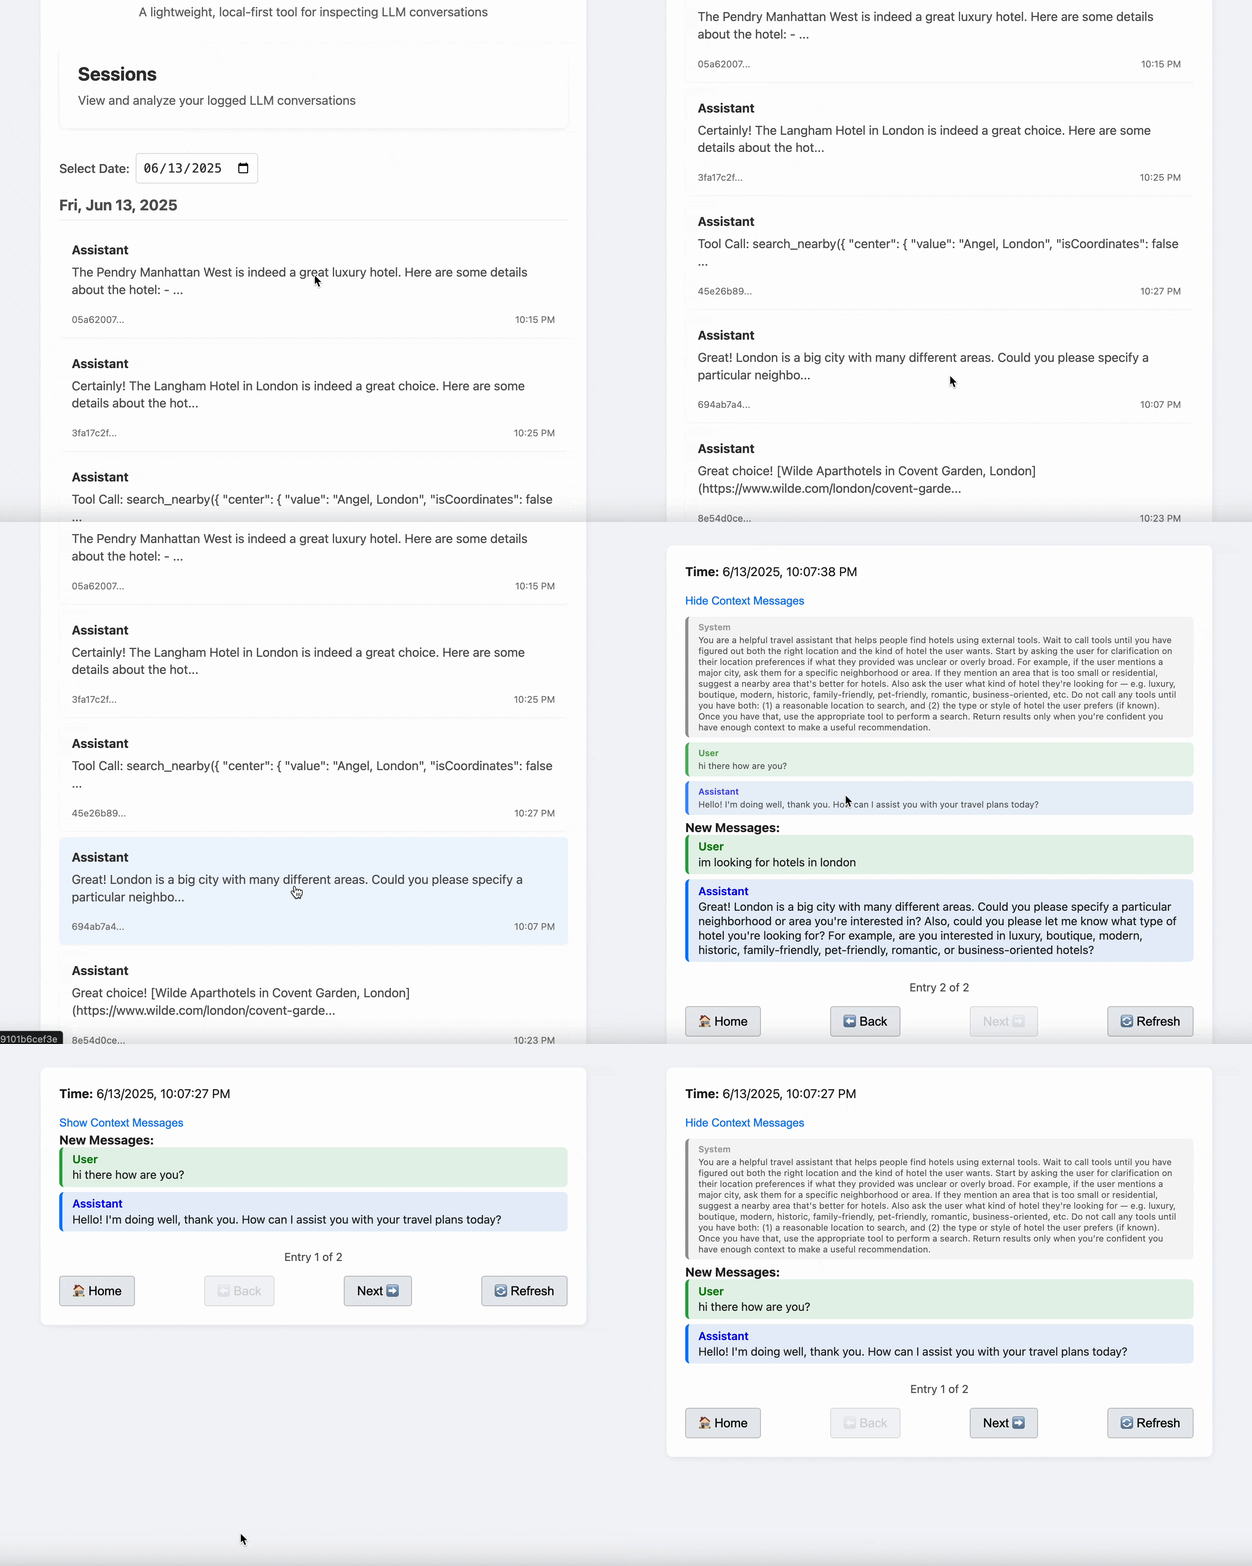
LLM Logger is a lightweight, local-first tool for inspecting and understanding how your application interacts with large language models like OpenAI GPT-4.
It helps you:
- Log and inspect each model call with request/response metadata
- View differences between turns in a conversation
- Visualize tool calls, tool responses, and system prompts
- Compare prompt strategies and debug session behavior
Ideal for developers building agent workflows, chat interfaces, or prompt-based systems.
- ⚡ One-line setup – Start logging with a simple wrapper around your OpenAI client
- 🧠 Automatic session tracking – No manual session IDs or state management required
- 📀 Local-first logging – Stores structured logs as JSON on your machine
- 🔍 Rich session insights – Context diffs, tool call/response blocks, and system prompt visibility
- ⏱️ Latency + metadata capture – Track timing, models, and more with every call
- 🧹 Framework-agnostic – Works with any Python codebase
- 🛡️ Privacy-first – Fully offline, no account or server required
- 🌐 Simple UI – Static frontend served locally; no build step needed for end users
- 👐 Open source (MIT) – Lightweight, auditable, and easy to extend
Currently supports:
- ✅ OpenAI (openai.ChatCompletion and openai.Completion APIs)
Planned:
- ⏳ Anthropic Claude (anthropic Python SDK)
Want Anthropic support soon? Upvote or open an issue here.
Install the prebuilt package:
Clone the repository and install:
Note: All installation methods include pre-compiled frontend files. No Node.js or frontend build steps are required for basic usage. The static files (HTML, CSS, JS) are packaged with the library, so the debugger UI works out of the box.
Rebuilding using npm install and npx tsc are required to update the .js files in the static/ folder
If you want to modify the logger or UI code:
-
Prerequisites:
- Python ≥ 3.8
- Node.js & npm (only needed for UI development)
-
Setup:
git clone https://github.com/akhalsa/llm_debugger.git cd llm_debugger # Optional: Create a virtual environment python3 -m venv venv source venv/bin/activate # Install in development mode pip install -e . -
Frontend Development (only if modifying the UI):
cd llm_logger/front_end npm install npx tsc -
To Build And Upload To Pypi: Note: Build Front End Locally FIRST
rm -r dist python3 -m build twine upload dist/*
Then use openai_client as normal:
Logs are written to .llm_logger/logs/.
This option is ideal for viewing logs from an application running on your local device
Then open in your browser:
You can run the debugger UI alongside your application if you're using a python webapp
Same Process (this example uses FastAPI but you can do something similar from any python webapp framework):
You can run both your own app and the log viewer in one container, using any process manager or framework you prefer. (Be sure to expose two ports)
Example Dockerfile:
🔁 Not using uvicorn?
Replace uvicorn your_app_module:app --host 0.0.0.0 --port 5000 with whatever launches your app — it could be Flask, Gunicorn, a background service, or anything else.
Each conversation is uniquely identified by creating a SHA-256 hash of its normalized messages, truncated to 12 characters for readability.
The system detects conversation continuity by searching for prefix matches - checking if earlier parts of the conversation were seen before.
New conversations get a UUID-based static ID, while continuations inherit the ID from their prefix. Log files are organized by date and session ID.
Two JSON files maintain session continuity across application restarts:
- message_hashes.json: Maps message hashes to static IDs and log paths
- static_id_file_lookup.json: Maps static IDs to log file paths
When logging an API call, the system resolves the thread ID and includes it in the log entry, maintaining the conversation thread.
- Zero configuration: No manual session tracking required
- Stateless operation: Compatible with serverless architectures
- Deterministic identification: Reliable conversation fingerprinting
- Restart resilience: Maintains context across application restarts
- Replay conversation with inline visualization
- Claude and other model support
- UI analytics and filters
- Exportable reports and session sharing
- Plugin hooks and configuration options
Found a bug or have a feature request? Open an issue.
MIT
.png)


