.png)

Main
Cancer is one of the most puzzling and lethal challenges of modern medicine. In the United States alone, over 2,000,000 people are estimated to be diagnosed with cancer, and roughly 600,000 will succumb to cancer each year1. Even though multiple molecular targets have been discovered2,3,4, the lack of a comprehensive understanding of the pathophysiological mechanisms that govern disease lethality remains one of the major factors that limit the life expectancy of patients with cancer5,6.
Currently, clinical metastases are considered the ultimate event in tumor progression7,8,9,10,11,12,13,14. However, a recent population-based study15, which included over 4.5 million people, highlighted a higher risk of developing cardiovascular events (for example, pulmonary embolism, acute myocardial infarction and stroke) in participants with any cancer type compared to individuals with nonmalignant illnesses. These data expand upon a robust body of evidence16,17,18,19 linking disease progression to functional alterations of the cardiovascular system20.
In this study, we hypothesized that the colonization of cancer cells within the wall and inside the lumen of large vessels, echoed by an increased number of both single and clustered circulating tumor cells (CTCs) immediately before death, might be events associated with high mortality. We also postulated that radiological evidence of macrovascular involvement could be detectable during tumor progression and could serve as a prognostic marker in patients with carcinomas.
Altogether, our work aims to shed light on the pathophysiological mechanisms underlying carcinoma lethality, identify patients at high risk of poor outcomes, irrespective of their metastatic status, and facilitate the development of new therapeutic strategies designed to improve both survival and quality of life in patients with solid malignancies.
Results
Estimating the concordance of the cause of death in patients with cancer among an assorted panel of medical professionals
To estimate the consensus regarding the tumor-related events that render cancer incompatible with life, we first assessed the agreement among a diverse panel of medical professionals on the primary cause of death in patients with cancer. To this end, we analyzed 108 patients (age > 18 years) with solid tumors, no evidence of immunosuppression, and documented clinical autopsy reports, all of whom died at University of Texas Southwestern Medical Center (UTSW) due to tumor-related complications (Table 1, Fig. 1a and Supplementary Table 1). The overall concordance among medical professionals on their cause of death was surprisingly low: a unanimous consensus was attained in only 16% of cases, while three or more professionals disagreed on the ultimate cause of death in most patients (51%; Fig. 1b and Supplementary Fig. 1). Despite the heterogeneity among panelists, which may have contributed to the observed disagreement, this finding emphasizes the need for a more comprehensive understanding of end-of-life events in patients with advanced solid malignancies.
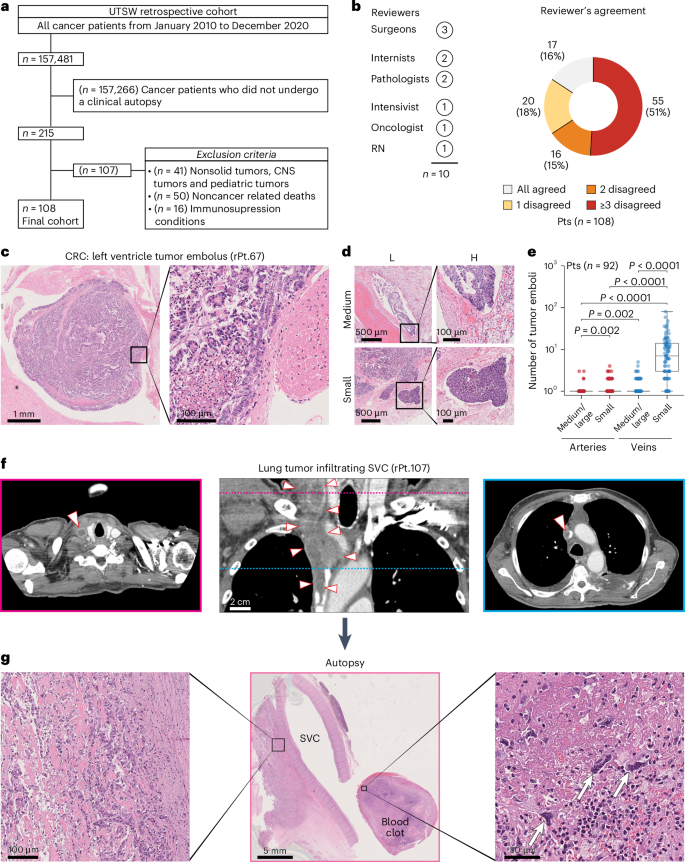
a, The image shows inclusion and exclusion criteria to select patients with a cancer diagnosis who died of cancer-related complications at UTSW from January 2010 to December 2020 and underwent a clinical autopsy. b, The image shows a pie chart displaying the agreement among the ten medical professionals (indicated as ‘Reviewers’, left panel) who independently reviewed the patients in the UTSW retrospective cohort and determined their cause of death. c, The image shows representative H&E images of a tumor embolus (low and high magnification) with organized tumor cells adhering to the left ventricle wall taken from a patient with CRC. Scale bars = 1 mm (left) and 100 µm (right). d, The image shows H&E representative images of tumor emboli in medium (top images) and small (bottom images) caliber vessels for patients with colorectal (rPt.P32) and lung (rPt.P16) cancer, respectively, at low (L) and high (H) magnification. Scale bars = 500 µm (left) and 100 µm (right). e, The image shows box plots representing the quantification of tumor emboli detected in H&E images of patients from the UTSW retrospective cohort. Individual box plots show the counts of tumor emboli detected in vessels, small and medium/large calibers, for UTSW retrospective cohort patients (n = 92). Box plots indicate 25th, 50th and 75th percentiles and whiskers represent the range of values within 1.5 interquartile ranges of the 25th and 75th percentiles. Statistical annotations indicate the statistical significance of two-sided Wilcoxon signed-rank tests to compare groups shown on the x axis. Exact P values are 1.11 × 10⁻¹⁴, 0.96, 9.59 × 10⁻¹⁵ and 7.52 × 10⁻¹⁵ for medium/large arteries versus small veins, small arteries versus medium/large veins, small arteries versus small veins, and medium/large veins versus small veins, respectively. P values are not corrected for multiple comparisons. f, The image shows coronal (central image) and axial (lateral images) CT scans with a portion of the primary tumor infiltrating the superior vena cava from a patient with lung cancer (rPt.P107). Arrowheads demarcate tumor borders in the coronal image and point toward the tumor thrombus in the axial images. Axial images correspond to the planes demarcated by colored lines on the coronal image. Scale bar = 2 cm. g, The image shows representative H&E images from the clinical autopsy of a patient (rPt.P107) with lung cancer. The central image (low magnification) shows a segment of the superior vena cava with tumor cells infiltrating the vessel wall (left image, high magnification) and a blood clot containing several tumor cells highlighted by white arrows (right image, high magnification). Scale bars = 100 µm (left), 5 mm (middle) and 50 µm (right). Pts, patients; CNS, central nervous system; RN, registered nurse; SVC, superior vena cava; rPt, retrospective patients.
Tumor emboli and radiological signs of macrovascular infiltration
To gain preliminary insights into the potential causes of death in this cohort, we examined 3,382 hematoxylin and eosin (H&E) slides obtained from the clinical autopsies of 92 of the 108 patients, covering major organs (n = 30; Supplementary Table 2). Of these 92 patients, 81 (88%) were positive for tumor emboli inside veins, arteries or heart chambers (Fig. 1c,d, Extended Data Fig. 1 and Supplementary Table 3), regardless of their cancer diagnosis (P = 0.29, X2 = 21.9, degrees of freedom = 19, Extended Data Fig. 2a). As expected, tumor emboli were more frequently found in veins than arteries (974 versus 33) and in small- rather than medium-caliber vessels (971 versus 26; Fig. 1e and Supplementary Table 3). Notably, despite the stochastic nature of the available samples (that is, not collected to conclusively examine vascular-associated features), 10% of patients presented with tumor emboli in large arteries and veins (Fig. 1e and Extended Data Fig. 1). On average, each patient harbored 11 tumor emboli (s.d. = 13.3, range = 0–79), and 84% of the patients exhibited at least one tumor embolus in an organ distinct from the primary tumor site (Extended Data Fig. 2b). Altogether, these data indicate that tumor emboli are a relatively common finding in patients with terminal solid malignancies.
Next, to investigate alternative explanations (beyond clinical metastases) for the widespread dissemination of tumor emboli, a US board-certified radiologist reviewed the CT scans of these 108 patients. Of those, 101 (93%) had at least one imaging study that met radiological standards, and 60 (59%) displayed signs of macrovascular infiltration (Fig. 1f, Supplementary Fig. 2 and Supplementary Table 4), which were also documented in the routine clinical autopsy report of one of these patients (rPt.107; Fig. 1g and Supplementary Fig. 3). No differences were observed in the time interval between the CT imaging before death between patients with and without radiological signs of macrovascular infiltration (P = 0.57, U = 1147.5, median = 25.5 versus 21 days), nor across patients with different cancer diagnoses who exhibited signs of vessel involvement (P = 0.41, Kruskal–Wallis H = 17.6). The pulmonary artery (27%), inferior vena cava (IVC; 21%) and portal vein (19%) were the most frequently infiltrated vessels (Extended Data Fig. 3a), primarily in the context of lung, pancreatobiliary and liver cancers, respectively (65%, 23% and 25%; Extended Data Fig. 3b).
In summary, these retrospective findings suggest that macrovascular infiltration and the presence of tumor emboli appear to be relatively common events at the end of life in patients with solid malignancies, deserving a more detailed and prospective evaluation.
A perimortem spike of tumor emboli and pathological evidence of macrovascular infiltration characterize patients who succumb to cancer
Based on our retrospective findings, we designed a prospective study to evaluate the number of CTCs during late-stage disease progression and confirm vessel infiltration at the time of death through a video-recorded rapid autopsy procedure.
Of 534 patients prospectively prescreened between November 2021 and November 2023, 513 were deemed ineligible, declined participation, withdrew from the study, or declined the autopsy. Consequently, 21 patients with a carcinoma diagnosis were enrolled, monitored and underwent a rapid autopsy (Fig. 2a, Extended Data Fig. 4, Supplementary Figs. 4–7 and Supplementary Tables 5–8). Under the same protocol, patients with nonmalignant conditions were also prescreened to serve as a control group. Of 251 prescreened patients, 241 were not eligible, declined to participate, or withdrew from the study. Subsequently, ten patients without any known history of cancer were enrolled, followed and subjected to a rapid autopsy (Table 1, Extended Data Fig. 4 and Supplementary Tables 5, 7 and 9). On average, patients with cancer were followed for 37.8 days (s.d. = 51.3, range = 2–239 days). During this period, 76% of patients underwent one or more follow-up visits (range = 1–5 visits), prompted by either a decline in their Palliative Performance Scale21 (PPS) or an acute event (Supplementary Figs. 4 and 5 and Supplementary Table 7). The median PPS at baseline was 50%, dropping to 20% at the final visit before death (Supplementary Table 7). No difference in PPS at the end of life was observed between patients with or without cancer (P = 0.33, U = 73.5, median PPS of 20 versus 20). In 90% of patients with cancer, tumor markers rose from baseline to the final visit before death (Extended Data Fig. 5a and Supplementary Table 7). This rise was accompanied by a progressive deterioration of coagulation status, as evidenced by a gradual increase in international normalized ratio (INR) values in 67% of patients, irrespective of coagulation-specific medication intake (P = 0.02, T = 6.5; Extended Data Fig. 5b). A similar pattern was noted for CTCs (Fig. 2b), which demonstrated a marked acceleration in total CTC counts (P < 0.0001, T = 231.0) and CTC cluster size (P = 0.03, T = 27.0) immediately before death (Fig. 2c,d). This surge remained evident even when single (P = 0.001, T = 117.0) and total CTC clusters (P < 0.0001, T = 231.0) were analyzed separately, as well as when clusters were further subdivided into homotypic (cancer cells only—P = 0.0003, T = 153.0) or heterotypic (cancer and immune cells—P = 0.0001, T = 190.0) clusters (Fig. 2e, Extended Data Fig. 5d–g, Extended Data Fig. 6 and Supplementary Fig. 8). Interestingly, the acceleration in CTC counts observed in patients nearing death emerged from an underlying upward trajectory, although this trend did not reach statistical significance (Supplementary Figs. 9 and 10). The malignant nature of these circulating cells was confirmed by single-cell RNA sequencing and mutation calling, which detected cancer-associated mutations (Supplementary Fig. 11), and by pathological evidence of malignant cell clusters (that is, tumor emboli) within blood clots retrieved at autopsy (Supplementary Fig. 12). Notably, these clots were taken from the same vessels used for blood sampling and where corresponding CTCs had been identified (Fig. 2b). As expected, no cancer cells were detected within blood clots obtained from patients with nonmalignant illnesses (Supplementary Figs. 13 and 14). In contrast, among the 21 patients with cancer who underwent autopsy, 8 (38%) had detectable masses adherent to large arteries and veins, which were resected en bloc. Pathological analysis confirmed infiltration of vessel walls and lumens, along with the presence of tumor thrombi partially obstructing vessel patency, in patients with colorectal, lung, pancreatobiliary, breast, prostate, kidney and esophageal cancers (Extended Data Fig. 7).
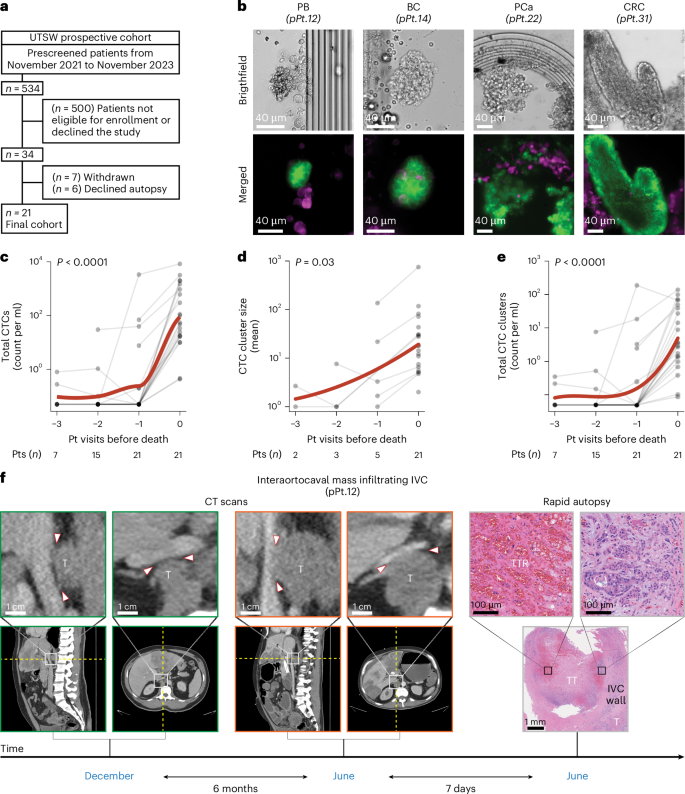
a, The image shows inclusion and exclusion criteria for enrolling patients with cancer in the UTSW prospective cohort. b, The image shows representative brightfield (top) and immunofluorescence (bottom) images of microfluid-captured CTC clusters from prospectively enrolled patients with a diagnosis of pancreatobiliary (pPt.12), breast (pPt.14), prostate (pPt.22), and colorectal (pPt.31) cancer. EpCAM, HER2 and EGFR were the surface markers used to visualize CTC clusters (green color), while the CD45 marker was used to visualize immune cells (magenta color). Scale bar = 40 µm (all, top and bottom). c, The image shows a graph depicting changing blood levels of CTCs over time. Each point in the plots represents individual patient values. The bold red line represents a curve fitting patient data using a locally estimated scatterplot smoothing (LOESS) model. ‘0’, ‘−1’, ‘−2’ and ‘−3’ in the x axis refer to the rapid autopsy procedure, closest, second closest and third closest visit before death, respectively. P value indicates the statistical significance of a two-sided Wilcoxon signed-rank test comparing the earliest available versus final values for each patient (P = 5.95 × 10⁻⁵). d, The image shows a graph depicting the changing blood levels of mean CTC cluster size over time. Each point in the plots represents individual patient values. The bold red line represents a curve fitting patient data using a polynomial regression model. ‘0’, ‘−1’, ‘−2’ and ‘−3’ in the x axis refer to the rapid autopsy procedure, closest, second closest and third closest visit before death, respectively. P value indicates the statistical significance of a two-sided Wilcoxon signed-rank test comparing the earliest available versus final values for each patient. e, The image shows a graph depicting changing blood levels of total CTC clusters over time. Each point in the plots represents individual patient values. The bold red line represents a curve fitting patient data using a polynomial regression model. ‘0’, ‘−1’, ‘−2’ and ‘−3’ in the x axis refer to the rapid autopsy procedure, closest, second closest and third closest visit before death, respectively. P value indicates the statistical significance of a two-sided Wilcoxon signed-rank test comparing the earliest available versus final values for each patient (P = 9.53 × 10⁻⁷). f, The image shows sagittal (left) and axial (right) CT images of a prospectively enrolled patient (pPt.12) at different magnifications from two distinct time points (December and June). The images illustrate a progression of a T infiltrating the posterior wall of the IVC. Arrowheads demarcate the anterior border of the growing tumor mass in relation to the posterior wall of the IVC. Representative H&E images from the rapid autopsy show pathological evidence of macrovascular infiltration—the bottom image (low magnitude) displays a T infiltrating the IVC wall and vessel lumen (top-right image) with signs of TT as well as TTR (top-left image). pPt, prospectively enrolled patient; T, interaortocaval metastatic lesion; TT, tumor thrombus; TTR, tumor thrombus recanalization; PB, pancreatobiliary cancer; BC, breast cancer; PCa, prostate cancer.
CT imaging provided additional evidence of progressive vessel infiltration. By comparing earlier scans with one acquired 7 days before death, a growing interaortocaval mass was observed infiltrating the IVC wall over 6 months in a patient with a pancreatobiliary tumor (Fig. 2f (CT scans) and Supplementary Fig. 15). Pathological examination verified massive tumor cell infiltration within the wall and inside the vena cava lumen (Fig. 2f (rapid autopsy, bottom and top-right) and Extended Data Fig. 7), as well as a large tumor thrombus showing signs of recanalization (Fig. 2f, (rapid autopsy, top-left)).
Taken together, these prospective findings indicate that widespread CTC dissemination and macrovascular infiltration might represent critical cancer-related events that occur at the end of life in a fraction of patients with solid tumors, irrespective of their primary diagnosis. These observations further underscore the critical role of the cardiovascular system in tumor progression and its possible association with carcinoma lethality.
Prognostic value of macrovascular infiltration
To further elucidate the relationship between vessel involvement and carcinoma lethality, we evaluated clinical outcomes in treatment-homogeneous patient populations diagnosed with lung carcinomas, colorectal carcinomas, pancreatic carcinomas, ovarian carcinomas or hepatocellular carcinomas (HCC).
Of 4,475 patients with cancer initially identified at the University of Lübeck and the University of Mainz, Germany, 1,319 were excluded due to an age below 18 years, multiple malignancies, failure to meet German imaging guidelines or lack of cross-sectional imaging studies, yielding 3,156 eligible patients. Among these, 250 patients per cancer type were randomly selected, resulting in a final cohort of 1,250 patients (Supplementary Fig. 16).
Table 1, Supplementary Tables 10–12 and Extended Data Fig. 8 show the demographic, clinical and radiological characteristics of these 1,250 patients. Notably, the interval between cancer diagnosis and the earliest radiologic evidence of macrovascular infiltration varied considerably across cancer types (P < 0.0001, H = 89.6; Supplementary Fig. 17a), ranging on average from 0.5 years in lung cancer to 2.3 years in colorectal cancer (CRC; Supplementary Fig. 17a). As expected, the presence and timing of distant metastasis22,23,24 (synchronous versus metachronous), as well as resection status, strongly correlate with the onset and location of macrovascular infiltration (Supplementary Figs. 17b–d and 18–20). Indeed, patients (n = 102) who underwent surgical resection and were metastasis-free at diagnosis showed a notable delay in the detection of vessel involvement compared to patients (n = 296) who did not undergo surgical intervention or presented with distant metastasis at the time of diagnosis (2.8 versus 0.7 years, respectively; P < 0.0001, U = 5068.5; Supplementary Fig. 17b).
To assess the prognostic power of macrovascular infiltration, we first conducted univariate survival analyses among metastatic patients, categorizing them by the presence or absence of vessel involvement at the time distant metastases were identified. These analyses showed the strong prognostic value of macrovascular infiltration across patients with lung carcinomas, colorectal carcinomas, pancreatic carcinomas, ovarian carcinomas or HCC (Fig. 3a and Supplementary Fig. 21). Specifically, metastatic patients exhibiting macrovascular infiltration had a markedly shorter median overall survival (range: 0.1–0.5 years) compared to those without vessel involvement (range = 1.2–6.6 years; Fig. 3a and Supplementary Fig. 22). Notably, these differences in survival remained pronounced even when patients were further stratified by tumor stage, resection status, or timing of distant metastasis (synchronous versus metachronous; Supplementary Figs. 23–29). Time-varying Cox regression analyses further corroborated that vessel involvement is the strongest single predictor of survival, even after controlling for treatment status and distant metastasis (Fig. 3b, Supplementary Fig. 30a and Supplementary Table 13). Furthermore, within treatment-homogeneous subgroups—comprising patients who either did or did not undergo surgical resection—macrovascular infiltration remained the only consistent predictor of poor outcome (Extended Data Fig. 9). Including INR and coagulation-specific medication intake into additional time-varying Cox regression analyses further reinforced the superior prognostic power of macrovascular infiltration in identifying patients with poor outcomes (Supplementary Fig. 30b,c).
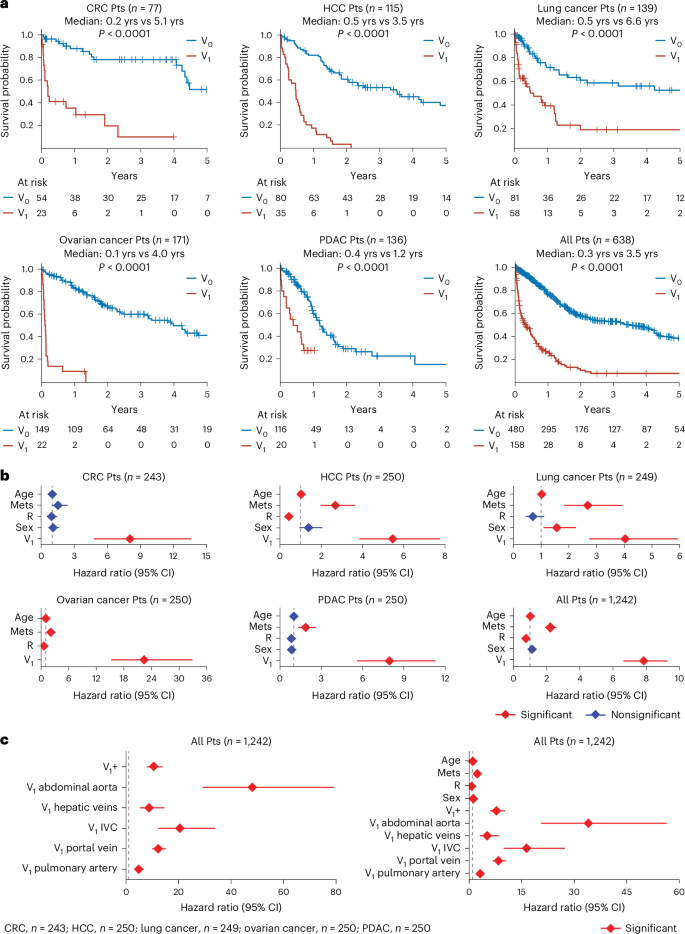
a, The image shows Kaplan–Meier curves illustrating survival probability for patients with and without vessel infiltration (V1 and V0, respectively) from the onset of metastasis. Log-rank tests were used to compare patients with and without vessel infiltration (V1 and V0, respectively) in each plot. Exact P values are 7.88 × 10⁻¹⁰, 6.74 × 10⁻¹⁹, 1.31 × 10⁻⁶, 2.50 × 10⁻³⁴, 8.89 × 10⁻⁷ and 1.07 × 10−49 for groups with CRC, HCC, lung cancer, ovarian cancer, PDAC, and for all patients, respectively. b, The image shows hazard ratios from time-varying Cox regression models that included R, Mets, V1, sex and age as time-varying covariates. Diamonds indicate hazard ratios corresponding to variables shown on the y axis with error bars showing the 95% CI for the hazard ratio. Hazard ratios were estimated using multivariate, time-varying covariate Cox regression. c, The image shows two plots displaying the hazard ratios from time-varying Cox regression models. Left: graph shows hazard ratios resulting from Cox regression with time-varying covariates for the top five most frequently infiltrated vessels. Right: graph shows hazard ratios from Cox regression with time-varying covariates for the top five most frequently infiltrated vessels, along with age, sex, R and Mets. In both graphs (left and right), V1+ represents patients with involvement in other vessels or with at least one of these top five infiltrated vessels, along with any other vessels. Diamonds indicate hazard corresponding to variables shown on the y axis with error bars showing the 95% CI for the hazard ratio. Hazard ratios were estimated using multivariate, time-varying covariate Cox regression. CI, confidence interval; PDAC, pancreatic ductal adenocarcinoma; Mets, metastasis; R, resection status; V1, macrovascular infiltration.
Finally, to determine whether macrovascular infiltration represents a uniform prognostic entity or whether its prognostic value varies according to the specific infiltrated vessel, we performed further analyses focusing on the five most frequently infiltrated vessels—the portal vein, pulmonary artery, IVC, hepatic veins and abdominal aorta (Extended Data Fig. 8a). Interestingly, this evaluation revealed that the invasion of the abdominal aorta and the IVC—the largest artery and vein in the circulatory system, respectively—carries the highest hazard ratios in patients with lung carcinomas, colorectal carcinomas, pancreatic carcinomas, ovarian carcinomas or HCC (abdominal aorta, hazard ratio = 48.1; IVC, hazard ratio = 20.5; Fig. 3c (left), Extended Data Fig. 10 and Supplementary Fig. 31). Notably, these associations remained highly significant even after adjusting for age, sex, presence (and timing) of distant metastasis and resection status (Fig. 3c (right) and Supplementary Fig. 32).
Taken together, these data suggest a role of macrovascular infiltration as a robust prognostic biomarker, independent of clinical metastasis, in various treatment-homogeneous patient cohorts (Supplementary Fig. 33).
Discussion
In this study, we longitudinally evaluated patients across a broad spectrum of solid malignancies and identify a sharp increase in CTCs, particularly clusters, immediately before death. Our work also shows the occurrence of large-vessel infiltration during tumor progression, indicating that macrovascular infiltration appears to be a stronger predictor of survival, irrespective of distant metastasis in treatment-homogeneous patients diagnosed with lung carcinomas, colorectal carcinomas, pancreatic carcinomas, ovarian carcinomas or HCC.
Cardiovascular accidents, particularly thromboembolism, are well-known events in patients with cancer16,17,18,25,26,27,28,29,30,31,32. Several population-based studies15,18,27 show that venous thromboembolism is a common occurrence in patients with cancer, increasing the risk of mortality up to 30-fold19. Interestingly, a comprehensive investigation examining over 100 autopsies identified cancer cells in more than 25% of thrombi found in deep vein thrombosis (for example, IVC, iliac, etc.) and pulmonary embolism18. Specifically, ref. 18 showed that tumor cells entrapped within these blood clots—with or without adjacent vessel infiltration—express pro-coagulant factors, such as Tissue Factor and Podoplanin, suggesting their active role in modifying hemostasis. Our observations of massive thrombi containing large CTC clusters, along with our data on altered coagulation status, fully corroborate these findings, highlighting the need for additional investigations on the mechanisms underlying the formation of tumor thrombi. Notably, ref. 33 recently demonstrated that lung interstitial macrophages can also promote systemic thromboembolic events by activating platelets via the secretion of β2 integrin-positive small extracellular vesicles. Overall, these data further underscore the complex interplay among the metastatic niche33, CTCs34,35, and the innate and adaptive immune system36 in cancer-associated thrombosis. Additionally, a recent study mentioned in ref. 37 further highlights the importance of CTCs in late-stage tumor progression, reporting that patients with ovarian cancer with higher CTC counts were more likely to present with advanced-stage disease (stages III–IV) and shorter disease-free survival compared to those with lower CTC counts. Collectively, these findings reinforce the critical role of CTCs throughout disease progression, suggesting their potential contribution to tumor progression and cancer lethality beyond their established role as metastatic drivers34,35.
To further emphasize the central role of the cardiovascular system in patients with cancer, our study also investigated the relationship between vessel involvement and tumor progression. Interestingly, we found that radiological evidence of macrovascular infiltration can identify patients with poor outcomes. These observations build upon previous evidence20,38,39,40, particularly in HCC38,39, where infiltration of the portal and hepatic veins is a common event (~40% of cases) and strongly correlates with reduced overall survival20. Indeed, in this tumor type, macrovascular infiltration is such a well-established independent prognostic factor that a recent clinical trial involving patients with resectable disease used vessel infiltration as a stratification criterion for randomization41. Our results broaden these insights, showing that macrovascular infiltration seems to be an even stronger predictor of poor survival compared to well-known clinical variables, such as distant metastasis and resection status. Additionally, our time-varying Cox regression analyses revealed distinct prognostic values associated with each infiltrated vessel, showing that involvement of the abdominal aorta and IVC is an event associated with the highest hazard ratios in patients with lung carcinomas, colorectal carcinomas, pancreatic carcinomas, ovarian carcinomas or HCC. Notably, these associations remained highly significant even after adjusting for the presence and timing22,23,24 (synchronous versus metachronous) of distant metastasis and resection status.
Our findings also raise important considerations regarding the potential mechanistic role of macrovascular infiltration in disease progression. A compelling hypothesis is that macrovascular infiltration represents a substantial source of CTCs, thereby actively promoting disease spread. Future studies should aim to accurately map the origin of CTCs throughout tumor progression and specifically test whether a substantial proportion of CTCs originate from the colonization of large vessels—either from vessel walls or vessel lumina—in addition to well-established sources of CTCs (that is, primary tumors, when present, and distant metastases). In parallel, other investigations should clarify whether differences in the frequency of macrovascular infiltration among vessels are driven by specific biological factors (vascular tropism) or simply reflect the proximity of vessels to expanding tumor masses. Resolving these questions would help elucidate the precise mechanisms underlying tumor progression and determine whether macrovascular infiltration actively contributes to disease advancement and patient mortality. This insight would also be valuable for designing effective surveillance strategies and could provide a rationale for future clinical trials aimed at preventing/treating macrovascular infiltration, for instance, by surgically or stereotactically targeting tumor masses approaching large vessels or by disrupting CTC clusters pharmacologically42.
On a broader level, this work sheds light on the pathophysiological mechanisms underlying tumor progression, provides an alternative framework for interpreting cancer-related events at the end of life, and may serve as a foundation for future reverse translational research. Collectively, our data support the hypothesis that vessel infiltration, accelerated CTC release, and a consequent vascular failure may be terminal events, posing substantial, life-threatening risks in patients with cancer. However, despite the new and potential significance of our findings, this study has several limitations—(1) the heterogeneity among panelists in determining the primary cause of death across patients with cancer, (2) differences in vessel availability for CTC assessment before and after death, (3) the absence of a prospective cohort to further confirm the prognostic value of macrovascular infiltration, (4) the omission of high-prevalence tumors, such as breast, prostate, and gastric cancer, from our independent validation cohort and (5) the observational, albeit longitudinal, nature of our findings. Although it is tempting to mechanistically link macrovascular infiltration and the spike in CTCs directly to patient death, we acknowledge that, at this stage, such associations may not necessarily be causal. Future research should determine whether these events represent epiphenomena of tumor progression—with patient death resulting from potentially other factors (metastatic disease progression)—or whether the development of macrovascular infiltration and the surge in CTCs are mechanistically involved in cancer lethality.
In conclusion, these findings represent a step forward in our understanding of disease progression by highlighting a series of cancer-related events beyond primary tumor growth, loco-regional invasion and distant metastasis formation. Specifically, we identify a perimortem surge in CTCs and the occurrence of macrovascular infiltration as potential pivotal events strongly associated with cancer mortality. Overall, these insights, combined with their prognostic relevance and potential therapeutic implications, may open new avenues for clinical intervention and substantially enhance patient survival outcomes.
Methods
Inclusion and ethics
All studies were approved by the relevant Institutional Ethical Committees. Specifically, the UTSW retrospective (PMH-122020-001) and prospective (STU-2020-0628) studies were approved by the Institutional Review Board (IRB) at the University of Texas Southwestern. The German cohort was approved by the ethical committees at the University of Lübeck and the University of Mainz (IRB: 2024-112 and 2024-17558, respectively).
Study design and patient cohorts
To understand the cancer-related events that occur at the end of life in patients with a diagnosis of carcinoma, a study design that included three independent patient cohorts from the US and Europe was employed (Supplementary Fig. 33).
To assess which cancer-related events, other than the presence of metastasis, arise in patients dying of advanced solid malignancies, we reviewed routine clinical autopsies performed on a retrospective cohort of patients (n = 108) who had died at UTSW (Supplementary Tables 1–4). Based on these data, a prospective, observational (case–control) study was designed to test the hypothesis that the colonization of cancer cells within the wall and inside the lumen of large vessels (that is, macrovascular infiltration), as well as the sharp increase of CTCs in the days preceding the patient’s death, were the terminal events observed in patients with cancer. In this longitudinal study, patients (n = 21) with a diagnosis of carcinoma (study cohort) were enrolled when in hospice, monitored with multiple visits and blood draws during the disease, and subjected to a rapid (that is, warm) autopsy procedure upon death. In addition, patients (n = 10) who were dying of nonmalignant illnesses (control cohort) were also included in this prospective study to rule out potential confounding variables linked to the patient’s death independent of cancer progression (Extended Data Fig. 4, Supplementary Figs. 4–7 and Supplementary Tables 5–9).
Lastly, a retrospective cohort (n = 1,250) from the University of Lübeck and the University of Mainz was employed to confirm independently the presence of radiological signs of macrovascular infiltration in routine, follow-up CT scans and to establish its prognostic power in patients with a diagnosis of lung (n = 250), colorectal (n = 250), pancreatic (n = 250), ovarian (n = 250) and hepatocellular carcinoma (n = 250) (Supplementary Fig. 16 and Supplementary Tables 10, 11 and 13). No statistical methods were used to predetermine sample sizes for these patient cohorts.
The UTSW retrospective cohort
Assessing the consensus on the cause of death in patients with advanced solid malignancies
To assess consensus among medical professionals regarding the terminal events in patients with cancer at the end of life, we conducted a query, under an approved protocol (PMH-122020-001), of the databases of two hospitals—Clements University Hospital (CUH) and Parkland Health & Hospital System (PHHS)—within our institution (referred to as UTSW Medical Center in the main article). We identified consecutive patients with cancer who died during hospitalization and underwent a clinical (routine) autopsy between January 2010 and December 2020 (Fig. 1a). After applying the exclusion criteria listed in Fig. 1a and Supplementary Table 1, we obtained a cohort of patients with a broad spectrum of solid tumors, which included breast, colorectal, prostate, lung, liver, and pancreatic cancer, as well as less frequent types of solid malignancies (Table 1 (UTSW retrospective cohort)). We incorporated routine autopsy, clinical data, and radiological records to provide the most comprehensive documentation for determining the most likely cause of the patient’s death5,6,13. We asked an interdisciplinary panel of medical professionals to review the available data to identify the most probable cause of death from a preselected list of common clinical conditions observed at the end of life in patients with cancer, including sepsis, end-organ failure, thromboembolic events, as well as rarer conditions such as tumor lysis syndrome and type B lactic acidosis (Supplementary Methods—List of the causes of death). To account for clinical scenarios or events outside of this list, we included an additional category named ‘other causes’. To avoid introducing bias, each of our experts was asked to review the clinical data and make their assessment individually, without consulting colleagues. The interdisciplinary panel of UTSW medical professionals consisted of nine physicians from different specialties: surgery (n = 3), internal medicine (n = 2), pathology (n = 2), intensive care medicine (n = 1), and oncology (n = 1). Most of them were attending physicians (n = 6), while three were trainees (that is, residents) in general surgery (n = 2) and internal medicine (n = 1). Our panel also included a registered nurse (Fig. 1b (left)).
Quantification of tumor emboli and radiological signs of macrovascular infiltration in patients with advanced solid tumors
To uncover cancer-related events that could be implicated in patient death, H&E-stained slides generated during the routine clinical autopsy for the UTSW retrospective patient cohort were retrieved from the CUH and PHHS Pathology Archives (Supplementary Table 2). A UTSW board-certified anatomical pathologist (Z.C.) retrospectively reviewed each slide. If tumor emboli in small/medium/large veins and arteries or in heart chambers were identified, images of these tissues were captured for quantification and downstream analysis (Supplementary Table 3). Vessel calibers were determined as a standard method to classify arteries and veins. Veins were designated as either small, medium or large if their diameters measured less than 1 mm, equal to or greater than 1 mm but less than or equal to 10 mm, or greater than 10 mm, respectively, while arteries were designated as small, medium or large if their diameters measured less than 2 mm, equal to or greater than 2 mm but less than or equal to 10 mm or greater than 10 mm, respectively43. Whenever there was uncertainty about the presence of tumor emboli, a second board-certified anatomical pathologist (M.B.W.), who was blinded to other clinical outcomes, was consulted.
In addition to the H&E slide review, all CT scans of these patients were recovered from the CUH and PHHS radiological archives and reviewed by a board-certified UTSW radiologist (W.M.) to identify any radiological signs of macrovascular infiltration during or before their last hospitalization (Supplementary Table 4). Each CT scan was reviewed by the board-certified UTSW radiologist, and only studies that met the radiological standards for the appropriate evaluation of vessel infiltration were included for downstream analysis. Large caliber vessels such as the pulmonary artery and veins, superior vena cava, subclavian arteries and veins, portal vein, internal/external jugulars, abdominal aorta, common/internal/external iliac arteries and veins, superior mesenteric artery and vein, IVC and brachiocephalic trunk were considered for this analysis (Supplementary Table 4).
The UTSW prospective cohort
Hypothesis and study design
To prospectively validate the cancer-related events identified in the UTSW retrospective cohort, we designed a case–control clinical study comprising both a cancer and a control (that is, patients with nonmalignant illnesses) cohort. This longitudinal study aimed to determine if vessel infiltration occurred during tumor progression and whether tumor emboli, also known as CTC clusters, increased in the days preceding the patient’s death (Supplementary Fig. 33). The cancer cohort consisted of patients with a diagnosis of carcinoma who had discontinued all anticancer treatments with curative intent at the time of enrollment (that is, under palliative care treatments only), while the control cohort included patients admitted to hospice with a nonmalignant illness. Patients were enrolled and followed prospectively until death, after which a research rapid (that is, warm) autopsy procedure was performed (see ‘Research rapid autopsy procedure’ for more details on the research procedure).
The cancer cohort and the control cohorts: inclusion and exclusion criteria
Under an approved protocol (STU-2020-0628), from 17 November 2021 to 7 November 2023, patients with a diagnosis of cancer were screened from the Harold C. Simmons Comprehensive Cancer Center at UTSW Medical Center as well as from three different hospices, Faith Presbyterian Hospice, Visiting Nurse Association of Texas, and Pathway Hospice. These hospices were included as enrolling off-campus sites for this study, each with a local physician leader. The study was approved by the Protocol Review and Monitoring Committee and IRB, and oversight was maintained by the data and safety monitoring board. To be eligible for the study, patients had to fulfill the following criteria: be at least 18 years old, have received a diagnosis of carcinoma (Extended Data Fig. 4 and Supplementary Table 5), have discontinued all nonpalliative cancer therapies and be negative for HIV/HBV/HCV, as confirmed by screening labs upon enrollment. In addition, under the same protocol, from 1 August 2022 to 7 November 2023, patients were also screened to serve as our control population. To be considered for the control cohort, eligible participants needed to be admitted to one of the above-mentioned hospices, have an underlying nonmalignant illness (Extended Data Fig. 4 and Supplementary Table 5), and be negative for HIV/HBV/HCV (exclusion criteria), as confirmed by screening labs upon enrollment. Patients in both the cancer and control cohorts had the option to accept/refuse the research autopsy procedure upon death or withdraw from the study at any time. All participants in the prospective study, or their legally authorized representatives, provided written informed consent.
Patient visits, clinical assessments and laboratory tests
Upon enrollment and confirmation of negative results for HIV, HBV and HCV, participants were considered active. Patients with an active status underwent a baseline visit followed by subsequent additional visits (follow-up visits) until the time of death. Follow-up visits were triggered by one or more of the following events: a decline of at least 20% in the patients’ PPS, which is the current standard of care for documenting the decline in hospice patients21, or onset of symptoms compatible with infection, cardiac/cardiovascular events, deep vein thrombosis and/or pulmonary embolism. Patient visits were also triggered when clinical conditions of imminent death (PPS = 10%) were reported (Supplementary Fig. 4).
Each visit consisted of a detailed clinical assessment (Supplementary Fig. 5), an 80 ml blood draw (Supplementary Figs. 6 and 7 and Supplementary Table 6), and height and weight measurement (using a patient lift) whenever the conditions permitted (Supplementary Fig. 5). Of note, central access was preferred over peripheral blood draw to minimize the patient’s discomfort (Supplementary Figs. 6 and 7 and Supplementary Methods—Blood draw).
The purpose of each visit was to determine the patient’s clinical condition (Supplementary Methods—Clinical assessment) as well as hematological and metabolic status, the presence of any acid–base imbalance or ions level disorders, the onset of an inflammatory systemic response syndrome or septic shock (for example, positive blood culture), the existence of liver, kidney or lung dysfunctions, or the occurrence of an acute cardiovascular event (for example, myocardial infarction). In addition, given our hypothesis of an increased number of CTCs at the end of life, mirrored by the infiltration within the wall and inside the lumen of large vessels with the formation of tumor thrombi, particular emphasis was placed on the coagulation profile. Thus, the most common coagulation tests, as well as D-Dimer levels and the activity of Von Willebrand and other coagulation factors (for example, factor X, factor II), were included in our laboratory panel (Supplementary Table 6). Well-established tumor markers for each cancer type (for example, CEA, CA19.9) were also assessed, while two independent 8.5-ml ACD-A tubes were used to quantify the presence of CTC clusters (that is, tumor emboli) at each visit (Supplementary Fig. 7).
Research rapid autopsy procedure
Upon death, patients who accepted the optional postmortem examination underwent a research autopsy procedure (Supplementary Fig. 4). To obtain high-quality blood and tissue samples, our goal was to start the autopsy within 6 hours of pronouncement, which was achieved in 77% of the patients (24/31 patients). Before the routine en bloc organ dissection, blood draws were collected from large vessels, such as the superior and IVC, portal veins, left brachiocephalic vein, right atrium and iliac veins, to assess the presence of CTCs. Upon blood draw completion, careful surgical dissection and ligation of each large artery and vein (that is, carotid and jugular, subclavian artery and veins, and iliac artery and vein) was performed to ensure that the content of the vasculature, such as tumor thrombi, was preserved before the en bloc organ removal. Then, an analytical organ-by-organ autopsy was performed. Autopsies were videoed in their entirety to capture blood draws and the dissection of macroscopic tumor masses infiltrating large vessels for all but two patients (pPt.2, who was not recorded, and camera failure occurred in the middle of the autopsy in pPt.32, preventing the recording of the blood draws). ACD-A tubes containing blood taken from multiple vessels during each autopsy were shipped to the Institute of Molecular Health Sciences, Department of Biology, ETH, under an approved MTA (202212-0171). All organ tissue and blood clots collected during autopsy were processed to generate formalin-fixed paraffin-embedded (FFPE) tissue blocks. These blocks were sectioned, and H&E-stained slides were generated to assess the presence of cancer cells in blood clots, organ tissues, and within the wall and inside the lumen of large vessels (Supplementary Fig. 4).
The validation external (German) cohort
Approval for the study was obtained from the University of Lübeck and the University of Mainz (IRB: 2024-112 and 2024-17558, respectively). Five cancer types ranking among the tumors with the highest mortality rate worldwide were included in the study44.
The rationale for choosing lung cancer, CRC, pancreatic cancer, ovarian cancer and HCC as our five cancer type for this study were the following: (1) relatively high mortality rates compared to incidence rates for these five solid malignancies44; (2) distinct anatomical locations—ranging from thoracic to abdominal and retroperitoneal regions—to minimize potential confounding factors related to anatomical variations, including vessel size, proximity to encapsulated or nonencapsulated organs or differences in accessibility between veins and arteries and (3) availability of comprehensive clinical data from our collaborating institutions in Germany (University of Lübeck and University of Mainz). Patients were retrospectively identified from the institutional databases of the University Medical Center Schleswig-Holstein, Campus Lübeck and the University Medical Center Mainz, two German high-volume cancer centers. Patients diagnosed with one of the specified cancer types who presented for an inpatient or outpatient appointment from 1 January 2018 to 1 November 2023 were selected from the institutional databases. Specific inclusion criteria used in this retrospective study were the following: age of at least 18 years, follow-up imaging intervals consistent with the German guideline recommendations for the respective cancer types, and at least one cross-sectional imaging performed during the follow-up period. Patients diagnosed with multiple malignancies were excluded. To obtain a final cohort of 1,250 patients, 250 patients were randomly selected for each of the individual cancer types from the total number of patients identified using the random package in R (Supplementary Fig. 16). Clinical and demographic parameters collected for all patients were sex, race, ethnicity, age at the time of diagnosis, dates of diagnosis, clinical stage according to AJCC 8th edition, time of primary tumor resection if applicable, and timing and site of distant metastasis (if applicable), the timing of last follow-up and acquisition of cross-sectional staging images (Supplementary Tables 10 and 11). All consecutive cross-sectional imaging from the date of diagnosis until the date of the last follow-up was reviewed independently by two radiologists (M.M.S. and L.M.) and one surgeon (L.B.). In the case of inter-rater variability, one senior radiologist (R.K.) and one senior surgeon (T.K.) were consulted, and a consensus was obtained after reviewing the CT scans. Major vascular involvement was defined as tumor proximity to the following arterial and venous structures: thoracic or abdominal aorta, vena cava, brachiocephalic trunk, portal vein, subclavian vessels, main pulmonary vessels, common, internal and external carotid artery and jugular vein, common, internal and external iliac vessels, main hepatic veins, superior and inferior mesenteric vessels and splenic vessels. Vascular involvement was classified as either present or absent. The presence of vascular involvement, which is herein described by macrovascular infiltration, was defined as the following: (1) if the mass did not touch the vessel, the maximum distance between the mass and the vessel needed to be less than 0.5 cm, or (2) if the mass touched the vessel, radiological evidence of compression, infiltration or occlusion were reported. Additional radiological parameters were collected, such as dates of each examination, type of imaging and whether the study used a contrast agent (Supplementary Table 11). In addition, we gathered INR, aPTT, Quick and fibrinogen values, as well as detailed information on medications that influence platelet aggregation (for example, acetylsalicylic acid, clopidogrel, ticagrelor) or the coagulation cascade (for example, vitamin K antagonists, direct oral anticoagulants, unfractionated/low-molecular-weight heparin; Supplementary Table 12).
Statistical analysis
Tumor emboli and radiological signs of macrovascular infiltration
Descriptive statistics (ranges, s.d., means) were calculated using the NumPy package for Python. The TableOne package for Python was used to generate Table 1. For Supplementary Fig. 1, a cause of death was counted for a case whenever at least one reviewer selected it. This produced summary distributions describing agreement for each cause of death, where high values indicate agreement in the corresponding cause of death for the case and low values indicate low (or no) agreement for the cause of death for the case. A difference in proportions of patients with tumor emboli by cancer type was tested using a chi-squared test on a binary emboli present/absent contingency table (Extended Data Fig. 2). Plots were generated using Seaborn and Matplotlib for Python. When generating metrics describing the proportions of patients with emboli characteristics, all patients with and without tumor emboli were examined. Pairwise comparisons of tumor emboli counts in different calibers (‘small’ and ‘medium/large’) of arteries and veins were performed using Wilcoxon signed-ranked tests (Fig. 1e).
Lag times between imaging and death were computed using Python and differences in lag times between groups were tested using a two-tail Mann–Whitney U test (comparing lag times between imaging and death for patients with and without vessel involvement, using SciPy for Python) and a Kruskal–Wallis test (comparing lag times between imaging and death for patients with different cancer types, using SciPy for Python). Plots were generated using Seaborn and Matplotlib for Python.
A premortem spike of tumor emboli and pathological evidence of macrovascular infiltration characterize patients who die of cancer
The difference between PPS scores at the end of life for patients with cancer versus patients without was tested using a two-tailed Mann–Whitney U test (using SciPy for Python). Plots were generated using Seaborn and Matplotlib for Python, with the exception of Fig. 2c and Extended Data Fig. 5c, which were generated using R. For Extended Data Fig. 5, a paired, two-sided Wilcoxon signed-rank test was used to calculate the significance of the change in INR using the earliest available and final INR values.
CTC capture and enumeration
Blood samples were obtained via blood draw from multiple locations (via port, left brachiocephalic, superior vena cava, right atrium, portal vein, IVC, right iliac vein, left common iliac vein and aorta) in ACD-A vacutainers (Fisher Scientific, BD364606) and supplemented with 0.5 µg Tirofiban (Sigma-Aldrich, 30165) per ml of blood. Upon arrival, the samples were equilibrated at room temperature for 15 min. Subsequently, 7.5 µl of 0.5 M EDTA (Invitrogen, AM9260G) per ml of blood was added. The samples were then processed for microfluidic-based CTC capture within approximately 48 h of the blood draw. Using the Parsortix Cell Separation System (ANGLE), CTCs were captured in Cell Separation cassettes (GEN3D6.5) and stained with an antibody cocktail containing antihuman EpCAM–AF488 (Cell Signaling Technology, CST5198; 1:50 dilution), HER2–AF488 (BioLegend, 324410; 1:50 dilution), EGFR–FITC (GeneTex, GTX11400; 1:25 dilution) and CD45-AF647 (BioLegend, 304018; 1:25 dilution). The enumeration of CTCs (defined in this study as ‘CTC counts’), including single CTCs and CTC clusters, was performed while the cells remained in the cassette. After counting, CTCs were released from the cassette in PBS (Gibco, 14190169) onto ultra-low-attachment plates (Corning, 3471-COR) for downstream analysis.
CTC time-course analysis
The pattern of CTC release before death was evaluated using R by fitting a locally estimated scatterplot smoothing (LOESS) or polynomial regression models to CTC levels and CTC cluster size (Fig. 2c) at each time point. The model for CTC levels included all time points with at least two patients, and the CTC counts were normalized by blood volume (ml). CTC count was defined as the sum of single CTCs and the number of individual cells in each CTC cluster (that is, cluster size). For postmortem evaluation, the CTC level was defined as the total number of CTCs normalized by the total volume of blood drawn across all anatomical locations. The comparison of premortem and postmortem CTC levels in patients with and without cancer was performed using the ratio (fold-change) of CTC counts per ml postmortem over premortem levels. The model for CTC cluster size included patients with CTC clusters detected in premortem and postmortem evaluations, and the size of a CTC cluster was determined by the number of CTCs within the cluster, excluding CD45-positive cells. Across the analyses, a pseudocount (z) defined as z = (minimum value per ml)/2 was added to cases with zero counts to allow their visualization on the log scale. In Extended Data Fig. 5c, the two-sided Wilcoxon rank-sum test was used to assess significance. A paired, two-sided Wilcoxon signed-rank test was used to calculate the significance of the difference between the earliest available time point versus the postmortem time point for CTC concentration and mean CTC cluster size (Fig. 2c–e and Extended Data Fig. 5d–g). For Supplementary Figs. 9 and 10, excluding the autopsy time point, a paired, two-sided Wilcoxon signed-rank test was used to calculate the significance of the difference between the earliest available time point versus the final premortem time point for CTC concentrations and mean CTC cluster size. For Fig. 2d,e and Extended Data Fig. 5a,b,d–g, regression lines were fit using either linear, polynomial or LOESS regression. Comparisons between normalized CTC counts at autopsy between patients with cancer and patients with nonmalignant illnesses (Supplementary Fig. 8) were performed with Mann–Whitney U tests using the SciPy package. To determine the total number of CTCs involved in clusters (Extended Data Fig. 6), the number of single CTCs was subtracted from the total number of CTCs. For postmortem samples, the superior vena cava territory includes the superior vena cava, left brachiocephalic vein, right internal jugular and right atrium (Extended Data Fig. 6 and Supplementary Fig. 10). The aorta territory includes the aorta and the right common carotid artery (Extended Data Fig. 6).
RNA-seq analysis and variant calling
Amplified cDNA was prepared on-bead according to the Smart-seq2 protocol. Libraries were prepared using Nextera XT (Illumina) and sequenced on an Illumina NovaSeq X Plus instrument in 150-base-pair paired-end reads mode. Sequencing reads were quality-trimmed with Trim Galore! (v0.6.6, https://www.bioinformatics.babraham.ac.uk/projects/trim_galore/; parameters: –q 20 –length 20). Quality assessment of RNA-seq data was carried out using FastQC (v0.11.9, https://www.bioinformatics.babraham.ac.uk/projects/fastqc), FastQ Screen (v0.15.2, https://www.bioinformatics.babraham.ac.uk/projects/fastq_screen/), and visualized with MultiQC45 (v1.9). Trimmed reads were aligned to the human (GRCh38) genome reference using STAR46 (v.2.7.9a) in a two-pass mode with splice junctions from the human GENCODE annotation (release 40). The resulting BAM files were processed following the GATK best practices for variant calling from RNA-sequencing using GATK47 (v4.2.6.1) and PicardTools (v2.27.5). Gene expression levels were computed with featureCounts from the subread package48 (v.2.0.3) using the human gene annotations from GENCODE (release 40). Variants in individual samples were called using GATK HaplotypeCaller at the patient level and annotated using SnpEff49 (v5.1d) using dbSNP (retrieved from https://ftp.ncbi.nih.gov/snp/organisms/human_9606_b151_GRCh38p7/VCF/common_all_20180418.vcf.gz), OncoKB (accessed on 13 December 2023) and COSMIC (v98). Additional cancer-specific variant annotation was performed using the Cancer Genome Interpreter50. Low-quality samples were identified using an adaptive threshold based on 2.5 median absolute deviations from the distribution of library size and proportion of reads mapping to mitochondrial genes. Patients without samples passing the quality filtering were excluded from further analysis. The list of putative somatic driver mutations was obtained based on the following filtering criteria: (1) remove common SNPs with at least one 1000 Genomes population with a minor allele of frequency ≥1% and for which two or more founders contribute to that minor allele frequency, (2) keep mutations in genes present in OncoKB Cancer Gene List, (3) keep mutations present in COSMIC with at least four occurrences, (4) keep mutations predicted as ‘high’ or ‘moderate’ impact according to SnpEff and (5) keep mutations defined as oncogenic according to Cancer Genome Interpreter. A Wilcoxon rank-sum test was used to compare putative driver mutation counts between cancer and control cohorts in Supplementary Fig. 11.
Human tissue processing and H&E staining
Tissue samples obtained during rapid autopsies were placed in pencil-labeled cassettes and immediately placed in a 4% paraformaldehyde (PFA, SC-281692) solution during the autopsy procedure. Samples were then positioned in a cassette basket, rinsed in fresh 4% PFA for a minimum of two washes, and fixed for 18–24 h at 4 °C in the dark. After fixation, samples were transferred into a 70% ethanol solution and then transferred into preprinted cassettes and handed over to the UTSW Tissue Management Shared Resource core (Simmons Comprehensive Cancer Center) for the FFPE processing. FFPE blocks were then mounted, from which 4-micron slides were cut and stained with H&E staining. H&E-stained slides were finally scanned at ×40 magnification (NanoZoomer S60 Brightfield Slide scanning system—Hamamatsu, C13210-01-BF-KIT; Vectra Polaris—Akoya Biosciences).
Prognostic value of macrovascular infiltration
Cox regression models were constructed for overall survival, where the covariates included baseline characteristics, age and sex, and metastasis, resection status, and vessel involvement as time-dependent covariates (Fig. 3b). We used the Akaike information criterion to compare the fitness of Cox models (Supplementary Table 13). Cox regression analyses, log-rank tests and the Kaplan–Meier curves survival analyses were carried out using the Lifelines package for Python (Fig. 3, Extended Data Figs. 9 and 10 and Supplementary Figs. 21–27 and 29–32). For all time-varying covariate Cox regression models, patients without follow-up after diagnosis were excluded. Additionally, for time-varying covariate Cox regression models using INR as a covariate (Supplementary Fig. 30b,c), all time intervals without known INR were excluded, and only patients with at least one interval with known INR were included. To assess the impact on survival of macrovascular infiltration by vessel (Fig. 3c, Extended Data Fig. 10 and Supplementary Figs. 31 and 32), the earliest infiltration time points were first sorted by frequency to determine the five most frequently infiltrated vessels. Patients with simultaneous earliest infiltration at multiple vessels were classified into the V1+ category (Fig. 3c, Extended Data Fig. 10 and Supplementary Figs. 31 and 32). For analysis of vessel significance within individual cancer types (Extended Data Fig. 10), only vessels with the earliest infiltration events occurring in at least ten patients were used in subsequent time-varying covariate Cox regression models. Sankey diagrams were generated using the Plotly package for Python based on patient status from diagnosis to last follow-up with respect to macrovascular infiltration, resection status, and metastasis. For the Sankey diagrams, events were considered co-occurring if they occurred within 30 days of each other (Supplementary Fig. 28).
Analyses comparing synchronous and metachronous metastasis
For analyses and visualizations comparing synchronous metastasis and metachronous metastasis (Supplementary Figs. 29, 30a and 32), patients with metastasis within 90 days of diagnosis were classified as having synchronous metastasis, and patients with metastasis more than 90 days after diagnosis were classified as having metachronous metastasis22,23,24.
Contingency table tests
For statistical tests performed on contingency tables (Supplementary Figs. 18a,b and 28b), we used the Fisher exact test implementation in SciPy with default parameters, including two-sided alternative hypotheses for all tests. For comparisons of vessel/cancer type frequencies between resection and metastatic statuses (Supplementary Fig. 18a,b), the absolute counts matrices were first flattened, creating n × 2 tables, where n representing the number of rows is the number of cancer type/vessel combinations, with the columns as either M0 and M1 (metastasis positive or negative) or R0 and R1 (resection positive or negative). Then, Fisher’s exact tests were performed to assess the independence of row and column variables.
Time to vessel infiltration detection analyses
For analyses examining the time from diagnosis to detection (Supplementary Fig. 17), the earliest date of vessel involvement was used. Mann–Whitney U tests were used to compare time-to-detection distributions for independent groups (Supplementary Fig. 17b–d). Kruskal–Wallis tests were used to detect the presence of a significantly different group among all groups in Supplementary Fig. 17a,c,d.
Reporting summary
Further information on research design is available in the Nature Portfolio Reporting Summary linked to this article.
Data availability
Data analysis, statistical testing, and visualization were conducted in R (version 4.2.2; R Foundation for Statistical Computing), Bioconductor51 (v.3.16), and Python (v3.10.8) using the following packages: SciPy52 (v1.11.1), lifelines53 (v.0.27.7), Seaborn54 (v0.13.2), Pingouin55 (v0.5.3), NumPy56 (v1.24.3), Plotly57 (v5.20.0) and TableOne58 (v0.8.0). RNA-seq data have been deposited in the Gene Expression Omnibus (GEO, National Center for Biotechnology Information). GEO accession code: GSE295441. Processed transcriptomics data, large datasets, and other files required for reproducibility are available from the Zenodo data repository (https://doi.org/10.5281/zenodo.15829402)59. The human reference genome (GRCh38) human gene annotation (release 40) was downloaded from GENCODE (https://www.gencodegenes.org/). Censored data that can be used to reproduce the main results are included as Supplementary tables.
Code availability
All statistical analyses and results were created using existing, free, open-source software packages. No new algorithms or implementations were used to compute the results presented here. Code demonstrating how the main findings of this work can be reproduced using the provided censored data is available on GitHub (https://github.com/wigasper/vessel-inf-and-ctcs).
References
Siegel, R. L., Giaquinto, A. N. & Jemal, A. Cancer statistics, 2024. CA Cancer J. Clin. 74, 12–49 (2024).
Aaltonen, L. A. et al. Pan-cancer analysis of whole genomes. Nature 578, 82–93 (2020).
Jin, H., Wang, L. & Bernards, R. Rational combinations of targeted cancer therapies: background, advances and challenges. Nat. Rev. Drug Discov. 22, 213–234 (2023).
Haslam, A., Kim, M. S. & Prasad, V. Updated estimates of eligibility for and response to genome-targeted oncology drugs among US cancer patients, 2006–2020. Ann. Oncol. 32, 926–932 (2021).
Inagaki, J., Rodriguez, V. & Bodey, G. P. Causes of death in cancer patients. Cancer 33, 568–573 (1974).
Nichols, L., Saunders, R. & Knollmann, F. D. Causes of death of patients with lung cancer. Arch. Pathol. Lab. Med. 136, 1552–1557 (2012).
Klein, C. A. Cancer progression and the invisible phase of metastatic colonization. Nat. Rev. Cancer 20, 681–694 (2020).
Lambert, A. W., Pattabiraman, D. R. & Weinberg, R. A. Emerging biological principles of metastasis. Cell 168, 670–691 (2017).
Fares, J., Fares, M. Y., Khachfe, H. H., Salhab, H. A. & Fares, Y. Molecular principles of metastasis: a hallmark of cancer revisited. Sig. Transduct. Target. Ther. 5, 28 (2020).
Ganesh, K. & Massagué, J. Targeting metastatic cancer. Nat. Med. 27, 34–44 (2021).
Gerstberger, S., Jiang, Q. & Ganesh, K. Metastasis. Cell 186, 1564–1579 (2023).
Dillekås, H., Rogers, M. S. & Straume, O. Are 90% of deaths from cancer caused by metastases? Cancer Med. 8, 5574–5576 (2019).
Abdel-Karim, I. A., Sammel, R. B. & Prange, M. A. Causes of death at autopsy in an inpatient hospice program. J. Palliat. Med. 10, 894–898 (2007).
Fullarton, M., Pybus, S., Mayland, C. & Rogers, S. N. Analysis of deaths between 2007 and 2012 of patients with cancer of the head and neck on a surgical ward at a regional centre and in an independent hospice. Br. J. Oral. Maxillofac. Surg. 54, 62–67 (2016).
Paterson, D. I. et al. Incident cardiovascular disease among adults with cancer: a population-based cohort study. JACC CardioOncol. 4, 85–94 (2022).
Gimbel, I. A. et al. Pulmonary embolism at autopsy in cancer patients. J. Thromb. Haemost. 19, 1228–1235 (2021).
Sørensen, H. T., Pedersen, L., Van Es, N., Büller, H. R. & Horváth-Puhó, E. Impact of venous thromboembolism on the mortality in patients with cancer: a population-based cohort study. Lancet Reg. Health 34, 100739 (2023).
Gi, T. et al. Histopathological features of cancer-associated venous thromboembolism: presence of intrathrombus cancer cells and prothrombotic factors. Arterioscler. Thromb. Vasc. Biol. 43, 146–159 (2023).
Timp, J. F., Braekkan, S. K., Versteeg, H. H. & Cannegieter, S. C. Epidemiology of cancer-associated venous thrombosis. Blood 122, 1712–1723 (2013).
Mähringer-Kunz, A. et al. Hepatic vein tumor thrombosis in patients with hepatocellular carcinoma: prevalence and clinical significance. United European Gastroenterol. J. 9, 590–597 (2021).
Baik, D. et al. Using the Palliative Performance Scale to estimate survival for patients at the end of life: a systematic review of the literature. J. Palliat. Med. 21, 1651–1661 (2018).
Mitry, E. et al. Epidemiology, management and prognosis of colorectal cancer with lung metastases: a 30-year population-based study. Gut 59, 1383–1388 (2017).
Lurvink, R. J. et al. Increase in the incidence of synchronous and metachronous peritoneal metastases in patients with colorectal cancer: a nationwide study. Eur. J. Surg. Oncol. 47, 1026–1033 (2021).
Elferink, M. A. G., de Jong, K. P., Klaase, J. M., Siemerink, E. J. & de Wilt, J. H. W. Metachronous metastases from colorectal cancer: a population-based study in North-East Netherlands. Int J. Colorectal Dis. 30, 205–212 (2015).
Khorana, A. A. et al. Cancer-associated venous thromboembolism. Nat. Rev. Dis. Prim. 8, 11 (2022).
Mukai, M. & Oka, T. Mechanism and management of cancer-associated thrombosis. J. Cardiol. 72, 89–93 (2018).
Nasser, N. J., Fox, J. & Agbarya, A. Potential mechanisms of cancer-related hypercoagulability. Cancers 12, 566 (2020).
Piazza, G. Venous thromboembolism and cancer. Circulation 128, 2614–2618 (2013).
Yasui, T. et al. Acute myocardial infarction caused by tumor embolus originating from upper tract urothelial carcinoma: a case report. Cardio-Oncology 6, 18 (2020).
Wagner, B. J. et al. Cardiac metastasis causes paradoxical malignant embolism. Cancer Rep. 5, e1513 (2022).
Hussain, S. M. A. Tumor embolism and acute arterial occlusion: a systematic review. Surg. Open Sci. 10, 216–222 (2022).
Marcoux, C., Al Ghamdi, S., Manos, D., Keating, M.-M. & Shivakumar, S. P. Natural history of tumor thrombus: a single-centre retrospective study. Blood 134, 2430 (2019).
Lucotti, S. et al. Extracellular vesicles from the lung pro-thrombotic niche drive cancer-associated thrombosis and metastasis via integrin beta 2. Cell 188, 1642–1661.e24 (2025).
Szczerba, B. M. et al. Neutrophils escort circulating tumour cells to enable cell cycle progression. Nature 566, 553–557 (2019).
Aceto, N. et al. Circulating tumor cell clusters are oligoclonal precursors of breast cancer metastasis. Cell 158, 1110–1122 (2014).
Wahab, R., Hasan, M. M., Azam, Z., Grippo, P. J. & Al-Hilal, T. A. The role of coagulome in the tumor immune microenvironment. Adv. Drug Deliv. Rev. 200, 115027 (2023).
Fan, T., Zhao, Q., Chen, J. J., Chen, W.-T. & Pearl, M. L. Clinical significance of circulating tumor cells detected by an invasion assay in peripheral blood of patients with ovarian cancer. Gynecol. Oncol. 112, 185–191 (2009).
Kokudo, T. et al. Survival benefit of liver resection for hepatocellular carcinoma associated with portal vein invasion. J. Hepatol. 65, 938–943 (2016).
Pommergaard, H.-C. et al. Vascular invasion and survival after liver transplantation for hepatocellular carcinoma: a study from the European Liver Transplant Registry. HPB (Oxford) 20, 768–775 (2018).
Addeo, P. et al. Macrovascular venous invasion of pancreatic neuroendocrine tumours: impact on surgical outcomes and survival. HPB (Oxford) 21, 653–661 (2019).
Finn, R. S. et al. Atezolizumab plus bevacizumab in unresectable hepatocellular carcinoma. N. Engl. J. Med. 382, 1894–1905 (2020).
Kurzeder, C. et al. Digoxin for reduction of circulating tumor cell cluster size in metastatic breast cancer: a proof-of-concept trial. Nat. Med. 31, 1120–1124 (2025).
Pawlina, W. & Ross, M. H. Histology: A Text and Atlas: With Correlated Cell and Molecular Biology (Wolters Kluwer, 2020).
Sung, H. et al. Global Cancer Statistics 2020: GLOBOCAN estimates of incidence and mortality worldwide for 36 cancers in 185 countries. CA Cancer J. Clin. 71, 209–249 (2021).
Ewels, P., Magnusson, M., Lundin, S. & Käller, M. MultiQC: summarize analysis results for multiple tools and samples in a single report. Bioinformatics 32, 3047–3048 (2016).
Dobin, A. et al. STAR: ultrafast universal RNA-seq aligner. Bioinformatics 29, 15–21 (2013).
McKenna, A. et al. The Genome Analysis Toolkit: a MapReduce framework for analyzing next-generation DNA sequencing data. Genome Res. 20, 1297–1303 (2010).
Liao, Y., Smyth, G. K. & Shi, W. featureCounts: an efficient general purpose program for assigning sequence reads to genomic features. Bioinformatics 30, 923–930 (2014).
Cingolani, P. et al. A program for annotating and predicting the effects of single nucleotide polymorphisms, SnpEff: SNPs in the genome of Drosophila melanogaster strain w1118; iso-2; iso-3. Fly 6, 80–92 (2012).
Tamborero, D. et al. Cancer Genome Interpreter annotates the biological and clinical relevance of tumor alterations. Genome Med. 10, 25 (2018).
Huber, W. et al. Orchestrating high-throughput genomic analysis with Bioconductor. Nat. Methods 12, 115–121 (2015).
Virtanen, P. et al. SciPy 1.0: fundamental algorithms for scientific computing in Python. Nat. Methods 17, 261–272 (2020).
Davidson-Pilon, C. lifelines: survival analysis in Python. J. Open Source Softw. 4, 1317 (2019).
Waskom, M. seaborn: statistical data visualization. J. Open Source Softw. 6, 3021 (2021).
Vallat, R. Pingouin: statistics in Python. J. Open Source Softw. 3, 1026 (2018).
Harris, C. R. et al. Array programming with NumPy. Nature 585, 357–362 (2020).
Collaborative data science. Plotly Technologies https://plot.ly (2015).
Pollard, T. J., Johnson, A. E. W., Raffa, J. D. & Mark, R. G. tableone: an open source Python package for producing summary statistics for research papers. JAMIA Open 1, 26–31 (2018).
Castro-Giner, F., Aceto, N. & Ligorio, M. Dataset relate to article: ‘Macrovascular infiltration and spikes in circulating tumor cells in cancer patients approaching end of life’ [Data set]. Zenodo https://doi.org/10.5281/zenodo.15829402 (2026).
Acknowledgements
Research in the Ligorio laboratory is supported by the Cancer Prevention & Research of Texas Recruitment of First-Time Tenure-Track Faculty Members Grant (RR200023), an R37 National Institute of Health Cancer Institute Grant (5R37CA242070), American-Italian Cancer Foundation Post-Doctoral Research Fellowship to Giada Pontecorvi, PhD (2022–2024), and the Department of Surgery and the Harold C. Simmons Comprehensive Cancer Center at UTSW Medical Center. A special thanks to the current and previous members of the Ligorio laboratory, as well as R. Hammer, S. Comerford, R. Napier, C. Lewis, R. Nix, T. Harris and C. Rodriguez, for their support. Research in the Aceto laboratory is supported by the European Research Council (101001652), the strategic focus area of Personalized Health and Related Technologies at ETH Zurich (PHRT-960), the Swiss National Science Foundation (212183), the Swiss Cancer League (KLS-5636-08-2022), the ETH Lymphoma Challenge (LC-02-22) and ETH Zürich. We acknowledge the assistance of the University of Texas Southwestern Tissue Management Shared Resource, a shared resource at the Simmons Comprehensive Cancer Center, which is supported in part by the National Cancer Institute (award P30 CA142543). We would also like to thank the UTSW Willed Body Program, as well as Visiting Nurse Association Hospice of Texas, Faith Presbyterian Hospice and Pathway Hospice for their partnership on this project and for hospice patients and their families.
Ethics declarations
Competing interests
N.A. is a co-founder and board member of PAGE Therapeutics AG, Switzerland; is listed as an inventor on patent applications related to CTCs; serves as a paid consultant for companies with an interest in liquid biopsies and is a shareholder of Novartis. The other authors declare no competing interests.
Peer review
Peer review information
Nature Medicine thanks Tobias Janowitz, Paolo Tarantino, Min Yu and the other, anonymous, reviewer(s) for their contribution to the peer review of this work. Primary Handling Editor: Ulrike Harjes, in collaboration with the Nature Medicine team.
Additional information
Publisher’s note Springer Nature remains neutral with regard to jurisdictional claims in published maps and institutional affiliations.
Extended data
Extended Data Fig. 1 Representative H&E images of tumor emboli found in vessels of patients with cancer in the UTSW retrospective cohort.
Representative H&E images showing tumor emboli in small (top rows), medium (middle rows), and large (bottom row) caliber arteries (left columns) and veins (right columns). For each example, a high-magnification image displaying the pathological features of tumor emboli is provided. rPt = retrospective patient.
Extended Data Fig. 2 Proportions of patients in the UTSW retrospective cohort with tumor emboli.
a, The image shows bar plots representing the proportions of patients with tumor emboli by cancer type. b, The image shows a bar graph representing the proportions of patients with tumor emboli in non-primary tumor sites stratified by cancer type. P-values indicate the significance of chi-square tests comparing the absolute counts of patients with and without tumor emboli (a) and tumor emboli at non-primary tumor sites (b).
Extended Data Fig. 3 Characteristics of macrovascular infiltration in the UTSW retrospective cohort.
a, Bar graph representing the frequency distribution of vessels with radiological signs of macrovascular infiltration in patients from the UTSW retrospective cohort. b, A heat map displaying the joint frequency distribution of infiltrated vessels and cancer types (log scale color bar).
Extended Data Fig. 4 Overview of the inclusion and exclusion criteria in the UTSW prospective cohort.
The flowchart shows the inclusion/exclusion criteria applied to enroll patients in the UTSW prospective cohort: patients with cancer = study patient cohort, and patients without a known cancer = control patient cohort. HIV = human immunodeficiency virus; HCV = hepatitis C virus; HBV = hepatitis B virus; VNA = The Visiting Nurse Association of Texas.
Extended Data Fig. 5 Temporal changes in CTC counts, serum tumor markers, and INR for patients in the UTSW prospective cohort.
a, Plasmatic levels of tumor markers over time. Each point in the plots represents an individual patient/tumor marker value. The bold red line represents a curve fitting data using a polynomial regression model. In this panel, the ‘−1’, ‘−2’, and ‘−3’ in the x-axis refer to the closest, second closest, and third closest visit before death, respectively. b, INR values for each patient at each visit. Each point in the plots represents an individual patient/INR value. The bold red line represents a curve fitting patient data using a polynomial regression model. ‘−1’, ‘−2’, and ‘−3’ in the x-axis refer to the first, second, and third closest visits before death, respectively. P-value indicates the statistical significance of a two-sided Wilcoxon signed-rank test comparing the earliest available versus final values for each patient. c, A box and whisker plot representing fold changes in the plasmatic levels of CTCs identified in post- versus premortem blood samples for both patients with (n = 21) and without cancer (n = 9). Each point represents individual patient values. P-value indicates the significance of performing a two-sided Mann-Whitney U test comparing the groups. Box plots indicate 25th, 50th, and 75th percentiles, and whiskers represent the range of values within 1.5 interquartile ranges of the 25th and 75th percentiles. d-g, Graphs depicting changing blood levels of CTCs over pseudo-time, that is, patient visits (d-f), or actual time (g). Each point in the plots represents individual patient/CTC values. The number of patients for each visit is provided at the bottom. The bold red line represents a curve fitting patient data using either a locally estimated scatterplot smoothing (LOESS model or a polynomial regression model. d-f, The numbers ‘0’, ‘−1’, ‘−2’, and ‘−3’ in the x-axis refer to the rapid autopsy procedure, closest, second closest, third closest visit before death, respectively. P-values indicate the statistical significance of two-sided Wilcoxon signed-rank tests comparing the earliest available versus final values for each patient. INR = international normalized ratio; A(t0) = autopsy; CTCs = circulating tumor cells; Pts = patients.
Extended Data Fig. 6 Overview of pre- and post-mortem CTC counts in the UTSW prospective cohort patients.
Pie charts showing the relative frequencies of single CTCs and CTC clusters for each patient at pre-mortem and autopsy time points, and for each CTC type at autopsy for the prospective cancer cohort. ‘0’, ‘−1’, ‘−2’, and ‘−3’ refer to the rapid autopsy procedure, closest, second closest, third closest visit before death, respectively. CTCs = circulating tumor cells; IVC = inferior vena cava; SVC = superior vena cava; BC = breast cancer, PDAC = pancreatic ductal adenocarcinoma; NSCLC = non-small cell lung cancer; PB = pancreatobiliary cancer; SCLC = small cell lung cancer; CRC = colorectal cancer; PCa = prostate cancer; ESCA = esophageal cancer; RCC = renal cell cancer; MMMT = malignant mixed mesodermal tumor; pPt = prospectively enrolled patient.
Extended Data Fig. 7 Representative gross and microscopic images of macrovascular infiltration in the UTSW prospective cohort patients.
Representative images illustrating macrovascular infiltration by surrounding tumor masses identified during the rapid (that is, warm) autopsy procedure in prospectively enrolled patients with multiple solid malignancies. From left to right, images from the en bloc resection, the gross examination of the resected specimen, and the paired H&E-stained slides demonstrate evidence of macrovascular infiltration at low and high magnification. NSCLC = non-small cell lung cancer; PB = pancreatobiliary cancer; BC = breast cancer; CRC = colorectal cancer; PCa = prostate cancer; ESCA = esophageal cancer; RCC = renal cell carcinoma; CRC = colorectal cancer; pPt = prospectively enrolled patients.
Extended Data Fig. 8 Characteristics of macrovascular infiltration in the German retrospective cohort.
a, A bar graph representing the proportions of infiltrated vessels across patients with pancreatic, ovarian, lung, colorectal, and hepatocellular carcinoma from the German retrospective validation cohort. b, A heatmap displaying the joint frequency distribution of infiltrated vessels and cancer types in these patients. c, A bar graph representing the proportions of vessels simultaneously affected in this patient cohort. d, A bar graph representing the proportions of vessels stratified by type of infiltration across patients in the German validation cohort. CRC = colorectal cancer; PDAC = pancreatic ductal adenocarcinoma; HCC = hepatocellular carcinoma.
Extended Data Fig. 9 Multivariate survival analyses using treatment homogeneous groups of patients in the German retrospective cohort.
Plots showing the hazard ratios from time-varying Cox regression models that included metastasis and macrovascular infiltration as time-varying covariates for treatment-homogeneous patient subgroups based on their resection status (presence or absence) and stratified by their tumor type. Along with metastasis and macrovascular infiltration, sex and age were included in the model as covariates. Diamonds indicate hazard ratios corresponding to variables shown on the y-axis with error bars showing the 95% confidence interval for the hazard ratio. CI = confidence interval; CRC = colorectal cancer; PDAC = pancreatic ductal adenocarcinoma; HCC = hepatocellular carcinoma; ovarian = ovarian cancer; lung = lung cancer.
Extended Data Fig. 10 Most frequently infiltrated vessels in patients diagnosed with colorectal, lung, ovarian, pancreatic, and hepatocellular carcinoma.
a-e, Graphs with frequencies of the earliest infiltrated vessels (bar plots, left column), and hazard ratios (right column) resulting from time-varying covariate Cox regression using metastasis, resection status, and earliest infiltrated vessels occurring in ten or more patients for each cancer type. V1+ represents patients with involvement in other vessels or with at least one of these top five infiltrated vessels, with any other vessel(s). Diamonds indicate hazard ratios corresponding to variables shown on the y-axis with error bars showing the 95% confidence interval for the hazard ratio. Hazard ratios were estimated using multivariate, time-varying covariate Cox regression. Mets = metastases; R = resection; IVC = inferior vena cava; CI = confidence interval; CRC = colorectal cancer; PDAC = pancreatic ductal adenocarcinoma; HCC = hepatocellular carcinoma; Pts = patients.
Supplementary information
Rights and permissions
Open Access This article is licensed under a Creative Commons Attribution-NonCommercial-NoDerivatives 4.0 International License, which permits any non-commercial use, sharing, distribution and reproduction in any medium or format, as long as you give appropriate credit to the original author(s) and the source, provide a link to the Creative Commons licence, and indicate if you modified the licensed material. You do not have permission under this licence to share adapted material derived from this article or parts of it. The images or other third party material in this article are included in the article’s Creative Commons licence, unless indicated otherwise in a credit line to the material. If material is not included in the article’s Creative Commons licence and your intended use is not permitted by statutory regulation or exceeds the permitted use, you will need to obtain permission directly from the copyright holder. To view a copy of this licence, visit http://creativecommons.org/licenses/by-nc-nd/4.0/.
About this article
Cite this article
Newcomer, K., Bifolco, A., Reeves, S. et al. Macrovascular tumor infiltration and circulating tumor cell cluster dynamics in patients with cancer approaching the end of life. Nat Med (2025). https://doi.org/10.1038/s41591-025-03966-3
Received: 02 February 2025
Accepted: 18 August 2025
Published: 16 October 2025
Version of record: 16 October 2025
DOI: https://doi.org/10.1038/s41591-025-03966-3


