On conventional out of order processors, instructions are not necessarily executed in “program order”, although the processor must give the same results as though execution occurred in program order. This is achieved by preserving an in-order front-end (fetch, decode, rename) and in-order instruction commit, but allowing the processor to search a limited region of the instruction stream to find independent instructions to work on, before rearranging the instruction results back in their original order and committing them.
The reorder buffer (ROB) is a queue of instructions in program order that tracks the status of the instructions currently in the instruction window. Instructions are enqueued in program order after register renaming. These instructions can be in various states of execution as the instructions in the window are selected for execution. Completed instructions leave the reorder buffer in program order when committed. The capacity of the reorder buffer limits how far ahead in the instruction stream the processor can search for independent instructions. This has been steadily increasing over many processor generations.
The instruction window can also be limited by exhausting resources on the processor other than reorder buffer entries. In physical register file microarchitectures (Pentium 4, Intel Sandy Bridge and newer), the effective instruction window can also be limited by running out of physical registers for renaming.
In this article, I describe a microbenchmark to measure the size of the instruction window and present results for several processor microarchitectures. I also use the same microbenchmark to measure the number of available rename registers on PRF microarchitectures, and show some special cases where certain instructions are handled without consuming physical rename registers.
Measuring Instruction Window Size
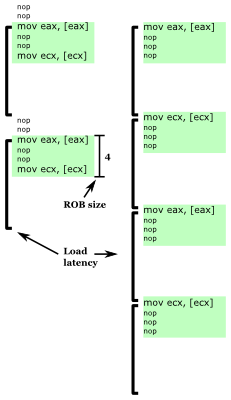
Fig. 1: Microbenchmark example showing two iterations of the microbenchmark inner loop for ROB size of 4 instructions, with three instructions per load (left) and four instructions per load (right). Loop latency nearly doubles when enough nops are inserted so that the next load does not fit in the ROB.
The instruction window constrains how many instructions ahead of the most recent unfinished instruction a processor can look at to find instructions to execute in parallel. Thus, I can create a microbenchmark that measures the size of the instruction window if it has these two characteristics: It uses a suitable long-latency instruction to block instruction commit, and it is able to observe how many instructions ahead the processor is able to execute once instruction commit is stalled.
A good long-latency instruction to use is a load that misses the cache. A typical cache miss latency is greater than 200 clock cycles, enough time to fill the reorder buffer with other instructions. One way to get a single load to consistently miss in the cache is to do pointer chasing in an appropriately-initialized array, like the method used to measure cache system behaviours.
The method I used to detect how far ahead of a cache miss a processor can examine is to place another cache miss some number of instructions after a first cache miss. When the first cache miss is blocking instruction commit, if the second cache miss is within the instruction window, then the two cache misses are overlapped (memory-level parallelism), but if it is outside the instruction window, the two memory accesses are serialized. NOP is a good filler instruction in between the memory loads because it executes quickly, has no data dependencies, and occupies a reorder buffer entry.
Figure 1 shows an example of the behaviour of two inner-loop iterations of this microbenchmark for a reorder buffer size of 4. When there are only three instructions per load (mov, nop, nop, mov, nop, nop, ...), the processor is able to search ahead to the next mov while stalled on the first, so that two cache misses can be partially overlapped, leading to executing one iteration of the loop for every cache miss time (plus a few nops). When enough nops are inserted so that the next cache miss cannot fit into the instruction window (mov, nop, nop, nop, mov, nop, nop, nop, ...), the two cache misses are serialized and one loop iteration takes nearly twice as long, executing one iteration in the time of two cache misses (plus a few nops).
Reorder Buffer Capacity
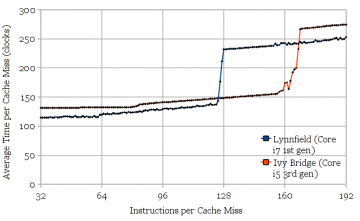
Figure 2 shows the results of using the microbenchmark to measure the reorder buffer size of Intel’s Ivy Bridge and Lynnfield (similar to Nehalem) microarchitectures. The measured values (168 and 128, respectively) agree with the published numbers. The stepwise increase in execution time caused by serializing the two cache misses is clearly visible in the graphs. The slight slope upwards reflects the execution throughput of NOPs.
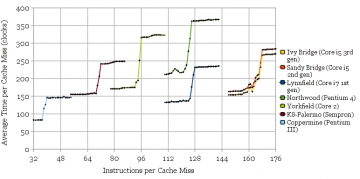
Figure 3 shows results for other microarchitectures, with the curves cropped to the region of interest, for clarity. Again, the measurements agree with published numbers for all of the microarchitectures.
Fig 3: Reorder buffer capacities for several other microarchitectures: Ivy Bridge (168), Sandy Bridge (168), Lynnfield (128), Northwood (126), Yorkfield (96), Palermo (72), and Coppermine (40).
Hyper-Threading
On processors with Hyper-Threading, the reorder buffer is partitioned between two threads. It is known that this partitioning is static (and it makes sense to partition statically anyway), so each thread gets half of the ROB entries. One interesting question is whether this static partitioning occurs only when both thread contexts are active, or whether it’s permanently partitioned whenever Hyper-Threading is enabled.
Tests on Lynnfield (1st generation Core i7) and Northwood (Pentium 4) show that this partitioning occurs only when both thread contexts are active. Two copies of the microbenchmark pinned to two thread contexts on the same core shows half the ROB capacity when both thread contexts are active, but full capacity when one thread context is idle. Good.
Physical Register File Size
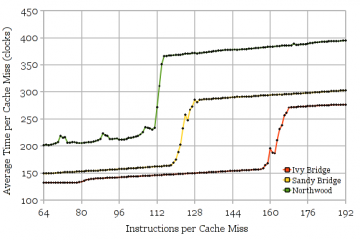
Fig. 4: Measuring the size of the speculative portion of the physical register file. Northwood (around 115), Sandy Bridge and Ivy Bridge (around 130-135).
Measuring the reorder buffer size uses nop instructions to separate the memory loads. This is ideal because nop instructions consume reorder buffer entries, but not destination registers. On microarchitectures that rename registers using a physical register file (PRF), there are often fewer registers than reorder buffer entries (because some instructions don’t produce a register result, such as branches). If the filler instruction is changed from nop to one that produces a register result (ADD), I can measure the size of the speculative portion of the PRF.
Note that since the PRF holds both speculative and committed register values, I cannot measure the size of the entire PRF, only the portion holding speculative values. However, if we assume that published PRF sizes are correct, the difference would indicate the number of registers used for architectural state, which includes both x86 ISA-visible state as well as some extra architectural registers for internal use.
Figure 4 shows the results for microarchitectures that use a physical register file. The Pentium 4 Northwood appears to have 115 speculative PRF entries. Since the PRF size is expected to be 128 entries, that means 13 registers are used for non-speculative state. Sandy Bridge and Ivy Bridge appear to have 131. The noisy region between 118 and 131 registers hints at some non-ideal behaviour in reclaiming unused registers (in exchange for simpler hardware?), resulting in fewer registers being available for use some but not all of the time. Assuming the expected 160-entry PRF leaves 29 registers of non-speculative state. This seems somewhat high even considering that SNB/IVB are 64-bit (16 architectural integer registers) and Northwood is 32-bit (8 architectural integer registers).
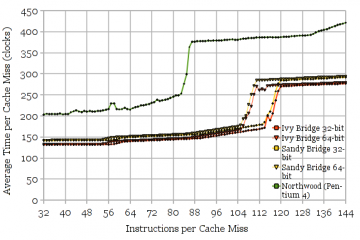
Fig. 5: FP/SSE Physical Register File Size. Sandy Bridge and Ivy Bridge have 120 available speculative entries (32-bit mode). Northwood has 87.
The same experiment (Figure 5) can be repeated with a 128-bit SSE (or 256-bit AVX) instruction to measure the size of the floating-point and SSE PRF. As before, there are more registers used for non-speculative state than expected. Sandy Bridge and Ivy Bridge should have 144 registers (120 available for speculative state), and Northwood should have 128 registers (87 available for speculative state). Interestingly, there are 9 fewer speculative registers (111 vs. 120) in 64-bit mode than 32-bit, probably for YMM8-15 that are inaccessible in 32-bit mode. I can’t explain why so many registers are needed for non-speculative state (24 to 41), since the ISA-visible state mainly consists of 8 x87 floating-point registers, and 8 or 16 XMM or YMM registers.
x86 Zeroing Idiom and MOV Optimization
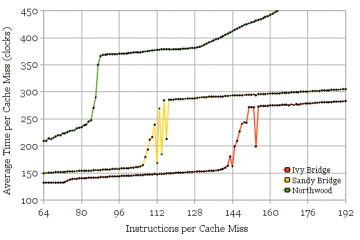
Fig. 6a: Ivy Bridge executes MOV instructions without consuming destination registers (limited by 168-entry ROB), while Sandy Bridge and Northwood do (limited by speculative portion of PRF).
A common x86 idiom for zeroing registers is to XOR a register with itself. Processors usually recognize this sequence and break the dependence on the source register value. In PRF microarchitectures, it may be possible to optimize this even further and point the renamer entry for that register to a special “zero” register, or augment the renamer with a special value indicating the register holds a value of zero, and not require any execution resources for the instruction. I can test for the zeroing idiom by repeating the above test using XOR reg, reg instructions and observing whether those instructions consume destination registers. Both Sandy Bridge and Ivy Bridge can zero registers without consuming destination registers, while Northwood does consume destination registers. (Graphs not shown)
Fig. 6b: Ivy Bridge MOV optimization for 256-bit MOVDQA instructions (128-bit MOVDQA for Northwood). Fewer registers are used, but there is something other than the ROB size that limits the instruction window.
I can measure some other microarchitecture features by changing the instruction used, similar to the previous section.
Repeating the test with MOV instructions can show whether register to register moves are executed by manipulating pointers in the register renamer rather than copying values. This is a known new feature in Ivy Bridge. Figure 6 shows that it is indeed new in Ivy Bridge. Oddly, when the source and destination registers are the same, this optimization does not happen, nor is the operation treated as a NOP. Figure 6b shows the results for using 256-bit AVX MOVDQA. These look strange. It is also strange that Ivy Bridge’s instruction window is lower than the ROB size of 168 entries, as though registers were still consumed, though fewer.
Unresolved Puzzle
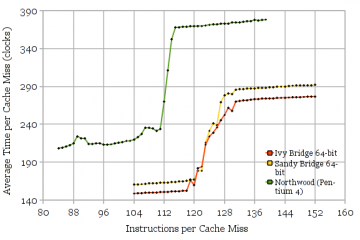
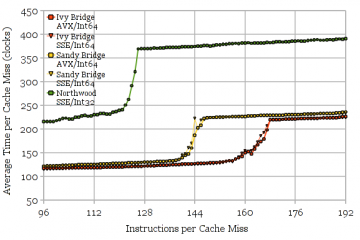
Fig. 7: Sandy Bridge executing interleaved 256-bit AVX and 64-bit addition instructions is limited to a 147-instruction window, which is greater than both PRFs, but smaller than the ROB
We know that in both Sandy/Ivy Bridge and Northwood, there are separate floating-point/SSE/AVX and integer register files. If I use instructions that do not produce a destination register (nop), the instruction window is limited by the ROB size. Similarly, if I use instructions that produce an integer or AVX/SSE result, the instruction windows becomes limited by the integer or FP/SSE register file instead. If I alternate between integer and SSE/AVX instructions, I would expect that the instruction window becomes ROB-size limited again, since the demand for registers is spread across two register files.
Figure 7 shows the results of this experiment. Ivy Bridge and Northwood behave as expected: AVX or SSE interleaved with an integer addition are limited by the ROB size. Sandy Bridge AVX or SSE interleaved with integer instructions seems to be limited to looking ahead ~147 instructions by something other than the ROB. Having tried other combinations (e.g., varying the ordering and proportion of AVX vs. integer instructions, inserting some NOPs into the mix), it seems as though both SSE/AVX and integer instructions consume registers from some form of shared pool, as the instruction window is always limited to around 147 regardless of how many of each type of instruction are used, as long as neither type exhausts its own PRF supply on its own. That is, when AVX instructions < ~110 and integer instructions < ~130, the instruction window becomes limited to ~147, regardless of how many of each type are in the instruction window. I can’t think of any reason why SSE/AVX and integer register allocations should be linked. This strange behaviour appears to be fixed in Ivy Bridge, but Figure 6b shows Ivy Bridge still has some strangeness in its AVX register allocation…
Conclusion
Using two chains of pointer chasing with filler instructions is a powerful tool to find out certain details about a processor’s microarchitecture. I’ve shown how to use it to measure the reorder buffer size, the number of available speculative registers in physical register files, and measure the existence of several related optimizations. This is not an exhaustive list, but I need to get back to doing real work now…
Code
Caution: Not well documented.
Cite
- H. Wong, Measuring Reorder Buffer Capacity, May, 2013. [Online]. Available: https://blog.stuffedcow.net/2013/05/measuring-rob-capacity/
[Bibtex]@misc{measuring-rob, author={Henry Wong}, title={Measuring Reorder Buffer Capacity}, month={may}, year=2013, url={https://blog.stuffedcow.net/2013/05/measuring-rob-capacity/} }
.png)

