.png)


GitHub recently released their Engineering System Success Playbook (ESSP), which gives their take on the right set of metrics for a software engineering organization to measure, as well as some valuable recommendations for rolling out a metrics framework as a core management tool. I found their take on metrics very thoughtful, and a great capture of current best practice thinking.
But reading this framework, I also bumped into some familiar gaps I previously encountered when reading other proposed models such as SPACE and Core 4, especially around business impact measures which are simultaneously important productivity indicators and also key performance concerns of stakeholders such as the Board and exec team.
In this post, I look at these persistent gaps that appear across various metrics frameworks, and examine why they are valuable considerations when designing a metrics strategy. I also consider the question of why these gaps arose in the first place and what it is about the design goals of metrics frameworks that are leading them to miss on these more business-oriented themes.
Before minding the gaps, it’s worth taking a look at the Github Engineering System Success Playbook. From a metrics perspective, their framework proposes twelve specific metrics organized into four areas, which they call “engineering success zones.”
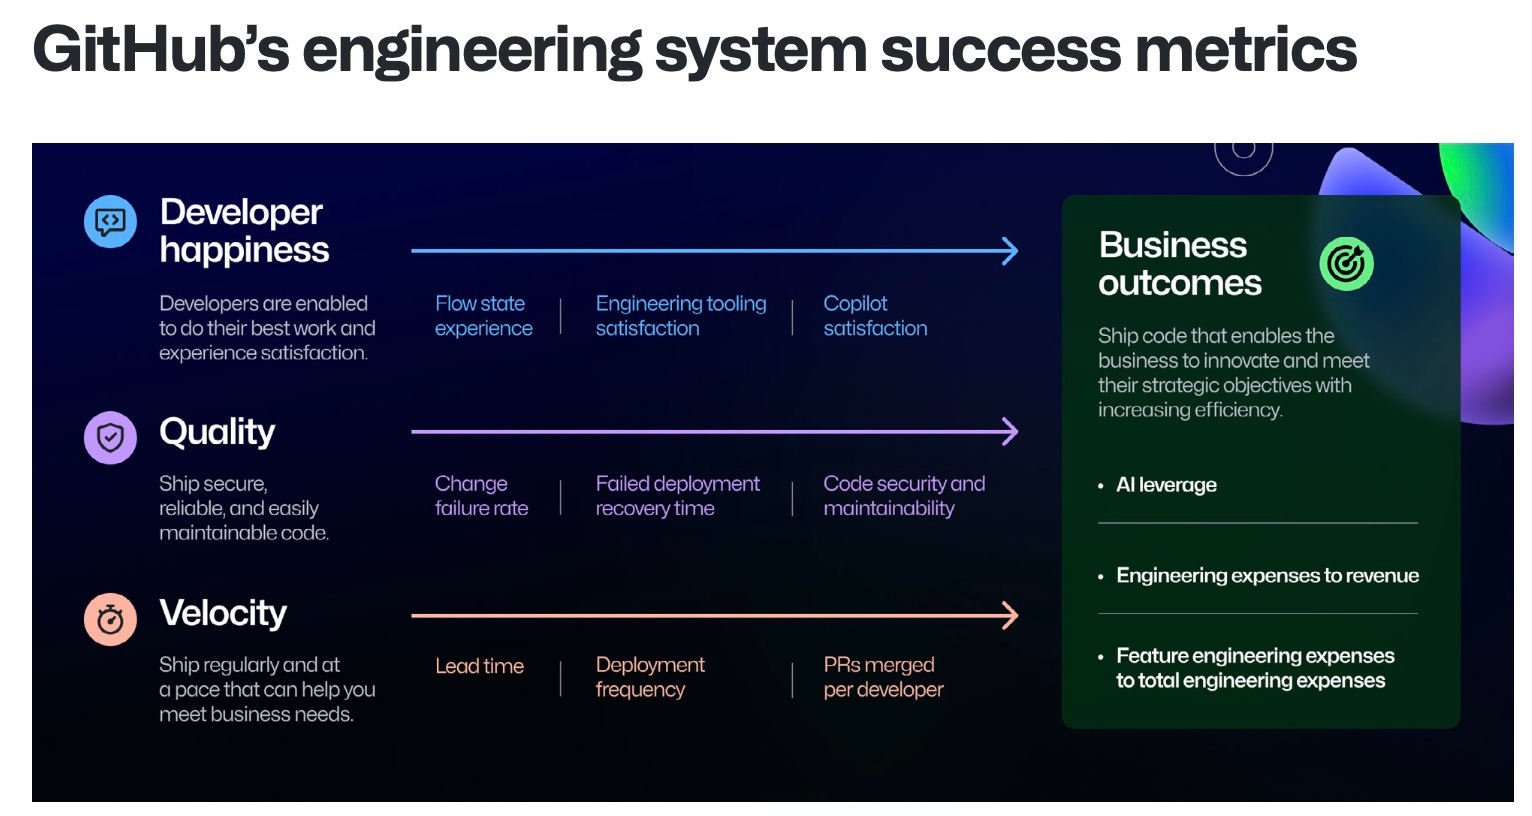
It’s immediately clear, and actually discussed explicitly in the writeup, that these zones are inspired by the categories in other models such as SPACE and Core 4. The diagram below depicts a mapping from the original categories proposed in the SPACE framework paper to the zones in the GitHub ESSP and the Core 4 categories.
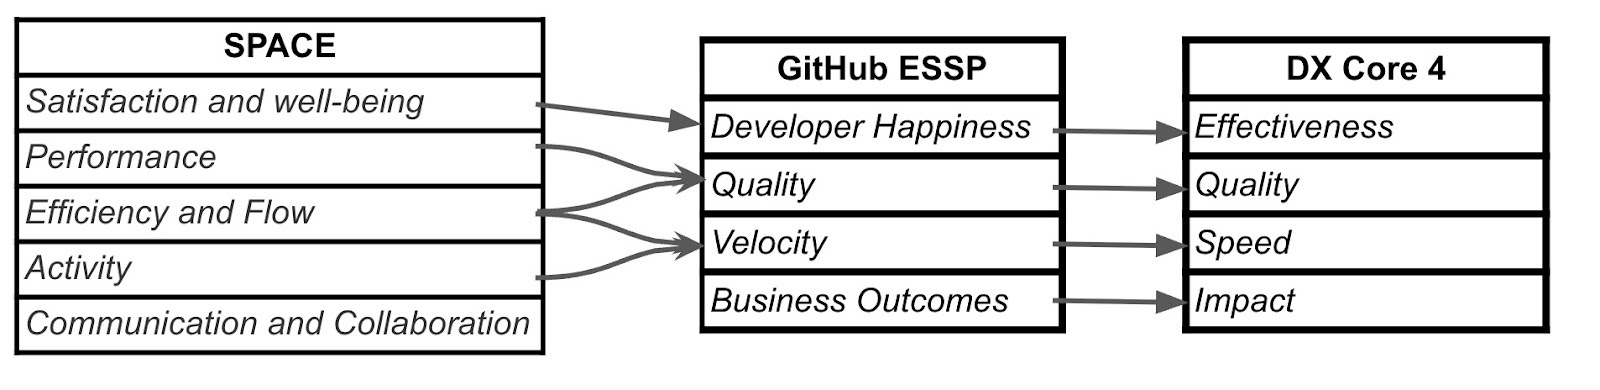
ESSP and Core 4 both hew closely to the SPACE proposal, but are more opinionated in the specific metrics they propose in each category, which is helpful from an “ease of adoption” standpoint. And both refine the clarity of the SPACE proposal in similar ways. They cleanly pull out the idea of Quality which is mixed up in the Performance and Efficiency categories of SPACE. And both simplify the notion of Velocity.
Perhaps the biggest departure from SPACE in the ESSP (and Core 4) is the introduction of a business impact category. In terms of employing the framework in a commercial setting, this addition seems absolutely critical. Stakeholders don’t just want to know that the Engineering function is happy and executing well, but also that they are driving outcomes for the business.
It’s also interesting that the ESSP removes the Communication and Collaboration category from SPACE. The explanation behind this is actually fairly relevant. The ESSP proposal talks about the importance of distinguishing between “leading” and “lagging” indicators. The metrics they propose for zones are focused on lagging indicators – metrics that are closer to outcomes and happen after the work has been done. The argument goes that these are preferable types of metrics to serve as the top level scorecard for organizational effectiveness. But they also call out the importance of selecting appropriate leading indicators that are closer to potential sources of friction as work is being done (outside of the framework). They note that Communication and Collaboration are good examples of useful leading indicators.
Reading the ESSP, especially given its noticeable similarity to Core 4, I couldn’t help but trip on gaps in the proposal that seem to be recurring in the growing set of “metrics framework” proposals.
Perhaps the most surprising omission from the ESSP (and also Core 4) is the notion of delivery predictability. This omission is frankly surprising to me since delivery predictability is among the top asks from executive peer stakeholders, as well as customers (especially in enterprise businesses that require adequate time to plan for adopting new or changed features).
My proposal to anyone designing a metrics strategy is simple: include a measure of on-time/on-scope delivery percentage of committed work.
Of course, it’s not trivial to measure predictability without establishing some definitions about concepts like “product commitments,” “on-time,” and “on-scope.” I don’t want to minimize the reality that those can be hard to define, especially in today’s world of agile development and continuous delivery. When is a feature “done?” When the first version ships? When we remove the feature flag and open it up to all users? It’s a question that’s open to interpretation..
And definitions alone aren’t sufficient. You need data, which means establishing a system of record to track commitments (Jira? A roadmap tool like Aha!? Or something else entirely?), and what will be the process for who tracks what?
The simple truth is that there are good, practical answers to these questions that have been established in countless organizations, and that create massive benefits beyond measuring delivery predictability. Not the least of these is ensuring that you have a realistic view of resource constraints as you do capacity planning around new projects.
In my experience, taking on delivery predictability as part of your metrics strategy is well worth the investment, and greatly appreciated by stakeholders.
I’ve previously written about why I see investment allocation as such an important concept to measure and manage. You can optimize productivity all you want, but if your team isn’t working on the right projects, it’s all for nothing.
Both the ESSP and Core 4 have nods in this direction. ESSP includes “Percentage of feature engineering expenses to total engineering expenses” as one of their Business Outcome measures, and Core 4 includes “Percentage of time spent on new capabilities.” These are important metrics that are of strong interest to most management teams. But as much as I advocate the idea of keeping metrics simple, easy to understand, and easy to measure, I can’t help feeling that just focusing on “feature dev” as the goal is an oversimplification.
My proposed change is simple. Instead of measuring “percent of feature development,” measure “percent aligned with product strategy,” where the product strategy breaks down allocations by product, and by a slightly more granular set of buckets including “long term innovation,” “near term growth,” “customer driven work,” “technical/platform investments,” and “maintenance/KTLO”. The first three of these are all “feature work” of some form but with very different motivations and value creation horizons.
In terms of quantifying “deviation from target strategy,” a simple and easy to explain formula is to use the absolute sum of differences between ideal allocations and actual observed allocations (either in effort or spend). In other words, if I have a set of allocation categories ai, the following formula shows me the number of percentage points that are were “misallocated” in actuality (so, lower is better):
\(\sum_{i=0}^{n} \frac{\left| a^{\text{ideal}}_i - a^{\text{actual}}_i \right|}{2}\)
Measuring a more granular view of allocations is not much harder than either discerning feature versus non-feature work, or discerning capitalizable software work (a requirement in many software organizations, and definitely not the same thing as simply measuring feature work). Typically it involves some minimal level of rigor in your ticketing system, which you already want for many other reasons (core to what I call "organizational observability”).
So the more granular view is not hard. And the value gained is significant. For stakeholders, it creates a concrete linkage between the stated product strategy (probably the most important artifact in any software team) and actual delivery execution. And furthermore, understanding this view of investment allocation helps set expectations about the types of payoff we can expect.
Setting expectations about downstream business outcomes is critical. Does the product strategy dictate that we should go long on platform expectations? In that case, I should expect downstream payoff in engineering efficiency and velocity. Is the investment thesis long on “big bets”? In that case I should expect to look for leading indicators of product market fit (e.g., trial / beta users, early adopters, etc.) versus a quick boost to bookings.
This level of understanding the game plan and explicitly calling our shots is what Boards and CEOs are hoping to see from us. Not just “lots of feature work.”
The SPACE Framework came out in 2021 prior to the initial release of GitHub Copilot later that year. So unsurprisingly it doesn’t consider the impact of AI on software development. It’s perhaps a little more surprising that Core 4 doesn’t consider AI impact either. But the ESSP, coming from the makers of Copilot, of course considers AI impact as a factor. I think it’s safe to say that it’s increasingly inconceivable for an Engineering leader to have some level of reporting out to stakeholders on AI adoption and impact in their org at this point. AI is transforming the software industry, and every Engineering leader needs to be engaged in the question of what that means for their company.
The ESSP looks at two measures of AI impact. The first, under the “Developer Happiness” zone is “Copilot satisfaction” – basically, a survey based measure of whether Engineers are positive about using Copilot. Putting aside the quibble that this would be better framed as “Satisfaction with the AI coding tools in our environment,” this seems like a positive measure, although perhaps a bit of a leading indicator to help understand whether your AI tooling environment is meeting expectations.
The second and clearly more weighty measure is in the “Business Outcomes” zone, and is called “AI leverage.” AI leverage is defined as “the difference between potential and current AI-driven productivity gains across employees working in engineering.” In other words, we have to have a decent handle on the set of staff that could make use of AI in their jobs, and an assumption about what percentage of their work could be done by AI to provide an upper bound on how much time / money we could be saving with AI. Then we look at how much we actually are saving (perhaps an approximation – such as looking at the percentage of staff actively using AI and assuming they are getting maximum benefit), which then gives us a “percentage of potential AI savings realized.”
The proposal is legitimately interesting, but I think it falls short of what we actually need.
I truly do want to know (or have some approximation) of what percentage of the possible AI adoption I’m achieving. And I want to drive that number up, especially since the goal here is almost certainly a moving target as AI models and tools become more capable. But is understanding adoption really the same as understanding impact?
On the benefits side, I hope that AI displaces much of the toil that the team today has to handle, freeing up time for more of the innovation work. In other words, I hope to see not just time savings, but also more energy put to higher value work, leading to a multiplicative benefit, not just an additive benefit from AI. On the risks side, although I’m confident that models will get better, I am concerned about displacing too much work with inadequate expert human oversight, and, for example, introducing subtle bugs, design flaws, etc. that actually slow me down. I don’t just want AI assistants “doing lots of stuff.” I want them doing good stuff that doesn’t throw a wrench in the works!
The last gap I’d point to is perhaps a bit unfair from the perspective of specifically designing a metrics framework for Engineering. But from the perspective of a practicing Engineering leader who has to design a metrics strategy that will land effectively with their stakeholders, I believe the idea of including measures of Customer Value Realization is absolutely key. In many cases the product function will cover this base, but I’d argue that at the very least, it’s important for the Engineering leader to be involved in what gets presented.
Measuring Customer Value is of course highly product dependent. For some products, it may simply be active usage, such as Monthly or Daily Active Users (MAUs or DAUs). Other products may have specific business oriented metrics – a backup product might measure amount of data under management, a workflow product might measure number of tasks completed, a language translation service might measure number of words translated, and so forth. And multiple of these may need to be triangulated to get a full picture.
Showing these types of metrics in conjunction with Engineering metrics has a couple of big benefits. First, it creates a strong basis to show realized value from prior product enhancements. Showing value realizations lets us close the ROI loop. Secondly, it gives a picture of the “workload under management.” Of course we present core Engineering metrics like effort spent on maintenance. But what is that effort supporting in terms of business value?
Finally, on a qualitative level, showing value realization metrics sets a good tone of Engineering + Business alignment. It means that when we’re talking about ROI from product or technology enhancements, we have a clear view of how that value will be realized by customers.
If you step back and look at the common theme across the gaps I’ve highlighted, it’s mainly about business impact. When managing an organization, especially a function as deep and specialized as Software Engineering, it’s tempting to want to look inward and focus on making that complex and critical group work as well as possible, and avoid mixing in a bunch of other considerations that are outside the sphere of Engineering’s direct control. After all, if the team is functioning well, it’s up to other orgs, especially Product, to make sure that the team is pointed in the right direction.
I believe it’s in this spirit of “focusing on what you can control” and avoiding unnecessary complexity that Engineering metrics proposals avoid mixing in the kinds of more business outcome measures that I’ve highlighted.
While I sympathize with the idea of focus and simplicity, in my experience the intersection between Engineering and the business matters a lot. Part of my bias comes from spending most of my career in startups and scale-ups, but in my experience everything about the way Engineering operates should be deeply informed by the needs of the business, from technical investments and non-functional requirements on feature investments to team process and culture.
These big thematic ways that Engineering needs to “fit” the rest of the company can’t be distilled down to a handful of metrics. But the metrics can provide a baseline of shared context and a jumping off point to ensure alignment. Allocation ensures that we’ve deeply embodied the product strategy. Value realization means we understand the custom value proposition that drives commercial success.
The things we talk about, and focus on in artifacts like our metrics strategy communicate volumes to our teams about what we value. So mind those gaps as you design your own metrics game plan!


