.png)

This article is about how I took the fantastic home energy dashboard designed by George Cave and re-implemented it using Slipway.
As part of the conversion I modularized it so that anyone can plug in their own data providers and rearrange the components, and added a basic theming system so users can customize how it looks.
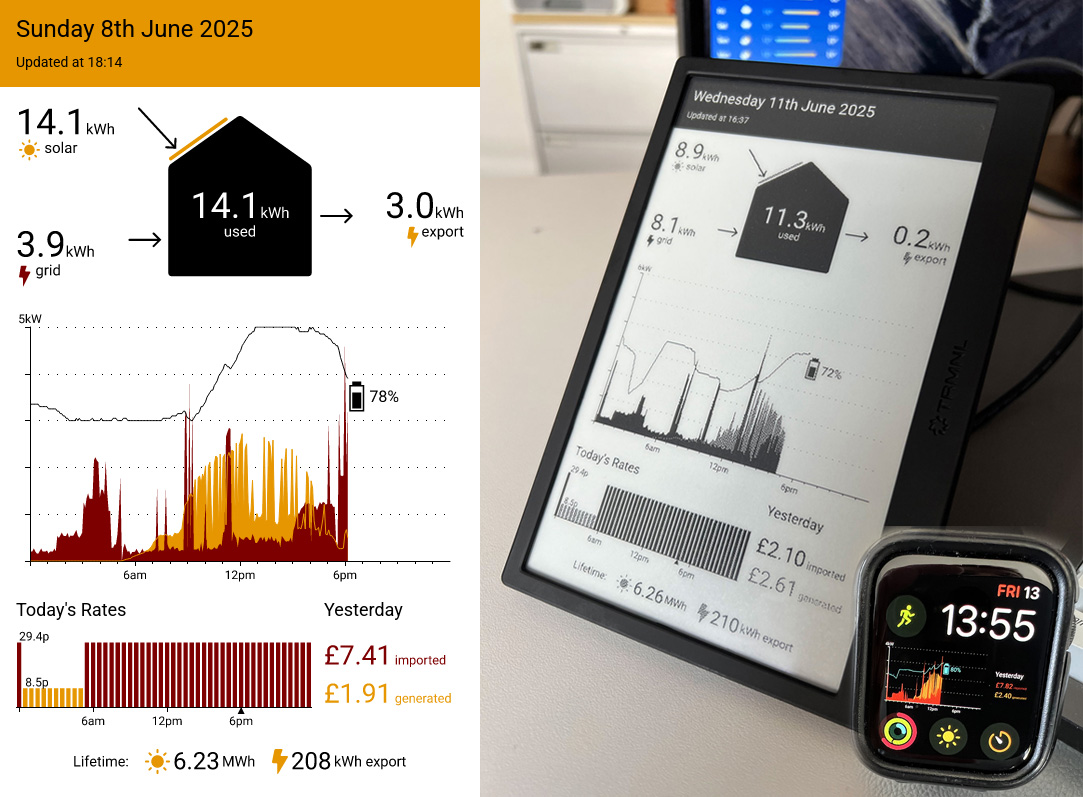
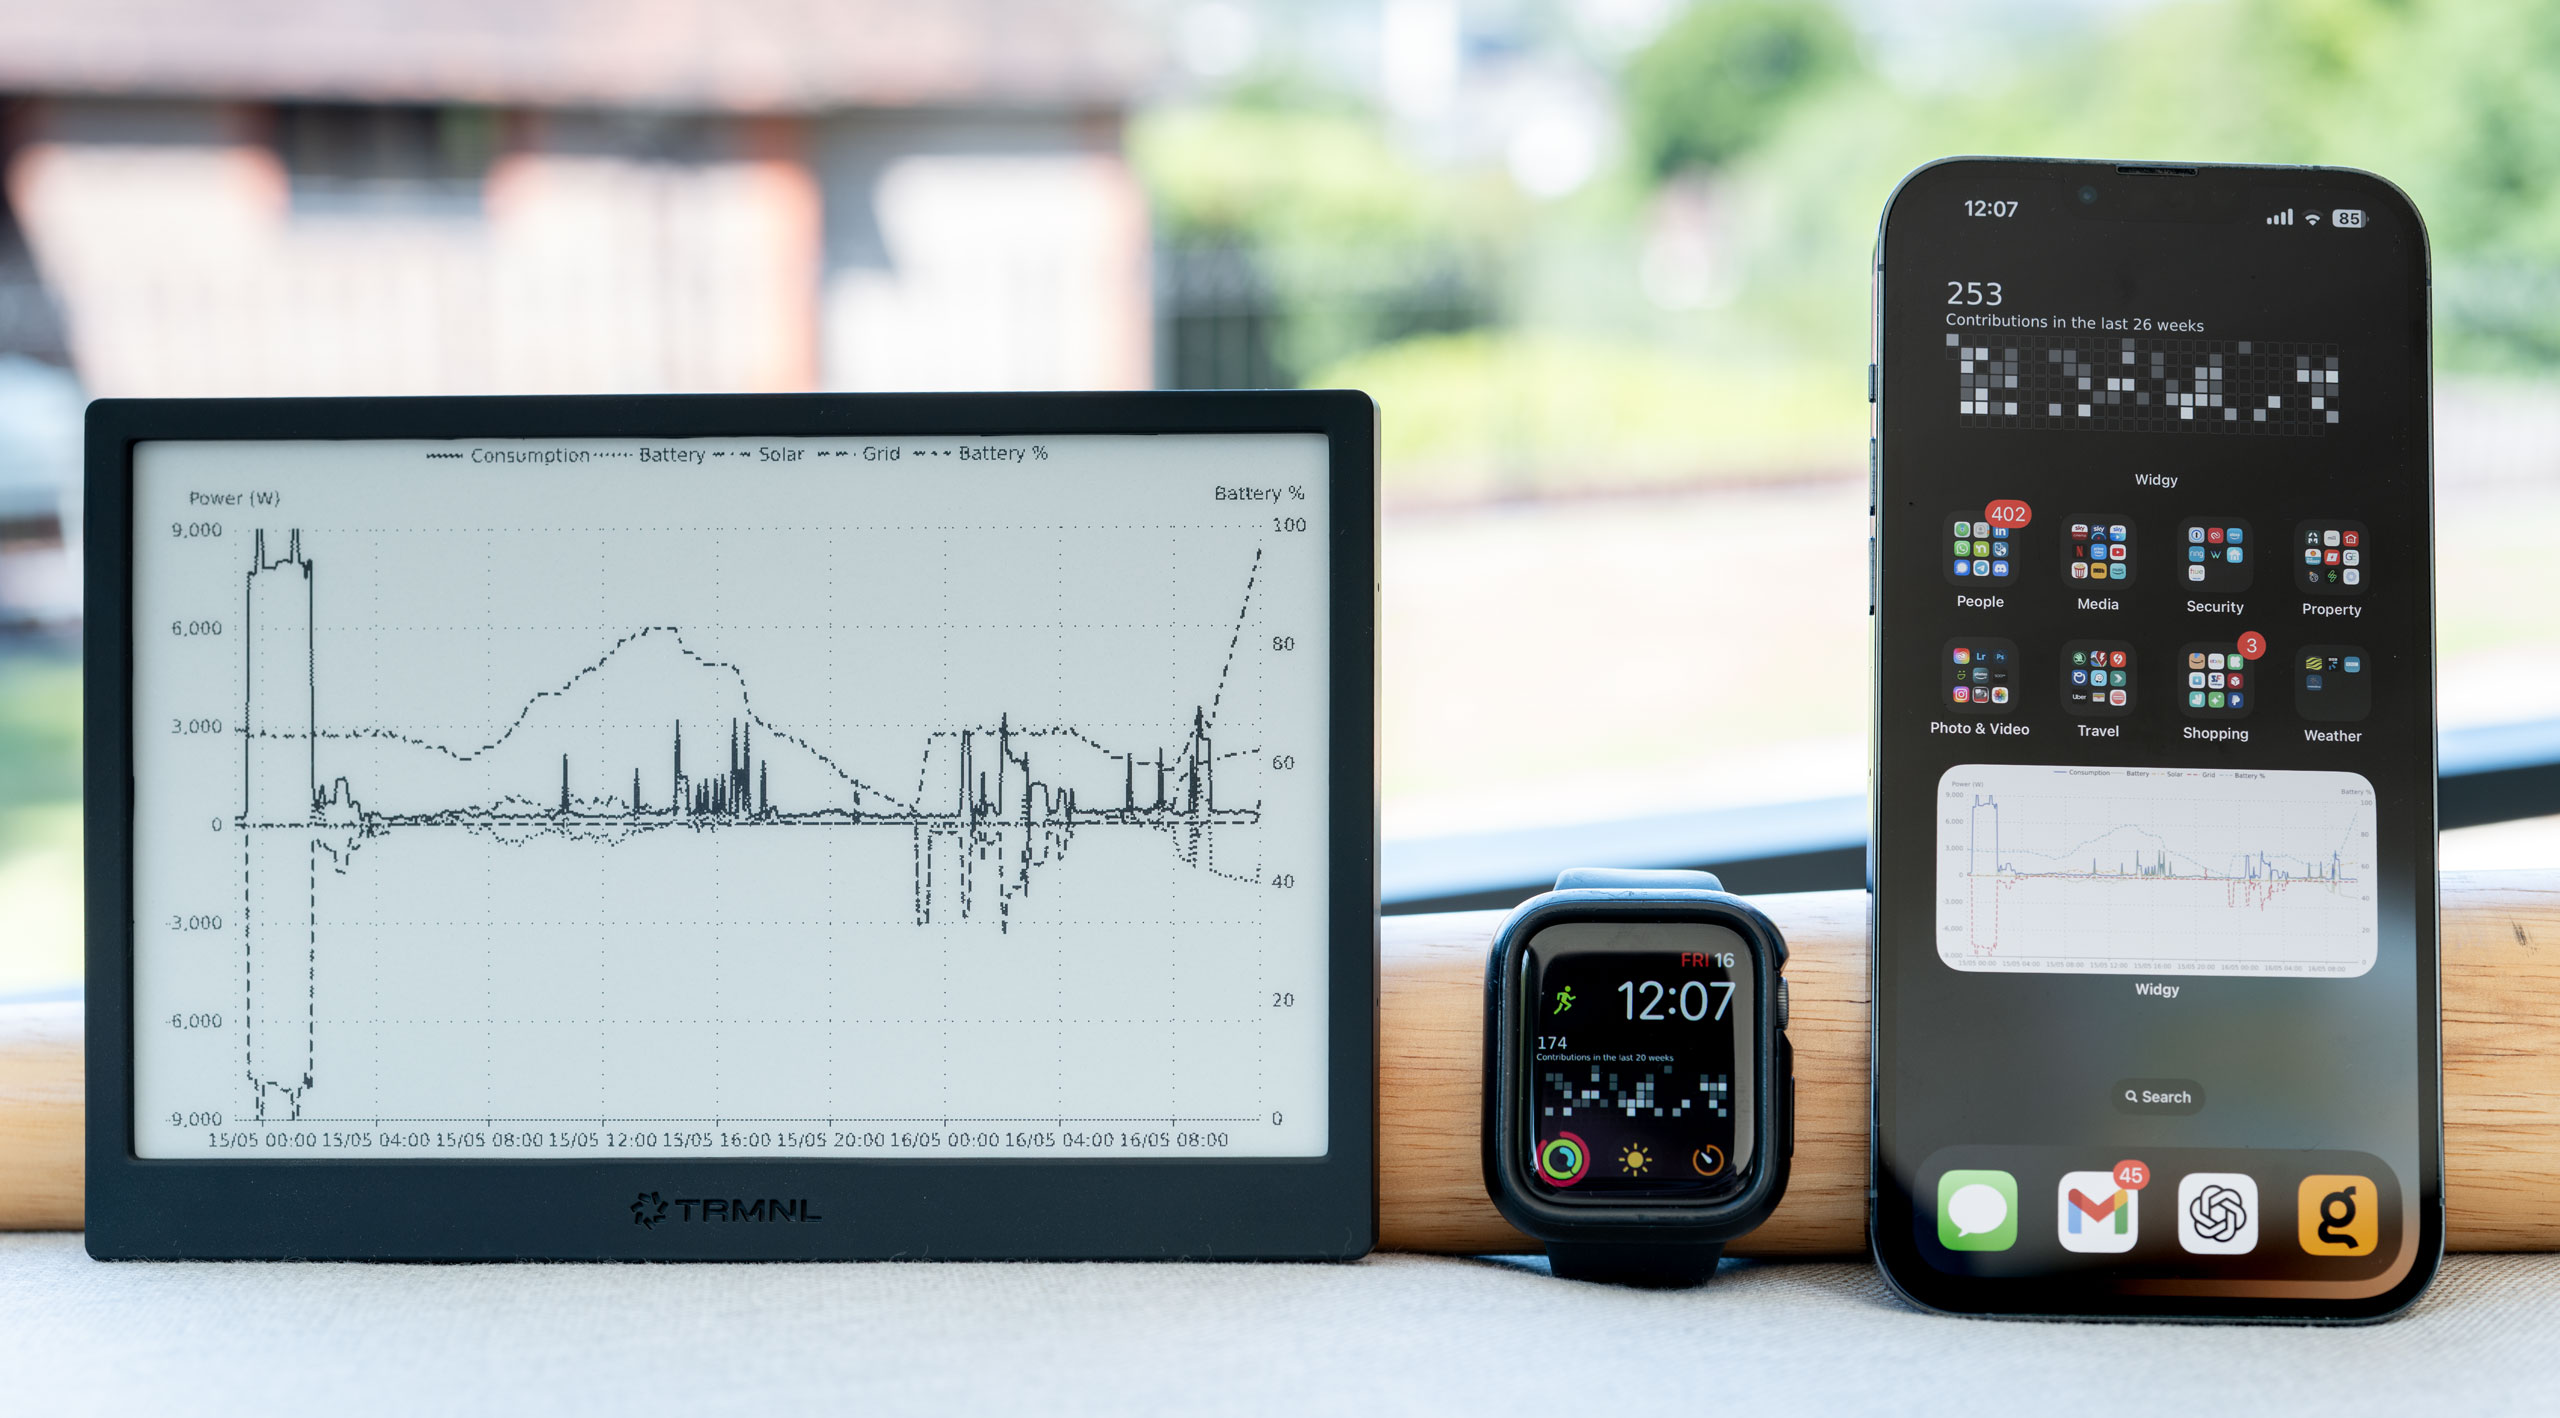
I then deployed it on my own eInk display so that I can see the status of my house battery and power usage at a glance, and as an added bonus I deployed it to my Apple Watch as well.
All this has been done in a way that makes it straightforward for anyone to pick up and use for their own home energy dashboards.
Aspirations
I actually already had a chart running on my eInk display in the kitchen. You can see it here on the left, and also as a color iPhone widget on the right:
I was fairly happy with this setup, it did the job after all, until I saw George Cave's blog post about his own energy dashboard. It was everything that I didn't have the patience, or design chops, to create myself.
Not only that, but it was the perfect example to show how you can use Slipway to build modular, reusable Components that can be assembled into beautiful dashboards.
In this post I go through George's dashboard section by section and build a Slipway Component for each bit. The Slipway version is going to be modular in the sense that:
-
You can plug in your own data providers. Not everyone is going to be with Octopus Energy, or have a GivEnergy battery, so I need to let people swap out those Components with ones relevant to them.
-
You can pick and choose the components, move things around, change the aspect ratio, theme, and supplement it with your own components.
Here's a diagram showing each Component we're going to build, with the two data provider Components in the top left, and lines showing how the data flows from the data providers to the visualizations:
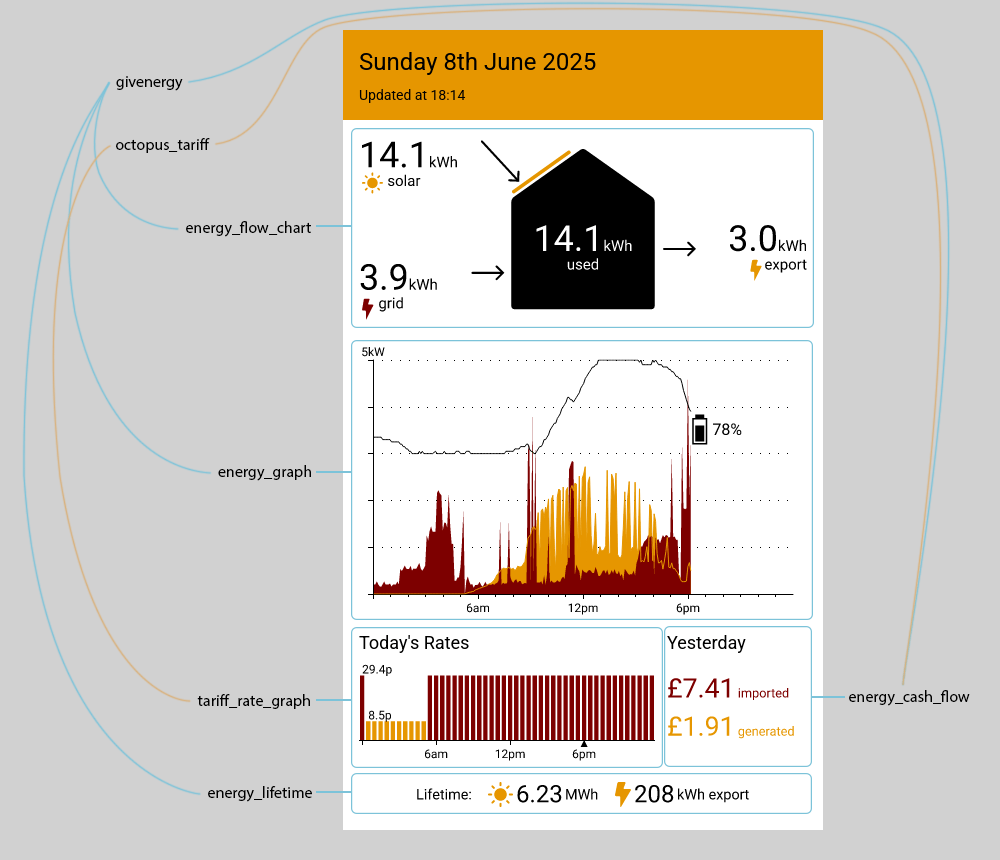
Like George, I have a house battery and solar panels, and an Octopus Energy tariff.
Unlike George my battery comes from a company called GivEnergy, which thankfully provides a much better API than what George had to deal with.
George is using an eInk display which can display red and yellow in addition to black and white, which is a big advantage over mine and makes it really vibrant. However by making the Components themeable I'll ensure that it looks great on both color screens and on my own black and white display.
Setting Things Up
I'm going to start by creating a folder for the project which will contain all the Components, Rigs, and any other files I need.
Aside
In Slipway a Rig is what composes (or, indeed, rigs together) all the Components into a single dashboard.
I'll show how the filesystem looks at various stages as I build the Components.
Environment Variables
I'm also going to ensure any sensitive data I need is in environment variables.
The four variables I'll need for this project are:
- GIVENERGY_API_TOKEN: The API token for the GivEnergy API.
- GIVENERGY_INVERTER_ID: The ID of the inverter to query through the GivEnergy API.
- OCTOPUS_API_TOKEN: The API token for the Octopus Energy API.
- OCTOPUS_ACCOUNT_NUMBER: The account number to query through the Octopus Energy API.
For the remainder of the article you can assume I've got these environment variables populated when I run commands on the terminal.
Server Configuration
I'm going to initialize a Slipway server configuration file which will allow me to display the Rigs and Components in my browser as I build them.
slipway serve . add-api-key
The first command creates a default configuration file called slipway_serve.json.
The second command updates the slipway_serve.json with a randomly generated hashed API key, and displays the unhashed key in the terminal output. I'll copy the unhashed version of the API key and save it somewhere secure for later, as it is this key which will authorize me to view the dashboard in the browser.
Filesystem
└─ slipway_serve.json
Skeleton Rig
Next I'll create a Rig within the server folder structure to display the dashboard:
A Rig is just a JSON file. The file will be created in a rigs folder, and the Rig's permissions will be saved to the slipway_serve.json configuration file.
Slipway uses a deny-by-default permission system for Rigs and Components, but in the above command I specified the --allow-all permission because I'm creating this Rig myself, and so I trust it. We will still have to give each Component explicit permissions, as we'll see later.
Filesystem
├─ slipway_serve.json
└─ rigs
└─ energy_dashboard.json
The energy_dashboard.json currently contains an empty Rig, so I'll flesh this out using George's dashboard as a guide, and using the slipwayhq.render Component to create a basic layout in Adaptive Cards syntax.
Aside
Slipway is renderer agnostic, and has many rendering Components including JSX and SVG, both of which we'll use later. However the slipwayhq.render Component, which uses the Adaptive Cards JSON syntax, is good for laying out other Components.
Here is the skeleton layout:
Show energy_dashboard.jsonenergy_dashboard.json
"rigging": {
"render": {
"component": "slipwayhq.render.0.7.0",
"allow": [
{
"permission": "fonts"
}
],
"input": {
"canvas": {
"width": 480,
"height": 800
},
"card": {
"type": "AdaptiveCard",
"body": [
{
"type": "Container",
"style": "warning",
"bleed": true,
"items": [
{
"type": "TextBlock",
"size": "extraLarge",
"text": "Today's date here",
"wrap": true
},
{
"type": "TextBlock",
"text": "Last updated time here",
"wrap": true
}
]
},
{
"type": "Container",
"height": "stretch",
"items": [
{
"type": "TextBlock",
"text": "Flow chart here"
}
]
},
{
"type": "Container",
"height": "stretch",
"items": [
{
"type": "TextBlock",
"text": "Energy graph here"
}
]
},
{
"type": "ColumnSet",
"height": "stretch",
"columns": [
{
"type": "Column",
"width": "stretch",
"items": [
{
"type": "TextBlock",
"text": "Energy rates here"
}
]
},
{
"type": "Column",
"items": [
{
"type": "TextBlock",
"text": "Yesterday's costs"
}
]
}
]
},
{
"type": "ColumnSet",
"columns": [
{
"type": "Column",
"items": [
{
"type": "TextBlock",
"text": "Lifetime: "
}
]
},
{
"type": "Column",
"items": [
{
"type": "TextBlock",
"text": "X MWh"
}
]
},
{
"type": "Column",
"items": [
{
"type": "TextBlock",
"text": "X MWh export"
}
]
}
]
}
]
}
}
}
}
}
I can view this in my browser by first starting the server...
... and then navigating to the following URL, replacing <API_KEY> with the one I saved earlier:
The browser will display the following image of the rendered dashboard:
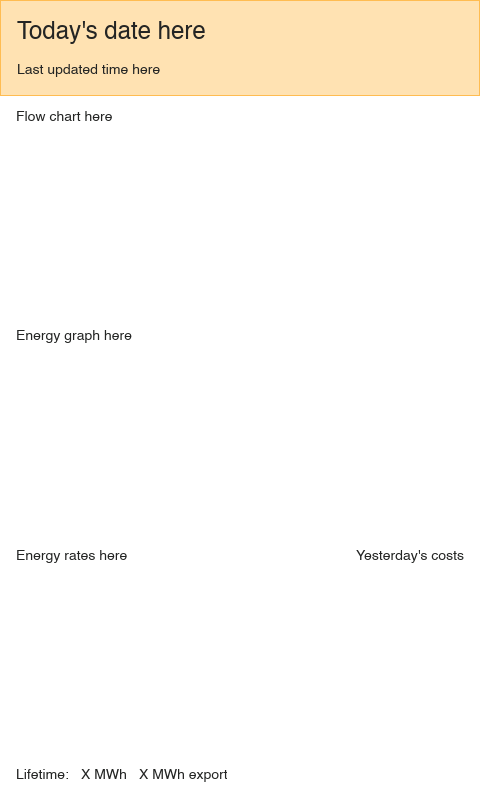
This puts me in a pretty good position to start creating the Components which will fetch the data and render the visualizations.
As I create each Component I can add them to the Rig above, and then as I make changes to the Components I can simply refresh the page in my browser to see my progress.
I'll come back to this Rig at the end, and show the final version.
Creating the Components
We can split the components into two categories: data sources and visualizations.
Data Sources
These Components will fetch data from external sources, and output raw JSON which can be fed into the visualization Components:
- givenergy: This will fetch my solar, battery and power data from the GivEnergy API.
- octopus_tariff: This will fetch my Octopus tariff data from the Octopus API.
If other people want to use this dashboard but have different data providers they can simply swap out these Components for different ones, as long as they output the data in the same structure.
Visualizations
These Components will take the data provided by the data source Components and render each section of the dashboard:
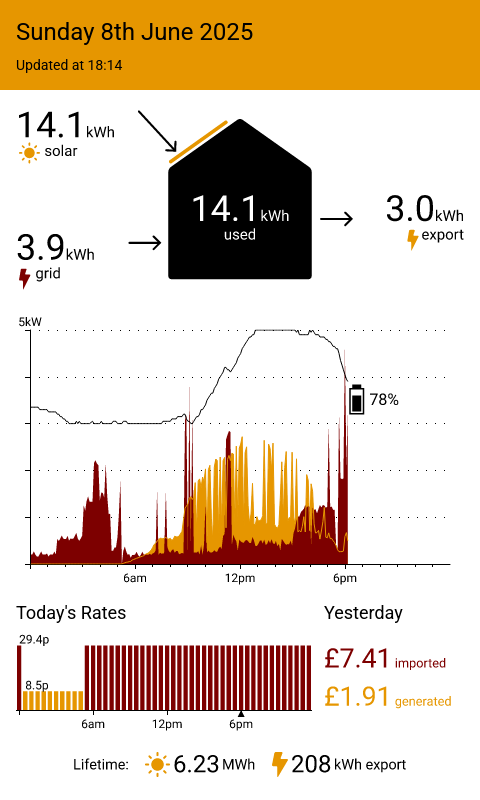
- energy_flow_chart: The top graphic in George's dashboard showing the house.
- energy_graph: The chart showing solar generation, energy usage and battery level over time.
- tariff_rate_graph: The chart showing today's electricity tariff rates throughout the day.
- energy_cash_flow: The box showing what we spent importing and what we were paid exporting.
- energy_lifetime: The final graphic showing the lifetime energy generated and exported.
This is how the Components correspond to the layout of the dashboard:
This is quite a lot of Components, but each one ends up being a fairly small amount of code.
To keep this post a reasonable length I'll just give a brief explanation and show the source code of each one. Don't feel you have to look at every line, the idea is just to give a general idea of what is involved in creating each Component.
Components Folder Structure
Each Component will have its own folder under a parent components folder, and each Component folder will contain a slipway_component.json file which contains the Component metadata.
To quickly create the initial slipway_component.json file for each Component I can run the following from inside the folder, replacing <NAME> with the name of the Component:
For example, in the components/octopus folder I'll run
Prefixing each Component name with energy_dashboard__ is called namespacing the Component, and allows me to publish them all together in a single GitHub repository, while still making them discoverable in the Slipway Component Registry.
info
The Slipway Component Registry is just a thin wrapper around GitHub releases, which is why this convention matters.
My folder structure now looks like this:
Filesystem
├─ slipway_serve.json
└─ rigs
│ └─ energy_dashboard.json
└─ components
├─ energy_cash_flow
│ └─ slipway_component.json
├─ energy_flow_chart
│ └─ slipway_component.json
├─ energy_graph
│ └─ slipway_component.json
├─ givenergy
│ └─ slipway_component.json
├─ energy_lifetime
│ └─ slipway_component.json
├─ octopus_tariff
│ └─ slipway_component.json
└─ tariff_rate_graph
└─ slipway_component.json
All these Components are going to be Javascript Components (rather than WASM Components), and so in addition to the slipway_component.json each one will contain a run.js which exports a run function.
The slipway_component.json and a run.js is literally all that is required to have a functioning Component in Slipway.
The givenergy Component
I already have most the code I need for this one as part of my original dashboard, so all I need is to create the run.js file and paste in the necessary bits, with a few modifications.
The main challenge with this Component is that the GivEnergy API makes you request data page by page, and you end up having to make about 30 requests just to get 2 days worth of data. To speed this up I parallelize the requests as much as possible, which adds some minor complexity to the code.
I'm also careful to use the user's timezone when determining today's date. It's easy to get caught out by this when you live in the UK, as for half the year your timezone is the same as UTC.
Rather than returning the raw GivEnergy API data, I return a simplified version to keep things provider agnostic.
Show run.jsslipway_energy_dashboard/components/givenergy/run.js
const apiToken = input.api_token ?? slipway_host.env("GIVENERGY_API_TOKEN");
if (!apiToken) {
throw new Error("No API token provided. Use the input field or the GIVENERGY_API_TOKEN environment variable.");
}
const inverterId = input.inverter_id ?? slipway_host.env("GIVENERGY_INVERTER_ID");
if (!inverterId) {
throw new Error("No inverter ID provided. Use the input field or the GIVENERGY_INVERTER_ID environment variable.");
}
const requestOptions = {
method: "GET",
body: null,
headers: [
["Authorization", `Bearer ${apiToken}`],
["Content-Type", "application/json"],
["Accept", "application/json"],
],
timeout_ms: null
};
const tz = process.env.TZ;
const todayStr = Temporal.Now.plainDateISO(tz).toString();
const yesterdayStr = Temporal.Now.plainDateISO(tz)
.subtract({ days: 1 })
.toString();
const [yesterdayData, todayData] = await Promise.all([
gatherDayData(yesterdayStr, inverterId, requestOptions),
gatherDayData(todayStr, inverterId, requestOptions),
]);
return {
yesterday: yesterdayData,
today: todayData,
};
}
async function gatherDayData(dayStr, inverterId, requestOptions) {
const page1Url = `https://api.givenergy.cloud/v1/inverter/${inverterId}/data-points/${dayStr}?page=1`;
const page1Result = await slipway_host.fetch_text(page1Url, requestOptions);
const page1Body = JSON.parse(page1Result.body);
const allData = [...page1Body.data];
const meta = page1Body.meta;
if (!meta || !meta.last_page || meta.last_page === 1) {
return allData;
}
const path = meta.path;
const lastPage = meta.last_page;
const promises = [];
for (let page = 2; page <= lastPage; page++) {
promises.push(fetchPage(path, requestOptions, page));
}
const pageResults = await Promise.all(promises);
pageResults.sort((a, b) => a.page - b.page);
for (const p of pageResults) {
allData.push(...p.body.data);
}
const simplifiedPower = allData.map(d => ({
time: d.time,
solar: d.power.solar.power,
grid: d.power.grid.power,
battery: d.power.battery.power,
battery_percent: d.power.battery.percent,
consumption: d.power.consumption.power
}));
const lastData = allData[allData.length - 1];
return {
power: simplifiedPower,
day: lastData.today,
total: lastData.total,
};
}
function fetchPage(path, requestOptions, page) {
const url = `${path}?page=${page}`;
return slipway_host.fetch_text(url, requestOptions).then(result => {
return {
page,
body: JSON.parse(result.body),
};
});
}
Next I need to update the slipway_component.json with the input and output schemas so that Slipway can validate the data. This is particularly useful in dynamically typed languages like Javascript, as it gives us certainty that we're receiving and returning the data we expect. We're using JsonTypeDef here to specify the schemas.
Show slipway_component.jsonslipway_energy_dashboard/components/givenergy/slipway_component.json
"publisher": "jamesthurley",
"name": "energy_dashboard__givenergy",
"version": "1.0.0",
"input": {
"optionalProperties": {
"inverter_id": {
"type": "string"
},
"api_token": {
"type": "string"
}
}
},
"output": {
"properties": {
"today": {
"ref": "day"
},
"yesterday": {
"ref": "day"
}
},
"definitions": {
"day": {
"properties": {
"power": {
"elements": {
"ref": "power"
}
},
"day": {
"ref": "totals"
},
"total": {
"ref": "totals"
}
}
},
"power": {
"properties": {
"time": {
"type": "string"
},
"battery": {
"type": "float64"
},
"battery_percent": {
"type": "float64"
},
"consumption": {
"type": "float64"
},
"grid": {
"type": "float64"
},
"solar": {
"type": "float64"
}
}
},
"totals": {
"properties": {
"ac_charge": {
"type": "float64"
},
"battery": {
"properties": {
"charge": {
"type": "float64"
},
"discharge": {
"type": "float64"
}
}
},
"consumption": {
"type": "float64"
},
"grid": {
"properties": {
"export": {
"type": "float64"
},
"import": {
"type": "float64"
}
}
},
"solar": {
"type": "float64"
}
}
}
}
}
}
I can quickly test this Component with the following command:
I've written the Component so that it can take the Inverter ID and API Token as part of the JSON input but falls back to environment variables.
As I have the environment variables set already I can pass in an empty object for the input, and specify the --allow-env permission so it can access environment variables. We also specify --allow-http so that it can make HTTP requests.
When we put this Component in our Rig we'll tighten up these permissions to only allow API calls to the GivEnergy servers, and only allow access to environment variables starting with GIVENERGY_.
The output contains two sections, today and yesterday, and each of those contains a power section which contains the power data for each part of the day, a day section containing the day's summary, and a total section containing the lifetime summary.
It looks something like this:
Show givenergy Component output"today": {
"power": [
{
"battery": 203,
"battery_percent": 86,
"consumption": 203,
"grid": 0,
"solar": 0,
"time": "2025-05-29T23:03:31Z"
},
{
"battery": 202,
"battery_percent": 86,
"consumption": 203,
"grid": 1,
"solar": 0,
"time": "2025-05-29T23:08:33Z"
},
],
"day": {
"ac_charge": 0.7,
"battery": {
"charge": 0.7,
"discharge": 2.8
},
"consumption": 5.4,
"grid": {
"export": 0.1,
"import": 1.7
},
"solar": 1.8
},
"total": {
"ac_charge": 859.7,
"battery": {
"charge": 788.2,
"discharge": 788.2
},
"consumption": 7520.8,
"grid": {
"export": 187.7,
"import": 1719.8
},
"solar": 6117.7
}
},
"yesterday": {
"power": [
{
"battery": 189,
"battery_percent": 91,
"consumption": 192,
"grid": 1,
"solar": 0,
"time": "2025-05-28T23:04:37Z"
},
{
"battery": 190,
"battery_percent": 90,
"consumption": 194,
"grid": 2,
"solar": 0,
"time": "2025-05-28T23:09:39Z"
},
],
"day": {
"ac_charge": 3.8,
"battery": {
"charge": 3.8,
"discharge": 4.6
},
"consumption": 9.2,
"grid": {
"export": 4.7,
"import": 1.1
},
"solar": 11.9
},
"total": {
"ac_charge": 859,
"battery": {
"charge": 786.4,
"discharge": 786.4
},
"consumption": 7515.4,
"grid": {
"export": 187.6,
"import": 1718.1
},
"solar": 6115.9
}
}
}
It should be straightforward for anyone who isn't using a GivEnergy battery and inverter to call their own provider's API and return data in the same format.
Note that in the above data the timestamps for each day are starting just after 23:00:00Z, because I'm currently a UTC+1 timezone.
Filesystem
├─ slipway_serve.json
└─ rigs
│ └─ energy_dashboard.json
└─ components
├─ energy_cash_flow
│ └─ slipway_component.json
├─ energy_flow_chart
│ └─ slipway_component.json
├─ energy_graph
│ └─ slipway_component.json
├─ givenergy
│ ├─ run.js
│ └─ slipway_component.json
├─ energy_lifetime
│ └─ slipway_component.json
├─ octopus_tariff
│ └─ slipway_component.json
└─ tariff_rate_graph
└─ slipway_component.json
The energy_graph Component
I'm going to tackle this one next so we have something to look at, and because I already had a similar graph with my original dashboard.
I'm going to use the slipwayhq.echarts renderer Component to render the chart, so all my code has to do is output a valid ECharts definition.
Most of the time here was spent fiddling with the graph, looking at the ECharts documentation, getting it to look like George's version. I did add some dashed horizontal axis split lines, to make reading the chart easier. This is the end result:
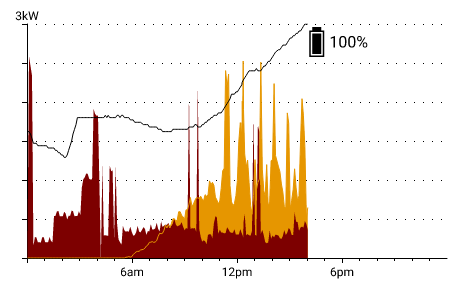
I was quite pleased with the battery image, as I just asked ChatGPT o3:
Can you create a javascript function which will take a charge value between 1 and 100, and a width and height and return an SVG path vector of a vertically oriented battery symbol showing the appropriate charge. The result should be a string starting path://.
It successfully one-shotted the resulting function. I then tweaked it slightly for aesthetic reasons: The ChatGPT version was a dark outer boarder with an light inner rectangle representing charge, so I added a full height light inner rectangle and made the charge a black rectangle inside of that.
The slipway_component.json input schema is a subset of what the givenergy Component outputs, as I only need the data from a single day to draw this chart.
The output is a Canvas, and you can see that the rigging section uses the slipwayhq.echarts Component to render the canvas using the output of my run.js script.
I also added some optional properties to theme the chart, as well as width and height properties so it knows what size to render the chart.
Show slipway_component.jsonslipway_energy_dashboard/components/energy_graph/slipway_component.json
"publisher": "jamesthurley",
"name": "energy_dashboard__energy_graph",
"version": "1.0.0",
"input": {
"properties": {
"width": {
"type": "uint32"
},
"height": {
"type": "uint32"
},
"power": {
"elements": {
"ref": "power"
}
}
},
"optionalProperties": {
"theme": {
"optionalProperties": {
"solar_color": { "type": "string" },
"grid_import_color": { "type": "string" },
"battery_color": { "type": "string" },
"foreground_color": { "type": "string" }
},
"additionalProperties": true
}
},
"definitions": {
"power": {
"properties": {
"time": {
"type": "string"
},
"battery": {
"type": "float64"
},
"battery_percent": {
"type": "float64"
},
"consumption": {
"type": "float64"
},
"grid": {
"type": "float64"
},
"solar": {
"type": "float64"
}
}
}
}
},
"output": "canvas",
"rigging": {
"output": {
"component": "slipwayhq.echarts.0.5.4",
"allow": [
{ "permission": "fonts" },
{ "permission": "registry_components", "publisher": "slipwayhq" }
],
"input": {
"width": "$$.input.width",
"height": "$$.input.height",
"chart": "$$.input.run.chart",
"apply": "$$.input.run.apply"
}
}
}
}
The run.js code is primarily just constructing the ECharts definition, along with the function which generates the battery icon at the bottom of the file.
Show run.jsslipway_energy_dashboard/components/energy_graph/run.js
const chart = buildChart(input.power, input.theme || {});
let apply_js = await slipway_host.load_text('', 'apply.js');
return {
chart,
apply: apply_js,
};
}
function buildChart(data, theme) {
let solarColor = theme.solar_color || 'rgba(230, 150, 0, 1)';
let gridColor = theme.grid_import_color || 'rgba(125, 0, 0, 1)';
let batteryColor = theme.battery_color || 'rgba(0, 0, 0, 1)';
let foregroundColor = theme.foreground_color || 'rgba(0, 0, 0, 1)';
const times = data.map(d => new Date(d.time).getTime());
const solar = data.map(d => d.solar/1000);
const batteryPercent = data.map(d => d.battery_percent);
const consumption = data.map(d => d.consumption/1000);
let power_axis_max = Math.ceil(Math.max(...solar, ...consumption));
let dayStart = undefined;
let dayEnd = undefined;
let lastPercent = undefined;
let lastPercentIndex = 0;
let lastTime = undefined;
let hourOfDay = 0;
if (times.length > 0) {
const zdt = Temporal.Instant
.fromEpochMilliseconds(Number(times[0]))
.toZonedDateTimeISO(process.env.TZ);
const zdtStart = zdt.startOfDay();
dayStart = zdtStart.epochMilliseconds;
dayEnd = zdtStart
.add({ days: 1 })
.subtract({ milliseconds: 1 })
.epochMilliseconds;
lastPercentIndex = batteryPercent.length - 1;
lastPercent = batteryPercent[lastPercentIndex];
lastTime = new Date(times[lastPercentIndex]).getTime();
hourOfDay = new Date(times[lastPercentIndex]).getHours();
}
const batteryWidth = 15;
const batteryHeight = 30;
let definition = {
grid: { top: 20, bottom: 25, left: 30, right: 30 },
xAxis: {
type: "time",
min: dayStart,
max: dayEnd,
axisLabel: {
color: foregroundColor
},
splitNumber: 3,
axisTick: {
show: true,
lineStyle: { width: 1, length: 5, color: foregroundColor }
},
minorTick: {
show: true,
lineStyle: { width: 1, length: 2, color: foregroundColor },
splitNumber: 6
},
splitLine: { show: false },
minorSplitLine: { show: false },
axisLine: {
lineStyle: { color: foregroundColor }
},
},
yAxis: [
{
type: "value",
min: 0,
max: power_axis_max,
name: `${power_axis_max}kW`,
nameTextStyle: { color: foregroundColor },
nameGap: 2,
axisLine: {
show: true,
lineStyle: { color: foregroundColor }
},
axisLabel: { show: false },
axisTick: { show: true, lineStyle: { width: 1, length: 2, color: foregroundColor } },
splitLine: { show: true, lineStyle: { color: foregroundColor, type: [1, 8] } }
},
{
type: "value",
min: 0,
max: 100,
show: false,
splitLine: { show: false }
}
],
series: [
{
name: "Solar",
type: "line",
showSymbol: false,
data: times.map((t, i) => [t, solar[i]]),
lineStyle: { width: 0 },
areaStyle: { color: solarColor, opacity: 1.0 }
},
{
name: "Consumption",
type: "line",
showSymbol: false,
data: times.map((t, i) => [t, consumption[i]]),
lineStyle: { width: 0 },
areaStyle: { color: gridColor, opacity: 1.0 }
},
{
name: "Solar Peek",
type: "line",
showSymbol: false,
data: times.map((t, i) => [t, solar[i]]),
lineStyle: { width: 1, color: solarColor },
},
{
name: "Battery %",
type: "line",
showSymbol: false,
yAxisIndex: 1,
data: times.map((t, i) => [t, batteryPercent[i]]),
lineStyle: { type: "solid", color: batteryColor, width: 1 },
markPoint: {
data: [
{
symbol: batteryPath(lastPercent, batteryWidth, batteryHeight),
symbolSize: [batteryWidth, batteryHeight],
symbolOffset: [hourOfDay < 22 ? '60%' : '-60%', lastPercent > 50 ? '60%' : '-60%'],
coord: [lastTime, lastPercent],
itemStyle: {
color: batteryColor,
},
label: {
show: true,
formatter: `${Math.round(lastPercent)}%`,
position: hourOfDay < 22 ? 'right' : 'left',
fontSize: 16,
color: batteryColor,
}
}
]
}
},
]
};
return definition;
}
function batteryPath(charge, w, h) {
charge = Math.max(1, Math.min(charge, 100));
const capH = h * 0.12;
const capInset = w * 0.2;
const border = w * 0.1;
const pathParts = [
`M${capInset},0`,
`H${w - capInset}`,
`V${capH}`,
`H${w}`,
`V${h}`,
`H0`,
`V${capH}`,
`H${capInset}`,
`Z`
];
const innerLeft = border;
const innerRight = w - border;
const innerBottom = h - border;
const innerTop = capH + border;
pathParts.push(
`M${innerLeft},${innerBottom}`,
`H${innerRight}`,
`V${innerTop}`,
`H${innerLeft}`,
`Z`
);
const chargeLeft = innerLeft + border;
const chargeRight = innerRight - border;
const chargeBottom = innerBottom - border;
const chargeTop = innerTop + border;
const maxFillH = chargeBottom - chargeTop;
const fillHeight = (maxFillH * charge) / 100;
const fillTopY = chargeBottom - fillHeight;
pathParts.push(
`M${chargeLeft},${chargeBottom}`,
`H${chargeRight}`,
`V${fillTopY}`,
`H${chargeLeft}`,
`Z`
);
return 'path://' + pathParts.join('');
}
I found that I couldn't quite match George's delightfully minimalist X axis style without using a Javascript function as the label formatter.
However my ECharts JSON needs to be serialized so it can be passed through to the slipwayhq.echarts Component, making functions a no-go.
To get around this I released a new version of slipwayhq.echarts which would optionally take some Javascript to run within the component, and I could use this to attach Javascript formatters to the chart definition from inside the slipwayhq.echarts component:
Show apply.jsslipway_energy_dashboard/components/energy_graph/apply.js
const zdt = Temporal.Instant
.fromEpochMilliseconds(value)
.toZonedDateTimeISO(process.env.TZ);
let hours = zdt.hour;
if (hours !== 6 && hours !== 12 && hours !== 18) {
return '';
}
const am_pm = hours >= 12 ? 'pm' : 'am';
hours = hours % 12;
hours = hours === 0 ? 12 : hours;
return `${hours}${am_pm}`;
};
This means that we have three files for the energy_graph Component:
Filesystem
├─ slipway_serve.json
└─ rigs
│ └─ energy_dashboard.json
└─ components
├─ energy_cash_flow
│ └─ slipway_component.json
├─ energy_flow_chart
│ └─ slipway_component.json
├─ energy_graph
│ ├─ apply.js
│ ├─ run.js
│ └─ slipway_component.json
├─ givenergy
│ ├─ run.js
│ └─ slipway_component.json
├─ energy_lifetime
│ └─ slipway_component.json
├─ octopus_tariff
│ └─ slipway_component.json
└─ tariff_rate_graph
└─ slipway_component.json
The energy_flow_chart Component
To create this Component I first approximated George's diagram in InkScape. I then exported it to a plain SVG, and then ran it through SVGOMG to simplify it and make it suitable for human editing.
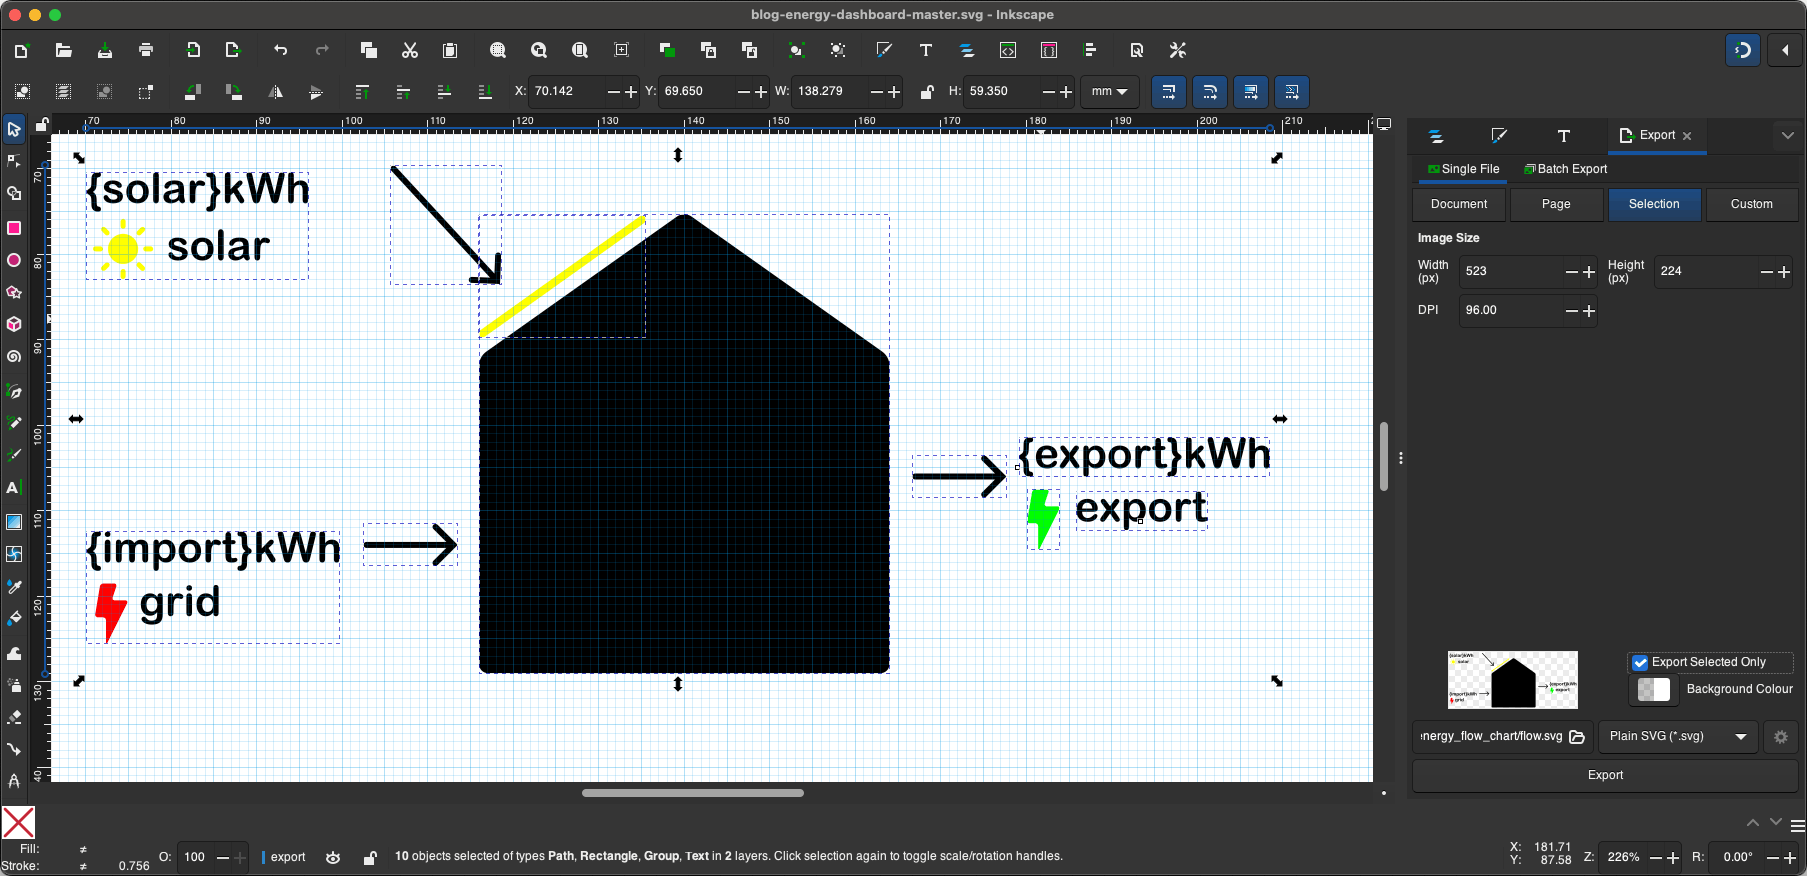
After that I spent far to long manually simplifying it even further. In particular I adjusted most of the transforms as InkScape created groups with large negative translations which then had inner elements with large positive translations to compensate.
AI helped again to automate adjusting the paths. I found I could reliably ask it to remove a transform from a group and adjust everything inside to compensate.
Next I needed to turn the SVG file into a template so that I could color the various parts as per the theme specified by the user, and insert the actual numbers from the data.
I considered using a templating engine, but I wanted the SVG to be viewable as a normal SVG so that I could edit it and immediately see the results in a browser. That constraint meant templated colors had to be valid, rather than, for example, {solar_color}.
In the end I settled on using special colors like #00ff00fe that I could simply search and replace with user specified colors, and strings like {s} that I could search and replace with actual numbers.
I was concerned that as I replaced each color in turn, one of the colors I inserted would clash with one of the template colors yet to be replaced. To make this unlikely I used an alpha value of fe in all of the template colors. That alpha value would still let me view the SVG template, but it was unlikely to be specified as part of a theme by any sane user.
The result was very pleasing, and the Component turned out to be extremely trivial to write.
The Javascript for this Component simply loads the SVG template, replaces the template values, and returns the result.
Show run.jsslipway_energy_dashboard/components/energy_flow_chart/run.js
const solar = input.data.solar || 0;
const gridImport = input.data.grid.import || 0;
const gridExport = input.data.grid.export || 0;
const consumption = input.data.consumption || 0;
let theme = input.theme || {};
let solarColor = theme.solar_color || 'rgba(230, 150, 0, 1)';
let gridImportColor = theme.grid_import_color || 'rgba(125, 0, 0, 1)';
let gridExportColor = theme.grid_export_color || solarColor;
let usedColor = theme.power_used_color || 'rgba(255, 255, 255, 1)';
let foregroundColor = theme.foreground_color || 'rgba(0, 0, 0, 1)';
let flowSvg = await slipway_host.load_text('', 'flow.svg');
flowSvg = flowSvg
.replace(/#ffcf00fe/g, solarColor)
.replace(/#ff0000fe/g, gridImportColor)
.replace(/#00ff00fe/g, gridExportColor)
.replace(/#fffffffe/g, usedColor)
.replace(/#000000fe/g, foregroundColor)
.replace("{s}", solar.toFixed(1))
.replace("{g}", gridImport.toFixed(1))
.replace("{e}", gridExport.toFixed(1))
.replace("{u}", consumption.toFixed(1));
return {
svg: flowSvg,
};
}
The slipway_component.json handles passing the resulting SVG on to the slipwayhq.svg component to be rendered.
The input schema is the relevant subset of the single day summary output by the givenergy Component, along with the width and height of the image we need to render.
Show slipway_component.jsonslipway_energy_dashboard/components/energy_flow_chart/slipway_component.json
"publisher": "jamesthurley",
"name": "energy_dashboard__energy_flow_chart",
"version": "1.0.0",
"input": {
"properties": {
"width": {
"type": "uint32"
},
"height": {
"type": "uint32"
},
"data": {
"properties": {
"consumption": {
"type": "float64"
},
"grid": {
"properties": {
"export": {
"type": "float64"
},
"import": {
"type": "float64"
}
}
},
"solar": {
"type": "float64"
}
},
"additionalProperties": true
}
},
"optionalProperties": {
"theme": {
"optionalProperties": {
"solar_color": { "type": "string" },
"grid_import_color": { "type": "string" },
"grid_export_color": { "type": "string" },
"power_used_color": { "type": "string" },
"foreground_color": { "type": "string" }
},
"additionalProperties": true
}
}
},
"output": "canvas",
"rigging": {
"output": {
"component": "slipwayhq.svg.0.6.2",
"allow": [
{ "permission": "fonts" }
],
"input": {
"width": "$$.input.width",
"height": "$$.input.height",
"svg": "$$.input.run.svg",
"scale": true
}
}
}
}
For completeness, I'll include the final SVG template here as well:
Show flow.svgslipway_energy_dashboard/components/energy_flow_chart/flow.svg
<defs>
<marker id="arrow-cap" markerHeight="1" markerWidth="1" orient="auto-start-reverse" overflow="visible" preserveAspectRatio="xMidYMid" refX="0" refY="0" viewBox="0 0 1 1">
<path fill="none" stroke="context-stroke" stroke-linecap="round" d="m-2.75 3 3-3-3-3"/>
</marker>
<path id="lightning" d="M0 0h1.28a.25.25 0 0 1 .23.33l-.43 1.32a.25.25 0 0 0 .23.33h1.28a.22.22 0 0 1 .2.31l-2.33 4.64a.08.08 0 0 1-.15-.03v-2.6a.35.35 0 0 0-.35-.35h-.62a.3.3 0 0 1-.3-.34l.55-3.26a.41.41 0 0 1 .4-.35Z"/>
</defs>
<g transform="translate(75 14)">
<path id="house" fill="#000000fe" d="M-24 41.47V6.59a2.05 2.05 117.34 0 1 .86-1.67L-0.86-10.86a1.5 1.5 0 0 1 1.72 0L23.14 4.92a2.05 2.05 62.66 0 1 .86 1.67v34.88a1.06 1.06 135 0 1-1.06 1.06H-22.94a1.06 1.06 45 0 1-1.06-1.06z"/>
<rect id="solar-panel" fill="#ffcf00fe" width="23.83" height="1.2" x="0" y="0" rx=".5" ry=".5" transform="translate(-24, 3) rotate(-35.5)"/>
</g>
<g fill="none" stroke="#000000fe" transform="translate(38,0)" stroke-linecap="round" stroke-width=".7" marker-end="url(#arrow-cap)">
<path id="solar-arrow" d="m3.16 0.35 12 13"/>
<path id="grid-arrow" d="M0 44.35h10"/>
<path id="export-arrow" d="M64.16 36.35h10"/>
</g>
<g id="solar-stats" fill="#000000fe" transform="translate(0 9)" style="text-align:start" text-anchor="start">
<text x="0" y="0"><tspan font-size="12">{s}</tspan><tspan>kWh</tspan></text>
<text x="9.5" y="6.24"><tspan >solar</tspan></text>
<g fill="#ffcf00fe" stroke-width="1.7" transform="translate(4.5 5.24) scale(.58697)">
<circle cx="0" cy="0" r="3"/>
<path d="M4.53-.5h.94a.53.53 0 0 1 .53.53.5.5 0 0 1-.53.47h-.94a.53.53 0 0 1-.53-.53.5.5 0 0 1 .53-.47zm-.97 3.35.66.66a.53.53 0 0 1 0 .75.5.5 0 0 1-.7-.04l-.67-.66a.53.53 0 0 1 0-.75.5.5 0 0 1 .7.04zm-.71-6.41.66-.66a.53.53 0 0 1 .75 0 .5.5 0 0 1-.04.7l-.66.67a.53.53 0 0 1-.75 0 .5.5 0 0 1 .04-.7zm-3.35-.97v-.94a.53.53 0 0 1 .53-.53.5.5 0 0 1 .47.53v.94a.53.53 0 0 1-.53.53.5.5 0 0 1-.47-.53zm-3.06 1.68-.66-.66a.53.53 0 0 1 0-.75.5.5 0 0 1 .7.04l.67.66a.53.53 0 0 1 0 .75.5.5 0 0 1-.7-.04zm4.06 7.38v.94a.53.53 0 0 1-.53.53.5.5 0 0 1-.47-.53v-.94a.53.53 0 0 1 .53-.53.5.5 0 0 1 .47.53zm-3.35-.97-.66.66a.53.53 0 0 1-.75 0 .5.5 0 0 1 .04-.7l.66-.67a.53.53 0 0 1 .75 0 .5.5 0 0 1-.04.7zm-1.68-3.06h-.94a.53.53 0 0 1-.53-.53.5.5 0 0 1 .53-.47h.94a.53.53 0 0 1 .53.53.5.5 0 0 1-.53.47z"/>
</g>
</g>
<g id="grid-stats" fill="#000000fe" transform="translate(0 50)" style="text-align:start" text-anchor="start">
<text x="0" y="0"><tspan font-size="12">{g}</tspan><tspan>kWh</tspan></text>
<text x="6.5" y="6.24"><tspan>grid</tspan></text>
<use x="2" y="3" href="#lightning" fill="#ff0000fe"/>
</g>
<g id="used-stats" fill="#fffffffe" transform="translate(75 37)" style="text-align:center" text-anchor="middle">
<text x="0" y="0"><tspan font-size="12">{u}</tspan><tspan>kWh</tspan></text>
<text x="0" y="6.24"><tspan>used</tspan></text>
</g>
<g id="export-stats" fill="#000000fe" transform="translate(150 37)" style="text-align:end" text-anchor="end">
<text x="0" y="0"><tspan font-size="12">{e}</tspan><tspan>kWh</tspan></text>
<text x="0" y="6.24"><tspan>export</tspan></text>
<use x="-18" y="3" href="#lightning" fill="#00ff00fe"/>
</g>
</svg>
Filesystem
├─ slipway_serve.json
└─ rigs
│ └─ energy_dashboard.json
└─ components
├─ energy_cash_flow
│ └─ slipway_component.json
├─ energy_flow_chart
│ ├─ flow.svg
│ ├─ run.js
│ └─ slipway_component.json
├─ energy_graph
│ ├─ apply.js
│ ├─ run.js
│ └─ slipway_component.json
├─ givenergy
│ ├─ run.js
│ └─ slipway_component.json
├─ energy_lifetime
│ └─ slipway_component.json
├─ octopus_tariff
│ └─ slipway_component.json
└─ tariff_rate_graph
└─ slipway_component.json
The energy_lifetime Component
After the previous Component this one should be trivial, right?
Surprisingly, it posed some challenges.
My first thought was to do it all in SVG, but the issue is that SVG requires each piece of text to be positioned absolutely. This is hard to do trivially when the text is interspersed with icons, and I don't know what the font the user might decide to use. It would be quite easy to end up with janky spacing, or even worse, overlapping text. And I didn't want to go down the route of measuring the text programmatically while generating the SVG. That's too much complexity.
My second thought was to use a mix of Adaptive Cards and SVG icons, however I quickly hit upon a limitation of Adaptive Cards which is that it isn't very good at putting text of different sizes on one line, as it has no way to line up the baselines.
This is what that ended up looking like, with the debug bounding boxes enabled:
You can see it is centering the text vertically, with a height measurement that includes the descender space.
So with SVG we get janky horizontal alignment. With Adaptive Cards we get janky vertical alignment.
How about JSX? I tend to pick the slipwayhq.jsx renderer last because it's (currently) quite a slow renderer relative to SVG or Adaptive Cards.
But despite these performance issues, JSX did give me rather a nice result with minimum fuss:
Aside: Javascript Renderer Performance
The Javascript renderers (for example slipwayhq.echarts and slipwayhq.jsx) are significantly slower than the WASM renderers (for example slipwayhq.svg and slipwayhq.render), which are written in Rust.
I'm fairly certain this is because of the Javascript runtime that I'm using in Slipway.
On my M3 Macbook Air both this simple Component and the energy_graph Component each take about 400ms to execute their Javascript renderers, where as the energy_flow_chart component takes just a few milliseconds to render the SVG.
To fix this, I plan to try moving from the Boa Javascript runtime to the Deno/V8 runtime, which I suspect might largely eliminate the problem.
It makes me sad to move away from a community driven, open-source Javascript runtime written entirely in Rust, and swap it out for a megacorp C++ runtime with a Rust wrapper made by a VC funded company. But I think most people will be far more bothered about 400ms vs 4ms than these ideals. I'll write about how this goes in a future blog post.
Once again the actual Javascript for this Component is quite simple. I do a few calculations at the top to decide if I should display in mWh or kWh, and then I load the JSX template, swap out the colors, and return the resulting JSX along with the data for it to bind to:
Show run.jsslipway_energy_dashboard/components/energy_lifetime/run.js
let solar = input.data.solar || 0;
let solarUnits = "kWh";
if (solar > 1000) {
solar = solar / 1000;
solarUnits = "MWh";
}
let gridExport = input.data.grid.export || 0;
let gridExportUnits = "kWh";
if (gridExport > 1000) {
gridExport = gridExport / 1000;
gridExportUnits = "MWh";
}
const title = input.title || "Lifetime";
let theme = input.theme || {};
let solarColor = theme.solar_color || 'rgba(230, 150, 0, 1)';
let gridExportColor = theme.grid_export_color || solarColor;
let foregroundColor = theme.foreground_color || 'rgba(0, 0, 0, 1)';
let jsx = await slipway_host.load_text('', 'lifetime.jsx');
jsx = jsx
.replace(/#ffcf00fe/g, solarColor)
.replace(/#ff0000fe/g, gridExportColor)
.replace(/#000000fe/g, foregroundColor);
const data = {
title,
solar,
solarUnits,
gridExport,
gridExportUnits,
};
return {
data,
jsx
};
}
The slipway_component.json once again defines a subset of the GivEnergy data as its input schema, and passes the output through the slipwayhq.jsx renderer.
Show slipway_component.jsonslipway_energy_dashboard/components/energy_lifetime/slipway_component.json
"publisher": "jamesthurley",
"name": "energy_dashboard__energy_lifetime",
"version": "1.0.0",
"input": {
"properties": {
"width": {
"type": "uint32"
},
"height": {
"type": "uint32"
},
"data": {
"properties": {
"grid": {
"properties": {
"export": {
"type": "float64"
}
},
"additionalProperties": true
},
"solar": {
"type": "float64"
}
},
"additionalProperties": true
}
},
"optionalProperties": {
"title": {
"type": "string"
},
"theme": {
"optionalProperties": {
"solar_color": { "type": "string" },
"grid_export_color": { "type": "string" },
"foreground_color": { "type": "string" }
},
"additionalProperties": true
}
}
},
"output": "canvas",
"rigging": {
"output": {
"component": "slipwayhq.jsx.0.6.1",
"allow": [
{ "permission": "fonts" },
{ "permission": "registry_components", "publisher": "slipwayhq" }
],
"input": {
"width": "$$.input.width",
"height": "$$.input.height",
"data": "$$.input.run.data",
"jsx": "$$.input.run.jsx"
}
}
}
}
And this is what the JSX looks like:
Show lifetime.jsxslipway_energy_dashboard/components/energy_lifetime/lifetime.jsx
style={{
display: "flex",
alignItems: "center",
justifyContent: "center",
height: "100%",
width: "100%",
color: "#000000fe"
}}
>
<span style={{ fontSize: "0.9rem", marginRight: 16 }}>
{data.title}:
</span>
<span style={{ display: "flex", alignItems: "center", gap: 2 }}>
<svg width="25" height="25" xmlns="http://www.w3.org/2000/svg" viewBox="0 0 12 12">
<g fill="#ffcf00fe">
<circle cx="6" cy="6" r="3"/>
<path d="M10.53 5.5h.94a.53.53 45 0 1 .53.53.5.5 138.34 0 1-.53.47h-.94a.53.53 45 0 1-.53-.53.5.5 138.34 0 1 .53-.47zm-.97 3.35.66.66a.53.53 90 0 1 0 .75.5.5 3.34 0 1-.7-.04l-.67-.66a.53.53 90 0 1 0-.75.5.5 3.34 0 1 .7.04zm-.71-6.41.66-.66a.53.53 0 0 1 .75 0 .5.5 93.34 0 1-.04.7l-.66.67a.53.53 0 0 1-.75 0 .5.5 93.34 0 1 .04-.7zm-3.35-.97v-.94a.53.53 135 0 1 .53-.53.5.5 48.34 0 1 .47.53v.94a.53.53 135 0 1-.53.53.5.5 48.34 0 1-.47-.53zm-3.06 1.68-.66-.66a.53.53 90 0 1 0-.75.5.5 3.34 0 1 .7.04l.67.66a.53.53 90 0 1 0 .75.5.5 3.34 0 1-.7-.04zm4.06 7.38v.94a.53.53 135 0 1-.53.53.5.5 48.34 0 1-.47-.53v-.94a.53.53 135 0 1 .53-.53.5.5 48.34 0 1 .47.53zm-3.35-.97-.66.66a.53.53 0 0 1-.75 0 .5.5 93.34 0 1 .04-.7l.66-.67a.53.53 0 0 1 .75 0 .5.5 93.34 0 1-.04.7zm-1.68-3.06h-.94a.53.53 45 0 1-.53-.53.5.5 138.34 0 1 .53-.47h.94a.53.53 45 0 1 .53.53.5.5 138.34 0 1-.53.47z"/>
</g>
</svg>
<span style={{ fontSize: "1.5rem", marginLeft: 1 }}>
{data.solar.toPrecision(3)}
</span>
<span style={{ fontSize: "0.9rem" }}>
{data.solarUnits}
</span>
</span>
<span style={{ display: "flex", alignItems: "center", gap: 2, marginLeft: 16 }}>
<svg width="16" height="25" xmlns="http://www.w3.org/2000/svg"viewBox="0 0 5.72 10.6">
<path fill="#ff0000fe" d="M1.45 0h1.94a.38.38 0 0 1 .36.5l-.66 2a.38.38 0 0 0 .36.5h1.94a.33.33 0 0 1 .3.47l-3.53 7.06a.12.12 0 0 1-.24-.06V6.53A.53.53 0 0 0 1.39 6H.45A.45.45 0 0 1 0 5.48L.83.52A.62.62 0 0 1 1.45 0Z"/>
</svg>
<span style={{ fontSize: "1.5rem", marginLeft: 1 }}>
{data.gridExport.toPrecision(3)}
</span>
<span style={{ fontSize: "0.9rem" }}>
{data.gridExportUnits} export
</span>
</span>
</div>
Filesystem
├─ slipway_serve.json
└─ rigs
│ └─ energy_dashboard.json
└─ components
├─ energy_cash_flow
│ └─ slipway_component.json
├─ energy_flow_chart
│ ├─ flow.svg
│ ├─ run.js
│ └─ slipway_component.json
├─ energy_graph
│ ├─ apply.js
│ ├─ run.js
│ └─ slipway_component.json
├─ givenergy
│ ├─ run.js
│ └─ slipway_component.json
├─ energy_lifetime
│ ├─ lifetime.jsx
│ ├─ run.js
│ └─ slipway_component.json
├─ octopus_tariff
│ └─ slipway_component.json
└─ tariff_rate_graph
└─ slipway_component.json
The octopus_tariff Component
For the remaining Components I'll need some tariff data, so let's do that next.
This is another fairly straightforward data fetching Component.
It takes the user's API token and account number, and returns a data structure with half-hourly prices for the current day, taking the user's time zone into account.
Depending on what tariff you're on, Octopus will either return quite course-grained data (for the Go tariff, only a few spans per day) or quite fine-grained (30 minute spans for the Agile tariff).
I wanted to turn this into a standard format: a list of 48 prices in 30 minute slots, to cover the user's current day. AI is perfect for this kind of data wrangling, so I just asked ChatGPT to generate the function for me, and it obliged.
Similar to the givenergy Component, this one takes the account number and API token as optional inputs, falling back to environment variables.
Show run.jsslipway_energy_dashboard/components/octopus_tariff/run.js
const apiToken = input.api_token ?? slipway_host.env("OCTOPUS_API_TOKEN");
if (!apiToken) {
throw new Error("No API token provided. Use the input field or the OCTOPUS_API_TOKEN environment variable.");
}
const accountNumber = input.account_number ?? slipway_host.env("OCTOPUS_ACCOUNT_NUMBER");
if (!accountNumber) {
throw new Error("No account number provided. Use the input field or the OCTOPUS_ACCOUNT_NUMBER environment variable.");
}
const apiTokenBase64 = btoa(apiToken);
const requestOptions = {
method: "GET",
body: null,
headers: [
["Authorization", `Basic ${apiTokenBase64}`],
["Content-Type", "application/json"],
["Accept", "application/json"],
],
timeout_ms: null
};
const accountResponse = await slipway_host.fetch_text(`https://api.octopus.energy/v1/accounts/${accountNumber}`, requestOptions);
const accountData = JSON.parse(accountResponse.body);
const properties = accountData?.properties;
if (!properties || !properties.length) {
throw new Error("No properties found for the given account number.");
}
const property = properties[0];
const electricityMeterPoints = property.electricity_meter_points;
if (!electricityMeterPoints || !electricityMeterPoints.length) {
throw new Error("No electricity meter points found for the first property.");
}
let electricityMeterPoint = electricityMeterPoints[0];
const currentAgreement = electricityMeterPoint.agreements.find(agreement => !agreement.valid_to);
if (!currentAgreement) {
throw new Error("No current agreement found for the property.");
}
const tariffCode = currentAgreement.tariff_code;
const productCode = tariffCode.split('-').slice(2, -1).join('-');
console.debug(`Using product code "${productCode}" and tariff code "${tariffCode}".`);
const productResponse = await slipway_host.fetch_text(`https://api.octopus.energy/v1/products/${productCode}/electricity-tariffs/${tariffCode}/standard-unit-rates/`, requestOptions);
const productData = JSON.parse(productResponse.body);
const results = productData.results;
if (!results || !results.length) {
throw new Error("No standard unit rates found for the given tariff code.");
}
const today = getDayHalfHourPrices(results, process.env.TZ, false);
const yesterday = getDayHalfHourPrices(results, process.env.TZ, true);
return {
today,
yesterday,
}
}
export function getDayHalfHourPrices(results, tz, yesterday = false) {
const apiIntervals = results.map(r => ({
price : r.value_inc_vat,
from : Temporal.Instant.from(r.valid_from),
to : Temporal.Instant.from(r.valid_to)
}));
const nowZD = Temporal.Now.zonedDateTimeISO(tz);
let dayZD = nowZD.startOfDay();
if (yesterday) {
dayZD = dayZD.subtract({ days: 1 });
}
const slots = [];
for (let i = 0; i < 48; i++) {
const slotZD = dayZD.add({ minutes: 30 * i });
const slotUT = slotZD.toInstant();
const found = apiIntervals.find(({ from, to }) =>
Temporal.Instant.compare(slotUT, from) >= 0 &&
Temporal.Instant.compare(slotUT, to) < 0
);
if (!found) {
console.warn(`No price found for slot ${slotZD.toString()}`);
}
slots.push({
time : slotZD.toString({ smallestUnit: 'minute', timeZoneName: 'never' }),
price: found ? found.price : 0
});
}
return slots;
}
The slipway_component.json is pretty standard, the important part is that it establishes the output schema that other tariff data provider Components should follow to be compatible with the visualizations.
Show slipway_component.jsonslipway_energy_dashboard/components/octopus_tariff/slipway_component.json
"publisher": "jamesthurley",
"name": "energy_dashboard__octopus_tariff",
"version": "1.0.0",
"input": {
"optionalProperties": {
"account_number": {
"type": "string"
},
"api_token": {
"type": "string"
}
}
},
"output": {
"properties": {
"today": {
"elements": {
"ref": "price"
}
},
"yesterday": {
"elements": {
"ref": "price"
}
}
},
"definitions": {
"price": {
"properties": {
"time": {
"type": "string"
},
"price": {
"type": "float64"
}
}
}
}
}
}
Filesystem
├─ slipway_serve.json
└─ rigs
│ └─ energy_dashboard.json
└─ components
├─ energy_cash_flow
│ └─ slipway_component.json
├─ energy_flow_chart
│ ├─ flow.svg
│ ├─ run.js
│ └─ slipway_component.json
├─ energy_graph
│ ├─ apply.js
│ ├─ run.js
│ └─ slipway_component.json
├─ givenergy
│ ├─ run.js
│ └─ slipway_component.json
├─ energy_lifetime
│ ├─ lifetime.jsx
│ ├─ run.js
│ └─ slipway_component.json
├─ octopus_tariff
│ ├─ run.js
│ └─ slipway_component.json
└─ tariff_rate_graph
└─ slipway_component.json
The tariff_rate_graph Component
George was on the the Octopus Agile tariff, which varies electricity prices every 30 minutes throughout the day. I have a simpler tariff one called Octopus Go, designed for electric car owners, that just gives you a cheap overnight rate for charging batteries or doing other energy intensive tasks.
This makes the chart less useful to me, as it will be the same every day, but I'm still going to implement it because I like it.
Once again, most of the time here was spent fiddling with the ECharts definition to get it looking close to George's chart. I made a few minor changes, partly because I'm not on the Agile tariff so have different requirements, but I'm happy with the end result:
The "Today's Rates" title in the screenshot isn't part of the Component. I decided to put it in the Rig instead, as it felt like part of the Rig styling and layout responsibilities than something every user of the Component would want.
The run.js is just some data wrangling and EChart definition construction.
Show run.jsslipway_energy_dashboard/components/tariff_rate_graph/run.js
const chart = buildChart(input.prices, input.theme || {});
let apply_js = await slipway_host.load_text('', 'apply.js');
return {
chart,
apply: apply_js,
};
}
function buildChart(data, theme) {
let barHighColor = theme.tariff_bar_high_color || 'rgba(125, 0, 0, 1)';
let barLowColor = theme.tariff_bar_low_color || 'rgba(230, 150, 0, 1)';
let foregroundColor = theme.foreground_color || 'rgba(0, 0, 0, 1)';
const times = data.map(d => d.time);
const prices = data.map(d => d.price);
let currentTime = findCurrentTimeInterval(times);
const average = prices.reduce((sum, val) => sum + val, 0) / prices.length;
const enrichedPrices = prices.map(price => ({
value: price,
color: price >= average ? barHighColor : barLowColor,
}));
let definition = {
grid: { top: 12, bottom: 22, left: 0, right: 0 },
xAxis: {
type: "category",
data: times,
axisLabel: {
show: true,
interval: 11,
color: foregroundColor
},
axisTick: {
show: true,
alignWithLabel: true,
lineStyle: { width: 1, length: 5, color: foregroundColor }
},
minorTick: {
show: true,
lineStyle: { width: 1, length: 2, color: foregroundColor },
},
splitLine: { show: false },
minorSplitLine: { show: false },
axisLine: {
lineStyle: { color: foregroundColor }
},
},
yAxis: {
type: "value",
min: 0,
axisLine: {
show: false,
lineStyle: { color: foregroundColor }
},
axisLabel: { show: false, formatter: '{value}p', color: foregroundColor },
axisTick: { show: false, lineStyle: { width: 1, length: 2, color: foregroundColor } },
splitLine: { show: false, lineStyle: { color: foregroundColor, type: [1, 8] } }
},
series: [
{
name: "Price",
type: "bar",
data: enrichedPrices,
color: barHighColor,
itemStyle: {
},
markPoint: {
data: [
{ type: 'max', name: 'Max' },
{ type: 'min', name: 'Min' },
{
name: 'Now',
coord: [currentTime, 0],
symbol: 'path://M 0 -0.577 L 0.5 0.289 L -0.5 0.289 Z',
symbolOffset: [0, '50%'],
symbolSize: 7,
itemStyle: {
color: foregroundColor
},
label: {
show: false,
}
}
],
symbol: 'arrow',
symbolSize: 0,
label: {
show: true,
position: [0, -12],
color: foregroundColor,
textBorderWidth: 0,
}
}
},
]
};
return definition;
}
function findCurrentTimeInterval(times) {
const now = new Date();
for (let i = times.length - 1; i >= 0; i--) {
const t = new Date(times[i]);
if (t <= now) {
return times[i];
}
}
return null;
}
The slipway_component.json is pretty standard as well. It takes the half-hourly pricing data and some optional theming parameters, and passes the run.js output to the slipwayhq.echarts renderer.
Show slipway_component.jsonslipway_energy_dashboard/components/tariff_rate_graph/slipway_component.json
"publisher": "jamesthurley",
"name": "energy_dashboard__tariff_rate_graph",
"version": "1.0.0",
"input": {
"properties": {
"width": {
"type": "uint32"
},
"height": {
"type": "uint32"
},
"prices": {
"elements": {
"properties": {
"time": {
"type": "string"
},
"price": {
"type": "float64"
}
}
}
}
},
"optionalProperties": {
"theme": {
"optionalProperties": {
"tariff_bar_high_color": { "type": "string" },
"tariff_bar_low_color": { "type": "string" },
"axis_color": { "type": "string" },
"foreground_color": { "type": "string" }
},
"additionalProperties": true
}
}
},
"output": "canvas",
"rigging": {
"output": {
"component": "slipwayhq.echarts.0.5.4",
"allow": [
{ "permission": "fonts" },
{ "permission": "registry_components", "publisher": "slipwayhq" }
],
"input": {
"width": "$$.input.width",
"height": "$$.input.height",
"chart": "$$.input.run.chart",
"apply": "$$.input.run.apply"
}
}
}
}
And once again I'm passing code from apply.js through to the ECharts Component so that I can attach more complex formatters to the ECharts definition.
Show apply.jsslipway_energy_dashboard/components/tariff_rate_graph/apply.js
const zdt = Temporal.Instant
.fromEpochMilliseconds(new Date(value).getTime())
.toZonedDateTimeISO(process.env.TZ);
let hours = zdt.hour;
const minutes = zdt.minute;
if (minutes !== 0) {
return '';
}
if (hours !== 6 && hours !== 12 && hours !== 18) {
return '';
}
const am_pm = hours >= 12 ? 'pm' : 'am';
hours = hours % 12;
hours = hours === 0 ? 12 : hours;
return `${hours}${am_pm}`;
};
chart.series[0].markPoint.label.formatter = function (param) {
return `${param.value.toFixed(1)}p`;
};
chart.series[0].itemStyle.color = function (params) {
return params.data.color || "black";
};
One vaguely interesting point here is that I wanted to change the color of the bars based on whether they were above or below the average tariff price, which meant the color function in apply.js needed access to the average value, or at least the desired color for each bar.
Because the apply.js is run inside the ECharts component I can't hoist in variables like I would if I was attaching it as a lambda expression from run.js, so instead I set the series data in run.js to an object that contains the desired bar color:
const enrichedPrices = prices.map(price => ({
value: price,
color: price >= average ? barHighColor : barLowColor,
}));
Then in apply.js I can simply pull the color out of that enriched data:
return params.data.color || "black";
};
The energy_cash_flow Component
This was another Component which looked like it would be trivial but had some unexpected complexity.
First of all I had to run through all the power data from GivEnergy, which is in 5 minute intervals, and match it to the price information from Octopus, which is in 30 minute intervals, so that I could calculate what the day's electricity import had cost me.
Then I realized the export isn't as simple as I thought either, because different people have different kinds of export tariffs:
-
Some people have a smart meter which measures exactly how much electricity they export during the day, and they will be paid based on that.
-
Some people (including me) don't have their export measured, and instead what the solar panels generate is measured and a certain percentage of that is assumed to be exported.
-
Some people (including me) also get paid for all solar generated, irrespective of whether it is exported or used (this was part of a government incentive scheme).
I tried to make this Component handle all the above scenarios (an export rate, a generation rate, or both).
Because of this I needed to dynamically generate the SVG, as it's size would depend on how many lines of information it was outputting.
The result of all this is some lines of colored text:
Which is much simpler than the code which produced it:
Show run.jsslipway_energy_dashboard/components/energy_cash_flow/run.js
const exportRate = input.export_rate || 0;
const generationRate = input.generation_rate || 0;
const theme = input.theme || {};
const gridImportColor = theme.grid_import_color || 'rgba(125, 0, 0, 1)';
const gridExportColor = theme.grid_export_color || 'rgba(230, 150, 0, 1)';
const gridGenerationColor = theme.solar_color || 'rgba(230, 150, 0, 1)';
const tz = process.env.TZ;
const prices = input.prices || [];
const power = input.power || [];
const totalExported = input.day.grid.export || 0;
const totalGenerated = input.day.solar || 0;
const importCost = calculateImportCost(prices, power, tz);
const exportCost = totalExported * exportRate;
const generationCost = totalGenerated * generationRate;
const dimensions = {
xPadding: 0,
yPadding: 10,
linePadding: theme.cash_flow_line_padding || 30,
lineHeight: 30,
};
let lineCount = 0;
let svgLines = '';
if (importCost > 0) {
svgLines += getSvgLine(importCost, gridImportColor, 'imported', dimensions, lineCount);
lineCount += 1;
};
if (exportCost > 0) {
svgLines += getSvgLine(exportCost, gridExportColor, 'exported', dimensions, lineCount);
lineCount += 1;
};
if (generationCost > 0) {
svgLines += getSvgLine(generationCost, gridGenerationColor, 'generated', dimensions, lineCount);
lineCount += 1;
};
const svg = getSvgStart(dimensions, lineCount) + svgLines + getSvgEnd();
return {
svg,
};
}
function getSvgStart(dimensions, lineCount) {
const d = dimensions;
const width = 220 + (2 * d.xPadding);
const height = (2 * d.yPadding) + (d.lineHeight * lineCount) + (d.linePadding * (lineCount - 1));
return `
<svg xmlns="http://www.w3.org/2000/svg" width="${width}" height="${height}" viewBox="0 0 ${width} ${height}" font-family="sans-serif" font-size="20">`;
}
function getSvgLine(value, color, suffix, dimensions, lineIndex) {
const d = dimensions;
let valueString = '';
if (value < 100) {
valueString = `${value.toFixed(0)}p`;
}
else {
valueString = `£${(value / 100).toFixed(2)}`;
}
const y = d.yPadding + (d.lineHeight * (lineIndex + 1)) + (d.linePadding * lineIndex);
const xPadding = d.xPadding;
return `
<g transform="translate(${xPadding} ${y})" style="text-align:start" text-anchor="start">
<text fill="${color}"><tspan font-size="42">${valueString}</tspan><tspan> ${suffix}</tspan></text>
</g>`;
}
function getSvgEnd() {
return `</svg>`;
}
export function calculateImportCost(priceData, powerData, tz) {
const prices = priceData.map(({ price, time }) => ({
price,
zdt: Temporal.Instant.from(time).toZonedDateTimeISO(tz),
}));
const powers = powerData.map(({ grid, time }) => ({
grid,
zdt: Temporal.Instant.from(time).toZonedDateTimeISO(tz),
}));
let cost = 0;
let pIdx = prices.length - 1;
const isMidnight = z =>
z.hour === 0 && z.minute === 0 && z.second === 0 &&
z.millisecond === 0 && z.microsecond === 0 && z.nanosecond === 0;
for (let i = 0; i < powers.length - 1; i++) {
const cur = powers[i];
const nxt = powers[i + 1];
if (cur.grid >= 0) continue;
while (pIdx > 0 && prices[pIdx].zdt.epochMilliseconds > cur.zdt.epochMilliseconds)
pIdx--;
if (prices[pIdx].zdt.epochMilliseconds > cur.zdt.epochMilliseconds)
throw new Error(`No price before ${cur.zdt.toString()}`);
const durationH =
(nxt.zdt.epochMilliseconds - cur.zdt.epochMilliseconds) / 3_600_000;
const energyKWh = Math.abs(cur.grid) / 1_000 * durationH;
cost += energyKWh * prices[pIdx].price;
}
const last = powers[powers.length - 1];
const lastZdt = last.zdt;
if (last.grid < 0 && !isMidnight(lastZdt)) {
while (pIdx > 0 && prices[pIdx].zdt.epochMilliseconds > lastZdt.epochMilliseconds)
pIdx--;
if (prices[pIdx].zdt.epochMilliseconds > lastZdt.epochMilliseconds)
throw new Error(`No price before final sample ${lastZdt.toString()}`);
const midnightNext = lastZdt
.add({ days: 1 })
.startOfDay();
const durationH =
(midnightNext.epochMilliseconds - lastZdt.epochMilliseconds) / 3_600_000;
const energyKWh = Math.abs(last.grid) / 1_000 * durationH;
cost += energyKWh * prices[pIdx].price;
}
return cost;
}
The slipway_component.json will look pretty familiar by now. It takes both the vector of power information (to calculate the import costs), the day summary (to more easily calculate the export/generation costs), along with the energy tariff data (so it knows the prices).
In addition there are optional export_rate and generation_rate fields, so that you can set whichever apply to your setup. Plus the usual optional theming properties.
Show slipway_component.jsonslipway_energy_dashboard/components/energy_cash_flow/slipway_component.json
"publisher": "jamesthurley",
"name": "energy_dashboard__energy_cash_flow",
"version": "1.0.0",
"input": {
"properties": {
"width": {
"type": "uint32"
},
"height": {
"type": "uint32"
},
"prices": {
"elements": {
"properties": {
"time": {
"type": "string"
},
"price": {
"type": "float64"
}
}
}
},
"power": {
"elements": {
"properties": {
"grid": {
"type": "float64"
}
},
"additionalProperties": true
}
},
"day": {
"properties": {
"grid": {
"properties": {
"export": {
"type": "float64"
}
},
"additionalProperties": true
},
"solar": {
"type": "float64"
}
},
"additionalProperties": true
}
},
"optionalProperties": {
"export_rate": {
"type": "float64"
},
"generation_rate": {
"type": "float64"
},
"theme": {
"optionalProperties": {
"grid_import_color": {
"type": "string"
},
"grid_export_color": {
"type": "string"
},
"solar_color": {
"type": "string"
},
"cash_flow_line_padding": {
"type": "uint32"
}
},
"additionalProperties": true
}
}
},
"output": "canvas",
"rigging": {
"output": {
"component": "slipwayhq.svg.0.6.2",
"allow": [
{
"permission": "fonts"
}
],
"input": {
"width": "$$.input.width",
"height": "$$.input.height",
"svg": "$$.input.run.svg",
"scale": true
}
}
}
}
The utils Component
One bonus Component.
The last thing I needed to do was display the date and time at the top of the dashboard.
For this I decided to just create a trivial utils Component that would return the appropriately formatted strings.
One minor complication was the Boa Javascript runtime Slipway currently uses doesn't have the toLocaleString methods implemented on Temporal yet, or the formatters on Intl, so I had to generate the date a bit more manually. Or rather, ChatGPT did.
Show run.jsslipway_energy_dashboard/components/utils/run.js
const zoned = Temporal.Now.zonedDateTimeISO(process.env.TZ);
return {
"formatted_date": formatDateInTimeZone(zoned),
"formatted_time": `Updated at ${getCurrentTime24Hour(zoned)}`
}
}
function getCurrentTime24Hour(zoned) {
const hour = String(zoned.hour).padStart(2, '0');
const minute = String(zoned.minute).padStart(2, '0');
return `${hour}:${minute}`;
}
function formatDateInTimeZone(zoned) {
const days = ["Sunday", "Monday", "Tuesday", "Wednesday", "Thursday", "Friday", "Saturday"];
const months = [
"January", "February", "March", "April", "May", "June",
"July", "August", "September", "October", "November", "December"
];
const weekday = days[zoned.dayOfWeek % 7];
const day = zoned.day;
const month = months[zoned.month - 1];
const year = zoned.year;
const suffix =
day % 10 === 1 && day !== 11 ? "st" :
day % 10 === 2 && day !== 12 ? "nd" :
day % 10 === 3 && day !== 13 ? "rd" : "th";
return `${weekday} ${day}${suffix} ${month} ${year}`;
}
slipway_energy_dashboard/components/utils/slipway_component.json
"publisher": "jamesthurley",
"name": "energy_dashboard__utils",
"version": "1.0.0",
"input": {},
"output": {
"properties": {
"formatted_date": {
"type": "string"
},
"formatted_time": {
"type": "string"
}
}
}
}
The Final Rig
You can expand the final Rig JSON below, and I've highlighted sections which I will explain next.
Show rigs/energy_dashboard.jsonslipway_energy_dashboard/rigs/energy_dashboard.json
"context": {
"device": {
"width": 480,
"height": 800,
"theme": {
"solar_color": "rgb(230, 150, 0)",
"grid_export_color": "rgb(230, 150, 0)",
"tariff_bar_low_color": "rgb(230, 150, 0)",
"grid_import_color": "rgb(125, 0, 0)",
"tariff_bar_high_color": "rgb(125, 0, 0)",
"power_used_color": "rgb(255, 255, 255)",
"battery_color": "rgb(0, 0, 0)",
"background_color": "rgb(255, 255, 255)",
"foreground_color": "rgb(0, 0, 0)",
"header_background_color": "rgb(230, 150, 0)",
"header_foreground_color": "rgb(0, 0, 0)",
"cash_flow_line_padding": 30
}
}
},
"rigging": {
"utils": {
"component": "jamesthurley.energy_dashboard__utils.1.0.1",
"input": {}
},
"givenergy": {
"component": "jamesthurley.energy_dashboard__givenergy.1.0.1",
"allow": [
{
"permission": "env",
"prefix": "GIVENERGY_"
},
{
"permission": "http",
"prefix": "https://api.givenergy.cloud/"
}
],
"input": {}
},
"octopus_tariff": {
"component": "jamesthurley.energy_dashboard__octopus_tariff.1.0.1",
"allow": [
{
"permission": "env",
"prefix": "OCTOPUS_"
},
{
"permission": "http",
"prefix": "https://api.octopus.energy/"
}
],
"input": {}
},
"render": {
"component": "slipwayhq.render.0.7.0",
"allow": [
{
"permission": "fonts"
},
{
"permission": "registry_components"
}
],
"callouts": {
"energy_flow_chart": {
"component": "jamesthurley.energy_dashboard__energy_flow_chart.1.0.1",
"allow": [
{ "permission": "fonts" },
{ "permission": "registry_components" }
]
},
"energy_graph": {
"component": "jamesthurley.energy_dashboard__energy_graph.1.0.1",
"allow": [
{ "permission": "fonts" },
{ "permission": "registry_components" }
]
},
"energy_lifetime": {
"component": "jamesthurley.energy_dashboard__energy_lifetime.1.0.1",
"allow": [
{ "permission": "fonts" },
{ "permission": "registry_components" }
]
},
"tariff_rate_graph": {
"component": "jamesthurley.energy_dashboard__tariff_rate_graph.1.0.1",
"allow": [
{ "permission": "fonts" },
{ "permission": "registry_components" }
]
},
"energy_cash_flow": {
"component": "jamesthurley.energy_dashboard__energy_cash_flow.1.0.1",
"allow": [
{ "permission": "fonts" },
{ "permission": "registry_components" }
]
}
},
"input": {
"host_config": {
"containerStyles": {
"default": {
"backgroundColor": "$.context.device.theme.background_color",
"foregroundColors": {
"default": {
"default": "$.context.device.theme.foreground_color"
}
}
},
"attention": {
"backgroundColor": "$.context.device.theme.header_background_color",
"borderThickness": 0,
"foregroundColors": {
"default": {
"default": "$.context.device.theme.header_foreground_color"
}
}
}
}
},
"canvas": {
"width": "$.context.device.width",
"height": "$.context.device.height"
},
"card": {
"type": "AdaptiveCard",
"body": [
{
"type": "Container",
"style": "attention",
"bleed": true,
"items": [
{
"type": "TextBlock",
"size": "extraLarge",
"text": "$$.utils.formatted_date",
"wrap": true
},
{
"type": "TextBlock",
"spacing": "small",
"size": "medium",
"text": "$$.utils.formatted_time",
"wrap": true
}
]
},
{
"type": "Image",
"height": "180px",
"spacing": "large",
"url": "component://energy_flow_chart?width=$width&height=$height",
"body": {
"data": "$$.givenergy.today.day",
"theme": "$.context.device.theme"
}
},
{
"type": "Container",
"bleed": true,
"spacing": "large",
"height": "stretch",
"items": [
{
"type": "Image",
"height": "stretch",
"url": "component://energy_graph?width=$width&height=$height",
"body": {
"power": "$$.givenergy.today.power",
"theme": "$.context.device.theme"
}
}
]
},
{
"type": "ColumnSet",
"columns": [
{
"type": "Column",
"width": "stretch",
"items": [
{
"type": "TextBlock",
"size": "large",
"text": "Today's Rates"
},
{
"type": "Image",
"height": "100px",
"spacing": "small",
"url": "component://tariff_rate_graph?width=$width&height=$height",
"body": {
"prices": "$$.octopus_tariff.today",
"theme": "$.context.device.theme"
}
}
]
},
{
"type": "Column",
"width": "140px",
"verticalContentAlignment": "top",
"items": [
{
"type": "TextBlock",
"size": "large",
"text": "Yesterday"
},
{
"type": "Image",
"height": "stretch",
"spacing": "small",
"url": "component://energy_cash_flow?width=$width&height=90",
"body": {
"power": "$$.givenergy.yesterday.power",
"day": "$$.givenergy.yesterday.day",
"prices": "$$.octopus_tariff.yesterday",
"generation_rate": 25.84,
"theme": "$.context.device.theme"
}
}
]
}
]
},
{
"type": "Image",
"height": "40px",
"url": "component://energy_lifetime?width=$width&height=$height",
"body": {
"data": "$$.givenergy.today.total",
"theme": "$.context.device.theme"
}
}
]
}
}
}
}
}
Default Device Context
The first highlighted section, context, contains a default device context which will be used when rendering the Rig directly:
"device": {
"width": 480,
"height": 800,
"theme": {
"solar_color": "rgb(230, 150, 0)",
"grid_export_color": "rgb(230, 150, 0)",
"tariff_bar_low_color": "rgb(230, 150, 0)",
"grid_import_color": "rgb(125, 0, 0)",
"tariff_bar_high_color": "rgb(125, 0, 0)",
"power_used_color": "rgb(255, 255, 255)",
"battery_color": "rgb(0, 0, 0)",
"background_color": "rgb(255, 255, 255)",
"foreground_color": "rgb(0, 0, 0)",
"header_background_color": "rgb(230, 150, 0)",
"header_foreground_color": "rgb(0, 0, 0)",
"cash_flow_line_padding": 30
}
}
},
This contains a default size and theme for the Rig. Slipway supports configuring "devices", which represent your real physical devices, and these can override the default context with their own themes, resolutions, and other settings (such as image rotation).
Running the Data Components
The second section is adding the utils, givenergy and octopus_tariff Components, which will cause them to be executed as part of the Rig.
"component": "jamesthurley.energy_dashboard__utils.1.0.0",
"input": {}
},
"givenergy": {
"component": "jamesthurley.energy_dashboard__givenergy.1.0.0",
"allow": [
{
"permission": "env",
"prefix": "GIVENERGY_"
},
{
"permission": "http",
"prefix": "https://api.givenergy.cloud/"
}
],
"input": {}
},
"octopus_tariff": {
"component": "jamesthurley.energy_dashboard__octopus_tariff.1.0.0",
"allow": [
{
"permission": "env",
"prefix": "OCTOPUS_"
},
{
"permission": "http",
"prefix": "https://api.octopus.energy/"
}
],
"input": {}
},
You can see that the givenergy and octopus_tariff Components are being given a very restrictive set of permissions so they can only read data from the places they are supposed to. The utils Component has no permissions at all, so all it can do is execute code.
Renderer Permissions
Next we have the slipwayhq.render Component, which contains the same layout as before but now has a couple of extra sections called allow and callouts.
"component": "slipwayhq.render.0.7.0",
"allow": [
{
"permission": "fonts"
},
{
"permission": "registry_components"
}
],
"callouts": {
"energy_flow_chart": {
"component": "jamesthurley.energy_dashboard__energy_flow_chart.1.0.0",
"allow": [
{ "permission": "fonts" },
{ "permission": "registry_components" }
]
},
"energy_graph": {
"component": "jamesthurley.energy_dashboard__energy_graph.1.0.0",
"allow": [
{ "permission": "fonts" },
{ "permission": "registry_components" }
]
},
"energy_lifetime": {
"component": "jamesthurley.energy_dashboard__energy_lifetime.1.0.0",
"allow": [
{ "permission": "fonts" },
{ "permission": "registry_components" }
]
},
"tariff_rate_graph": {
"component": "jamesthurley.energy_dashboard__tariff_rate_graph.1.0.0",
"allow": [
{ "permission": "fonts" },
{ "permission": "registry_components" }
]
},
"energy_cash_flow": {
"component": "jamesthurley.energy_dashboard__energy_cash_flow.1.0.0",
"allow": [
{ "permission": "fonts" },
{ "permission": "registry_components" }
]
}
},
...
}
The allow section defines the permissions given to the render Component, which in this case gives it access to fonts and other registry components.
The callouts section defines what Components the render Component will call during execution, and the permissions given to those Components.
Each of the visualization Components we wrote in this post requires access to fonts, so they can render text, and permission to access other registry Components, so they can call their respective renderers (slipwayhq.svg, slipwayhq.echarts, slipwayhq.jsx).
This boilerplate is part of Slipway's zero-trust security model, which allows us to safely run Components written by others knowing they can only perform the actions we've explicitly given them permission to perform.
We could restrict these further, specifying exactly what fonts and Components each Component is allowed to access, but this is a reasonable compromise between security and complexity.
Loading the Visualizations
With that out of the way we define the input to the render Component, of which the two interesting parts are the host_config and card sections.
The Host Config
The "host config" is how Adaptive Cards allows a JSON layout to adapt across devices. Devices (hosts) define their specific colors, margins, fonts, and other theming properties in their host config.
In this case we're just constructing a simple host config using parts of our theme, setting the background and foreground (text) colors for the default and attention styles. We use the attention style for hour header at the top of the dashboard.
"containerStyles": {
"default": {
"backgroundColor": "$.context.device.theme.background_color",
"foregroundColors": {
"default": {
"default": "$.context.device.theme.foreground_color"
}
}
},
"attention": {
"backgroundColor": "$.context.device.theme.header_background_color",
"borderThickness": 0,
"foregroundColors": {
"default": {
"default": "$.context.device.theme.header_foreground_color"
}
}
}
}
}
The Card
I won't inline the entire card here as it is quite long, but you can expand the full energy_dashboard.json above to see them.
The card section is our original skeleton layout from the start of this post, tweaked slightly, and with the placeholder text replaced with our new visualization Components.
The snippet below shows an example of how the slipwayhq.render Component lets us insert one of our visualizations:
energy_flow_chart
"type": "Image",
"height": "180px",
"spacing": "large",
"url": "component://energy_flow_chart?width=$width&height=$height",
"body": {
"data": "$$.givenergy.today.day",
"theme": "$.context.device.theme"
}
},
So our Components, which return Canvases (which are just images), are inserted like any other image except they are using a special component:// URL scheme.
Starting with the request body, you'll see that it contains some JsonPath queries which are referencing part of the output of the givenergy Component, and our theme.
Aside
As mentioned in the docs, in the $$.givenergy syntax is just a useful shortcut for the JsonPath query $.rigging.givenergy.output.
Slipway uses these JsonPath queries to plan the execution order of Components, and will replace the queries with the referenced data before the slipwayhq.render Component is run.
Next, looking at the URL, when the slipwayhq.render Component comes across an image URL containing $width or $height variables it delays fetching the image until it has performed the layout pass, so that it knows the precise size the image needs to be.
It then replaces the $width and $height parameters with the actual width and height before passing the URL, along with the request body, to Slipway.
The slipwayhq.render Component doesn't actually care about the component:// scheme. It would do this for any image URL.
Slipway does understand the component:// scheme however. The scheme causes it to execute the requested Component, passing in the request body as the input.
The energy_flow_chart Component then executes and returns an image which is precisely the right size to be placed into the final dashboard.
While there is a bunch of complexity here, for the most part it is all handled for us behind the scenes by Slipway and the slipwayhq.render Component.
What it boils down to is that our Component is inserted into the Dashboard as an image, and Slipway takes care of running it.
Sharing the Components
I've published all these Components along with the example Rig in GitHub here.
I've also created a GitHub release, which means the Components are now automatically available in the Slipway Component Registry.
This means that anyone can now use these Components: Slipway will find and download them automatically if you reference them in your Rigs.
I'm using these Components in my own self-hosted Slipway server, and you can see how I do that here.
The Final Result
As I mentioned in the introduction, my current eInk TRMNL isn't color, but with some tweaking of the theme and some Atkinson dithering (automatically done by Slipway), it still looks great!
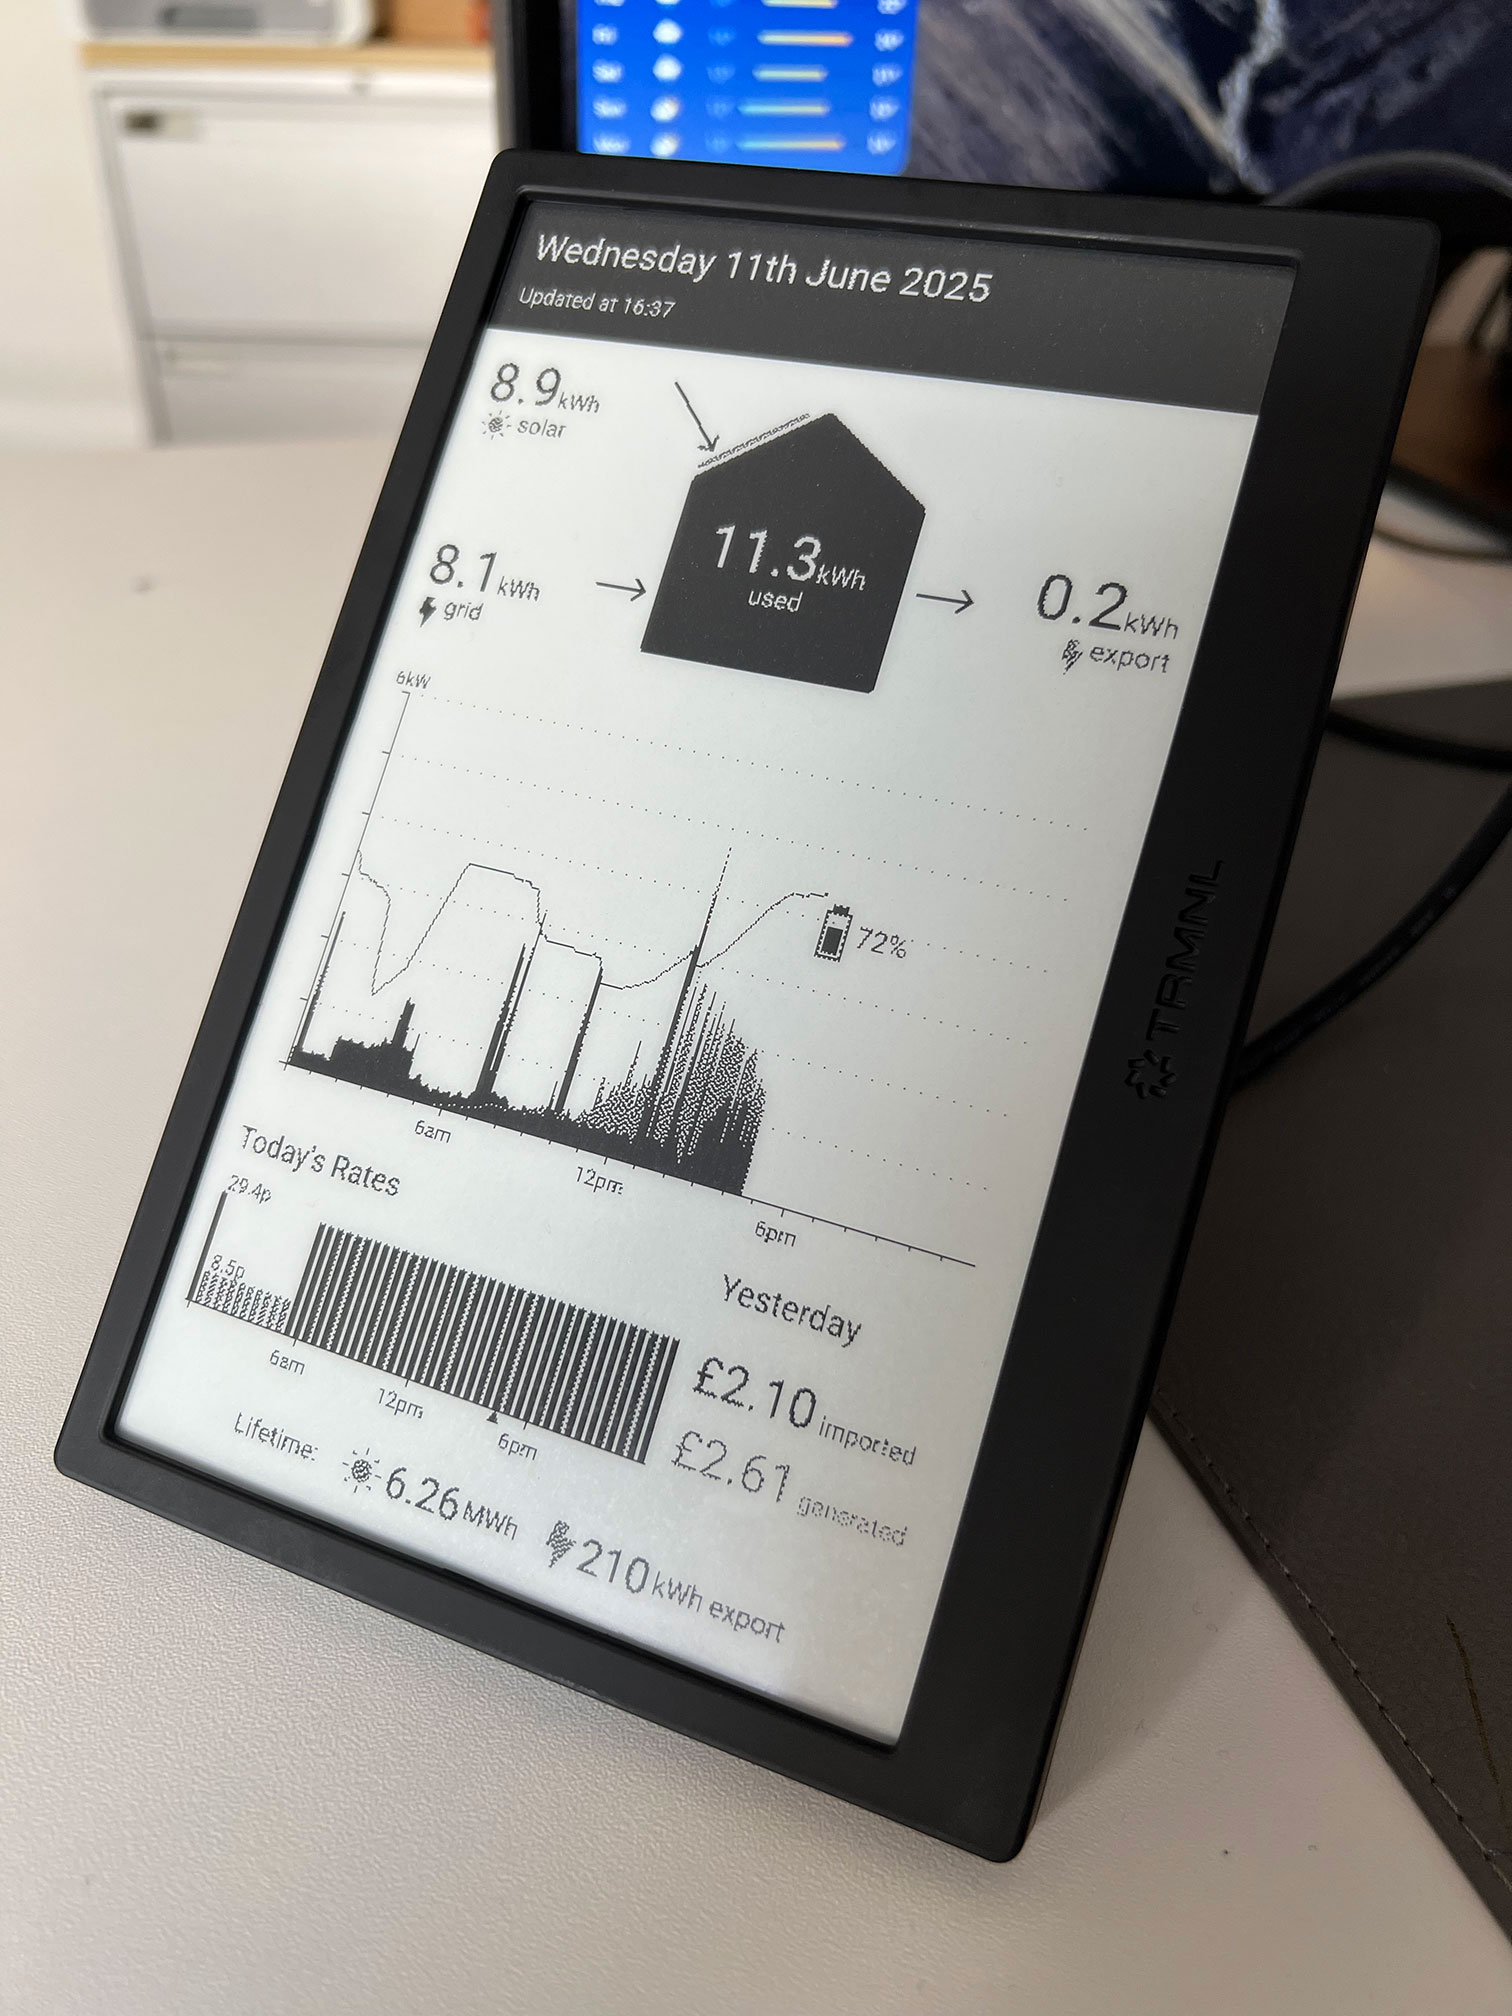
One Last Thing
We made this modular and themeable for a reason, so let's take advantage of that now and create bonus widget for my Apple Watch.
Here is a Rig for displaying the energy graph and cashflow on my Apple watch, using a dark mode theme and sized for the rectangular widget:
Show rigs/watch_energy_dashboard.jsonslipway_energy_dashboard/rigs/watch_energy_dashboard.json
"context": {
"device": {
"width": 450,
"height": 200,
"energy_dashboard_theme": {
"solar_color": "rgb(218, 133, 0)",
"grid_export_color": "rgb(218, 133, 0)",
"tariff_bar_low_color": "rgb(218, 133, 0)",
"grid_import_color": "rgb(222, 21, 0)",
"tariff_bar_high_color": "rgb(222, 21, 0)",
"power_used_color": "rgb(255, 255, 255)",
"battery_color": "rgb(18, 224, 222)",
"background_color": "rgb(0, 0, 0)",
"foreground_color": "rgb(255, 255, 255)",
"header_background_color": "rgb(218, 133, 0)",
"header_foreground_color": "rgb(0, 0, 0)",
"cash_flow_line_padding": 30
}
}
},
"rigging": {
"utils": {
"component": "jamesthurley.energy_dashboard__utils.1.0.1",
"input": {}
},
"givenergy": {
"component": "jamesthurley.energy_dashboard__givenergy.1.0.1",
"allow": [
{
"permission": "env",
"prefix": "GIVENERGY_"
},
{
"permission": "http",
"prefix": "https://api.givenergy.cloud/"
}
],
"input": {}
},
"octopus_tariff": {
"component": "jamesthurley.energy_dashboard__octopus_tariff.1.0.1",
"allow": [
{
"permission": "env",
"prefix": "OCTOPUS_"
},
{
"permission": "http",
"prefix": "https://api.octopus.energy/"
}
],
"input": {}
},
"render": {
"component": "slipwayhq.render.0.7.0",
"allow": [
{
"permission": "fonts"
},
{
"permission": "registry_components"
}
],
"callouts": {
"energy_graph": {
"component": "jamesthurley.energy_dashboard__energy_graph.1.0.1",
"allow": [
{ "permission": "fonts" },
{ "permission": "registry_components" }
]
},
"energy_cash_flow": {
"component": "jamesthurley.energy_dashboard__energy_cash_flow.1.0.1",
"allow": [
{ "permission": "fonts" },
{ "permission": "registry_components" }
]
}
},
"input": {
"debug": false,
"host_config": {
"containerStyles": {
"default": {
"backgroundColor": "$.context.device.energy_dashboard_theme.background_color",
"foregroundColors": {
"default": {
"default": "$.context.device.energy_dashboard_theme.foreground_color"
}
}
},
"attention": {
"backgroundColor": "$.context.device.energy_dashboard_theme.header_background_color",
"borderThickness": 0,
"foregroundColors": {
"default": {
"default": "$.context.device.energy_dashboard_theme.header_foreground_color"
}
}
}
}
},
"canvas": {
"width": "$.context.device.width",
"height": "$.context.device.height"
},
"card": {
"type": "AdaptiveCard",
"body": [
{
"type": "ColumnSet",
"bleed": true,
"height": "stretch",
"columns": [
{
"type": "Column",
"width": "stretch",
"items": [
{
"type": "Image",
"height": "stretch",
"url": "component://energy_graph?width=$width&height=$height",
"body": {
"power": "$$.givenergy.today.power",
"theme": "$.context.device.energy_dashboard_theme"
}
}
]
},
{
"type": "Column",
"width": "110px",
"spacing": "none",
"verticalContentAlignment": "bottom",
"items": [
{
"type": "Container",
"height": "stretch",
"items": []
},
{
"type": "TextBlock",
"height": "auto",
"size": "large",
"text": "Yesterday"
},
{
"type": "Image",
"height": "50px",
"spacing": "small",
"url": "component://energy_cash_flow?width=$width&height=50",
"body": {
"power": "$$.givenergy.yesterday.power",
"day": "$$.givenergy.yesterday.day",
"prices": "$$.octopus_tariff.yesterday",
"generation_rate": 25.84,
"theme": "$.context.device.energy_dashboard_theme"
}
},
{
"type": "Container",
"height": "stretch",
"items": []
}
]
}
]
}
]
}
}
}
}
}
Here is how that renders:
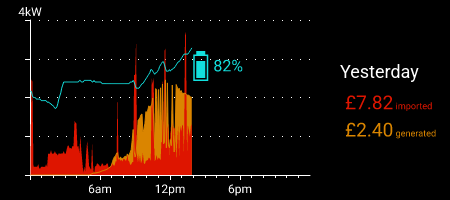
And finally, here is how it looks running on my (very battered looking) watch:
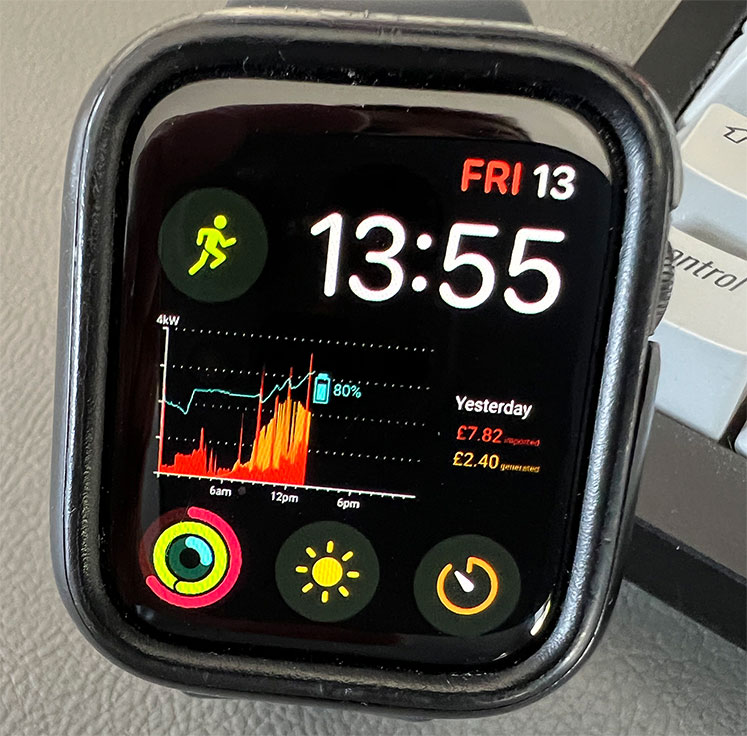
I could really do with adding some additional theme parameters for font sizes, and support for high density displays, but I think that will do for the sake of getting this post published.
Conclusions
The Energy Dashboard
I'm super happy with how the dashboard turned out, and how closely it matches George Cave's original design. If he comes across this, I hope he takes the imitation as flattery.
While this was quite a long post, with a fair amount of code, I think each individual Component is quite short and simple.
The real goal of Slipway is that when I have an idea for something I want to display "ambiently", so on an eInk screen in my home, or a widget on my watch, to reduce the amount of boilerplate right down to just the code required for the particular job at hand.
This was the first "proper" dashboard I've written in Slipway and I'm really happy with how much I've achieved that goal.
Slipway Improvements
As I implemented the dashboard I came across some issues which have been added to the backlog.
This section is as much to keep a record for myself as much as it is to inform others.
-
Javascript performance. As I mentioned above, Javascript performance is becoming an issue with more complicated Rigs like the one we've just created. I'm going to try moving to a different Javascript runtime which should in theory be much faster. I do it reluctantly as I really want to stick with Boa, but unfortunately some of these big libraries like ECharts and Satori are just taking too long to execute.
-
Support for different pixel densities. This hasn't been an issue for me yet, but I can see it becoming an issue soon. At the moment if you specify a really high resolution display you'll get very small fonts, requiring you to make font sizes configurable. I think if I added support for specifying pixel densities it would help a lot.
-
Streamlined releasing. Currently if you want to publish your Components it's fairly easy, but there are some chores which you have to do that could be automated by Slipway itself, such as updating version numbers in various places.
-
Integrated testing. Right now if you're writing a Component in Rust then testing is easy as you can just use cargo test. However if you're writing a Javascript Component it isn't clear where to put unit tests. Plus if you want to have integration tests on Rigs you have to set that up manually. I feel like these scenarios are common enough that Slipway itself could offer a solution.
-
Default fonts. I improved the default font handling as I wrote this blog post, but right now there isn't an easy way to override the default font for the entire Rig.
These are currently next on my todo list, and I'll blog about them as I get to them.
Give Slipway a try!
If you want to give Slipway a go yourself, the front page is a good place to start, or the docs.
I'd also love to chat about any issues you have, ideas you have, or see what you've created in the Zulip chat.
I've also just started an Instagram account where I'll post anything Slipway related.
Thanks for reading!