.png)

This week, I noticed a tweet announcing OpenTelemetry (OTel) support in Claude Code - Anthropic’s AI-powered coding assistant that lets you delegate tasks directly from your terminal. This new OTel integration allows you to stream token, session, and command metrics to any backend that speaks the OpenTelemetry Protocol (OTLP). Curiously, this feature hasn’t landed in the official changelog yet. Below, we’ll explore three different approaches to wiring Claude Code metrics into Datadog, the trade-offs between each method, and how to leverage these metrics effectively.
Greg ships the most 🚀🔥
Why instrument Claude Code?
Okay, so first, why might you want to track these metrics? Here are some of the first ideas that came to mind for me:
- Velocity analytics: Correlate AI adoption (or model changes!) with velocity (e.g. with commits) via the github integration, closed tickets via the Jira integration or deployments
- Incident correlation: be confident your increased velocity isn’t compromising availability by intersecting usage data with DDOG Incident Management or the Pagerduty integration
- Cost governance: Alert on anomalous token usage or simply roll it up alongside your cloud costs
- Because data is cool!
Let’s Get Started
You’ll need a few things before we dive in:
- Claude Code (duh)
- A Datadog account
- Something that can ingest OTel metrics, such as:
- A Datadog agent running somewhere (I use an SSH tunnel protected by Cloudflare zero trust tunnels to my server to avoid paying for an extra host).
- Some other OTel collector/exporter like Vector … more on this later.
- Access to Datadog’s Agentless OTLP Intake API (in preview)
Configuring Claude Code
No matter which option you choose, you’ll need to tell Claude Code to emit metrics. You can either set the environment variables (e.g. in .zshrc), via ~/.claude/settings.json or the MDM approach through /Library/Application Support/ClaudeCode/managed-settings.json. Claude Code config docs for more information on these.
| #1 Local Agent | http://127.0.0.1:4317 | grpc | Not required |
| #2 Remote Agent via tunnel | http://127.0.0.1:14317 | grpc | Not required |
| #3 Agent-less API | https://api.datadoghq.com/api/v1/otlp | http/protobuf | DD-API-KEY=<YOUR_DATADOG_API_KEY> |
Copy these values into your chosen Claude Code config location (~/.claude/settings.json, environment variables, or MDM). For example, assuming you’re going with a local agent
Next, let’s ensure we have something to listen for the metrics and enumerate some of the available options
Option 1: Local Datadog Agent
If you’re already running a local agent, this is the easiest option. If you aren’t, note that this will count as an additional host as part of your DDOG bill and you’ll need to provision an API key as part of the installation.
- Enable OTLP ingest by adding this to your Datadog agent config:
Then restart the agent, for non-osx incantations see agent commands.
- Verify your metrics by running a simple command like claude-code run "hello", then check your Datadog Metric Summary and filter for claude_code.*.
Option 2: Remote Agent
If you aren’t already running an agent locally, OTLP metrics are a reasonably poor value proposition for doing so. A remote (shareable) centralized agent is a simple, handy, and cost effective approach.
Configure the remote agent with the same OTLP settings as Option 1.
Set up your SSH tunnel (optional) by adding to your ~/.ssh/config:
I’m using Cloudflare Zero Trust here, which provides a nice secure gateway without having to open ports on your server. If you have a host that’s protected by VPN, you can likely skip the tunnel.
- Keep the tunnel alive with autossh - create a launchd plist for macOS:
Save this to ~/Library/LaunchAgents/com.user.autossh.plist and load it with:
Option 3: Agent-less OTLP Intake API
This is the shiniest and lightest-weight approach - no agent to maintain, no tunnels to establish. You talk directly to Datadog’s API. However:
- Every dev machine needs its own API key (which lack scoping capabilities)
- The OTLP intake endpoint is still in preview as of May 2025, so you must fill out a form for access
Sample configuration values:
Troubleshooting Tips
If you’re not seeing metrics, here are some troubleshooting steps:
- console output: Enable console outputs by changing OTEL_EXPORTER_OTLP_PROTOCOL to "grpc,console".
- If you don’t see console output, it’s very likely your JSON is invalid in the config file or you have an old Claude Code
- Check tcp connections: Run lsof -i :14317 (or :4317 for a local agent) to check that your ssh tunnel or datadog agent are listening on the right port
- Verify agent config: Run sudo datadog-agent status | grep -A10 OTLP to check if the OTLP receiver is properly configured
- tcpdump to the rescue: try sudo tcpdump -i any port 14317 -s0 -X -v to monitor traffic
- catching ddog api errors: if you’re using the agentless approach, here’s a handy script to watch errors from the OTLP intake endpoint
A good output from the debug script looks like this:
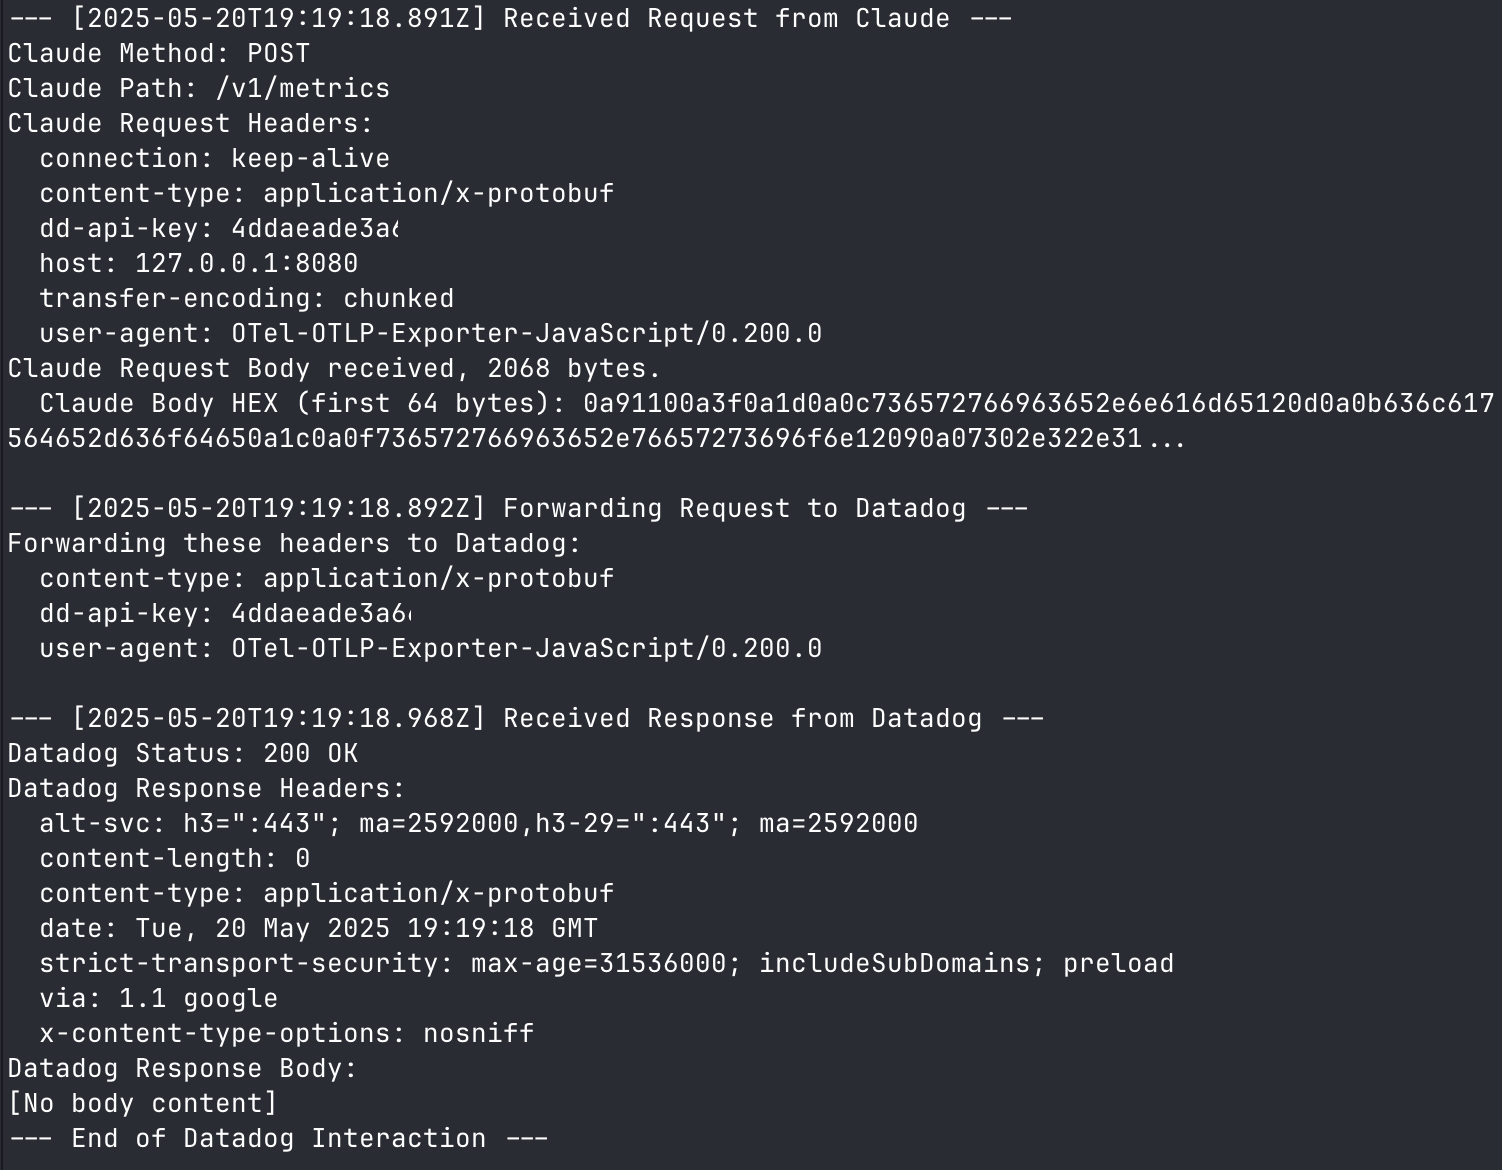
Successful connection to Datadog OTLP intake
Assuming all is well, you should now see your metrics appearing in the Datadog UI 🎉
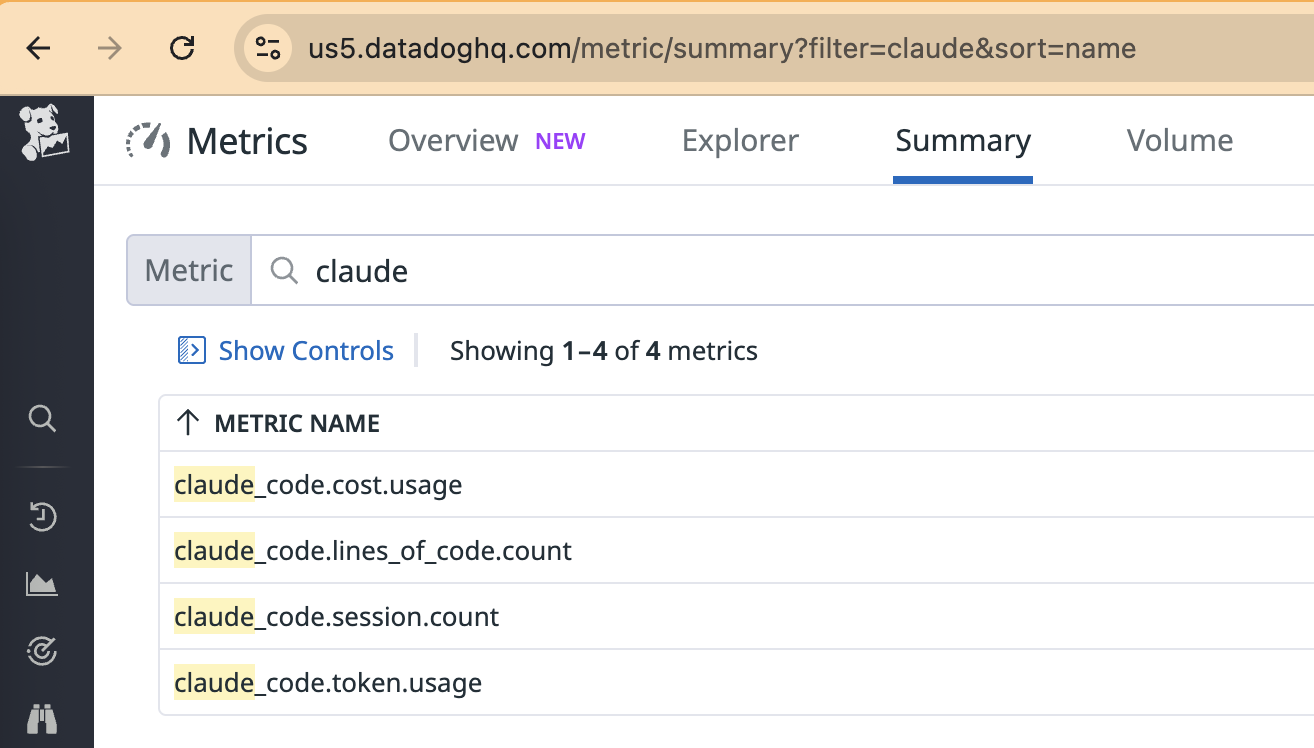
Metrics successfully appearing in Datadog
Key Metrics
Claude Code emits several useful metrics that you can monitor:
| claude_code.commit.count | Counter | Number of git commits created | - |
| claude_code.cost.usage | Counter | Cost of Claude Code usage | model |
| claude_code.lines_of_code.count | Counter | Lines of code added/removed | type[added/removed] |
| claude_code.pull_request.count | Counter | Number of pull requests created | - |
| claude_code.session.count | Counter | Number of CLI sessions started | - |
| claude_code.token.usage | Counter | Number of tokens consumed | type[cachecreation/cacheread/input/output], model |
All metrics include the following common tags:
organization.id • service • session.id • user.account_uuid • user.email • user.id • version • host
Here’s a visual view of what some tag pairs look like
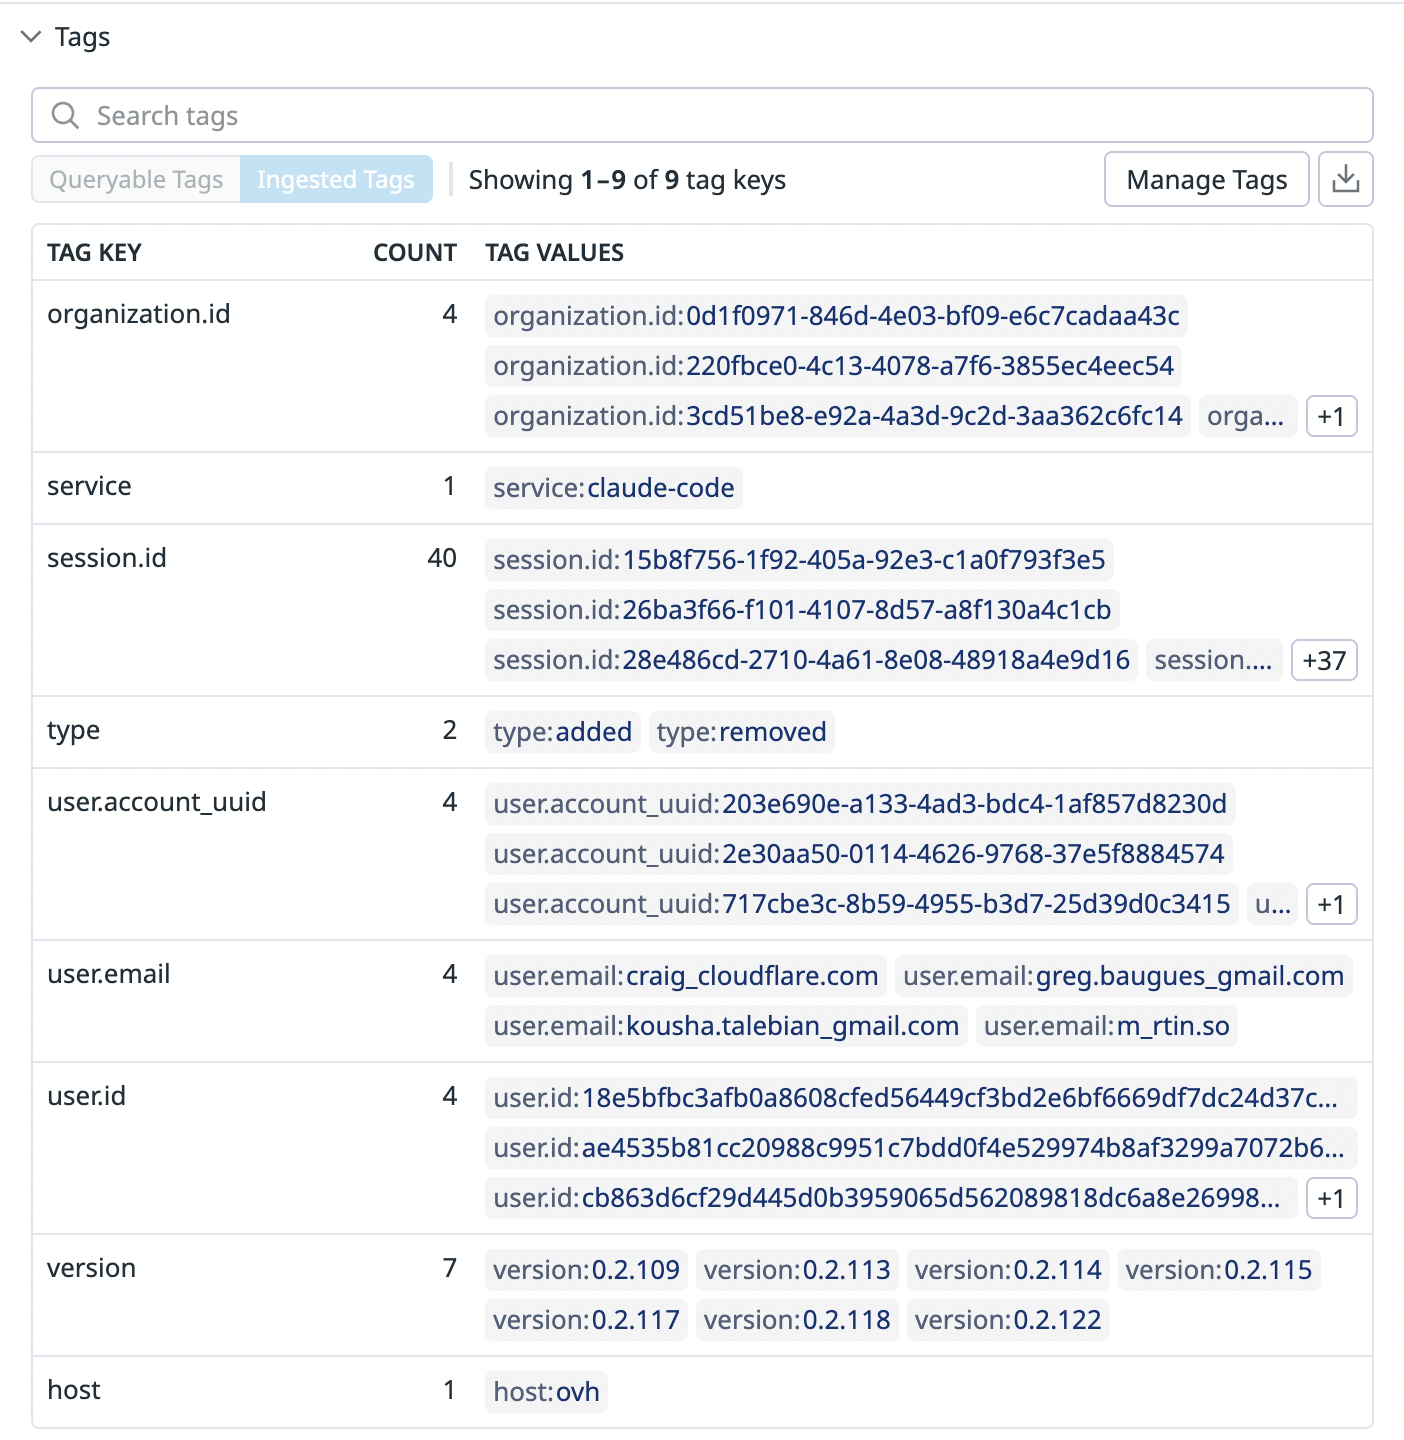
Claude Code metric tags as shown in the Datadog UI
Mitigating Security Concerns
Having unscoped API keys over hundreds of developer machines presents many challenges with everything from metric integrity to data exfiltration and potential cost catastrophes. Let’s look at some ways to mitigate these without compromising visibility.
Best Practices
First, establish defensive monitoring. Create a monitor on overall metrics usage via datadog.estimated_usage.metrics.custom to catch runaway cardinality at a global level. For a more granular, approach you can monitor individual metrics via datadog.estimated_usage.metrics.custom.by_metric
The sample anomaly monitor below will trigger if any metric hits 3 standard deviations above its weekly baseline and is emitting over 1000 unique time series. When tuned to your organization’s scale, this multi-condition approach prevents alert fatigue while still catching expensive outliers.
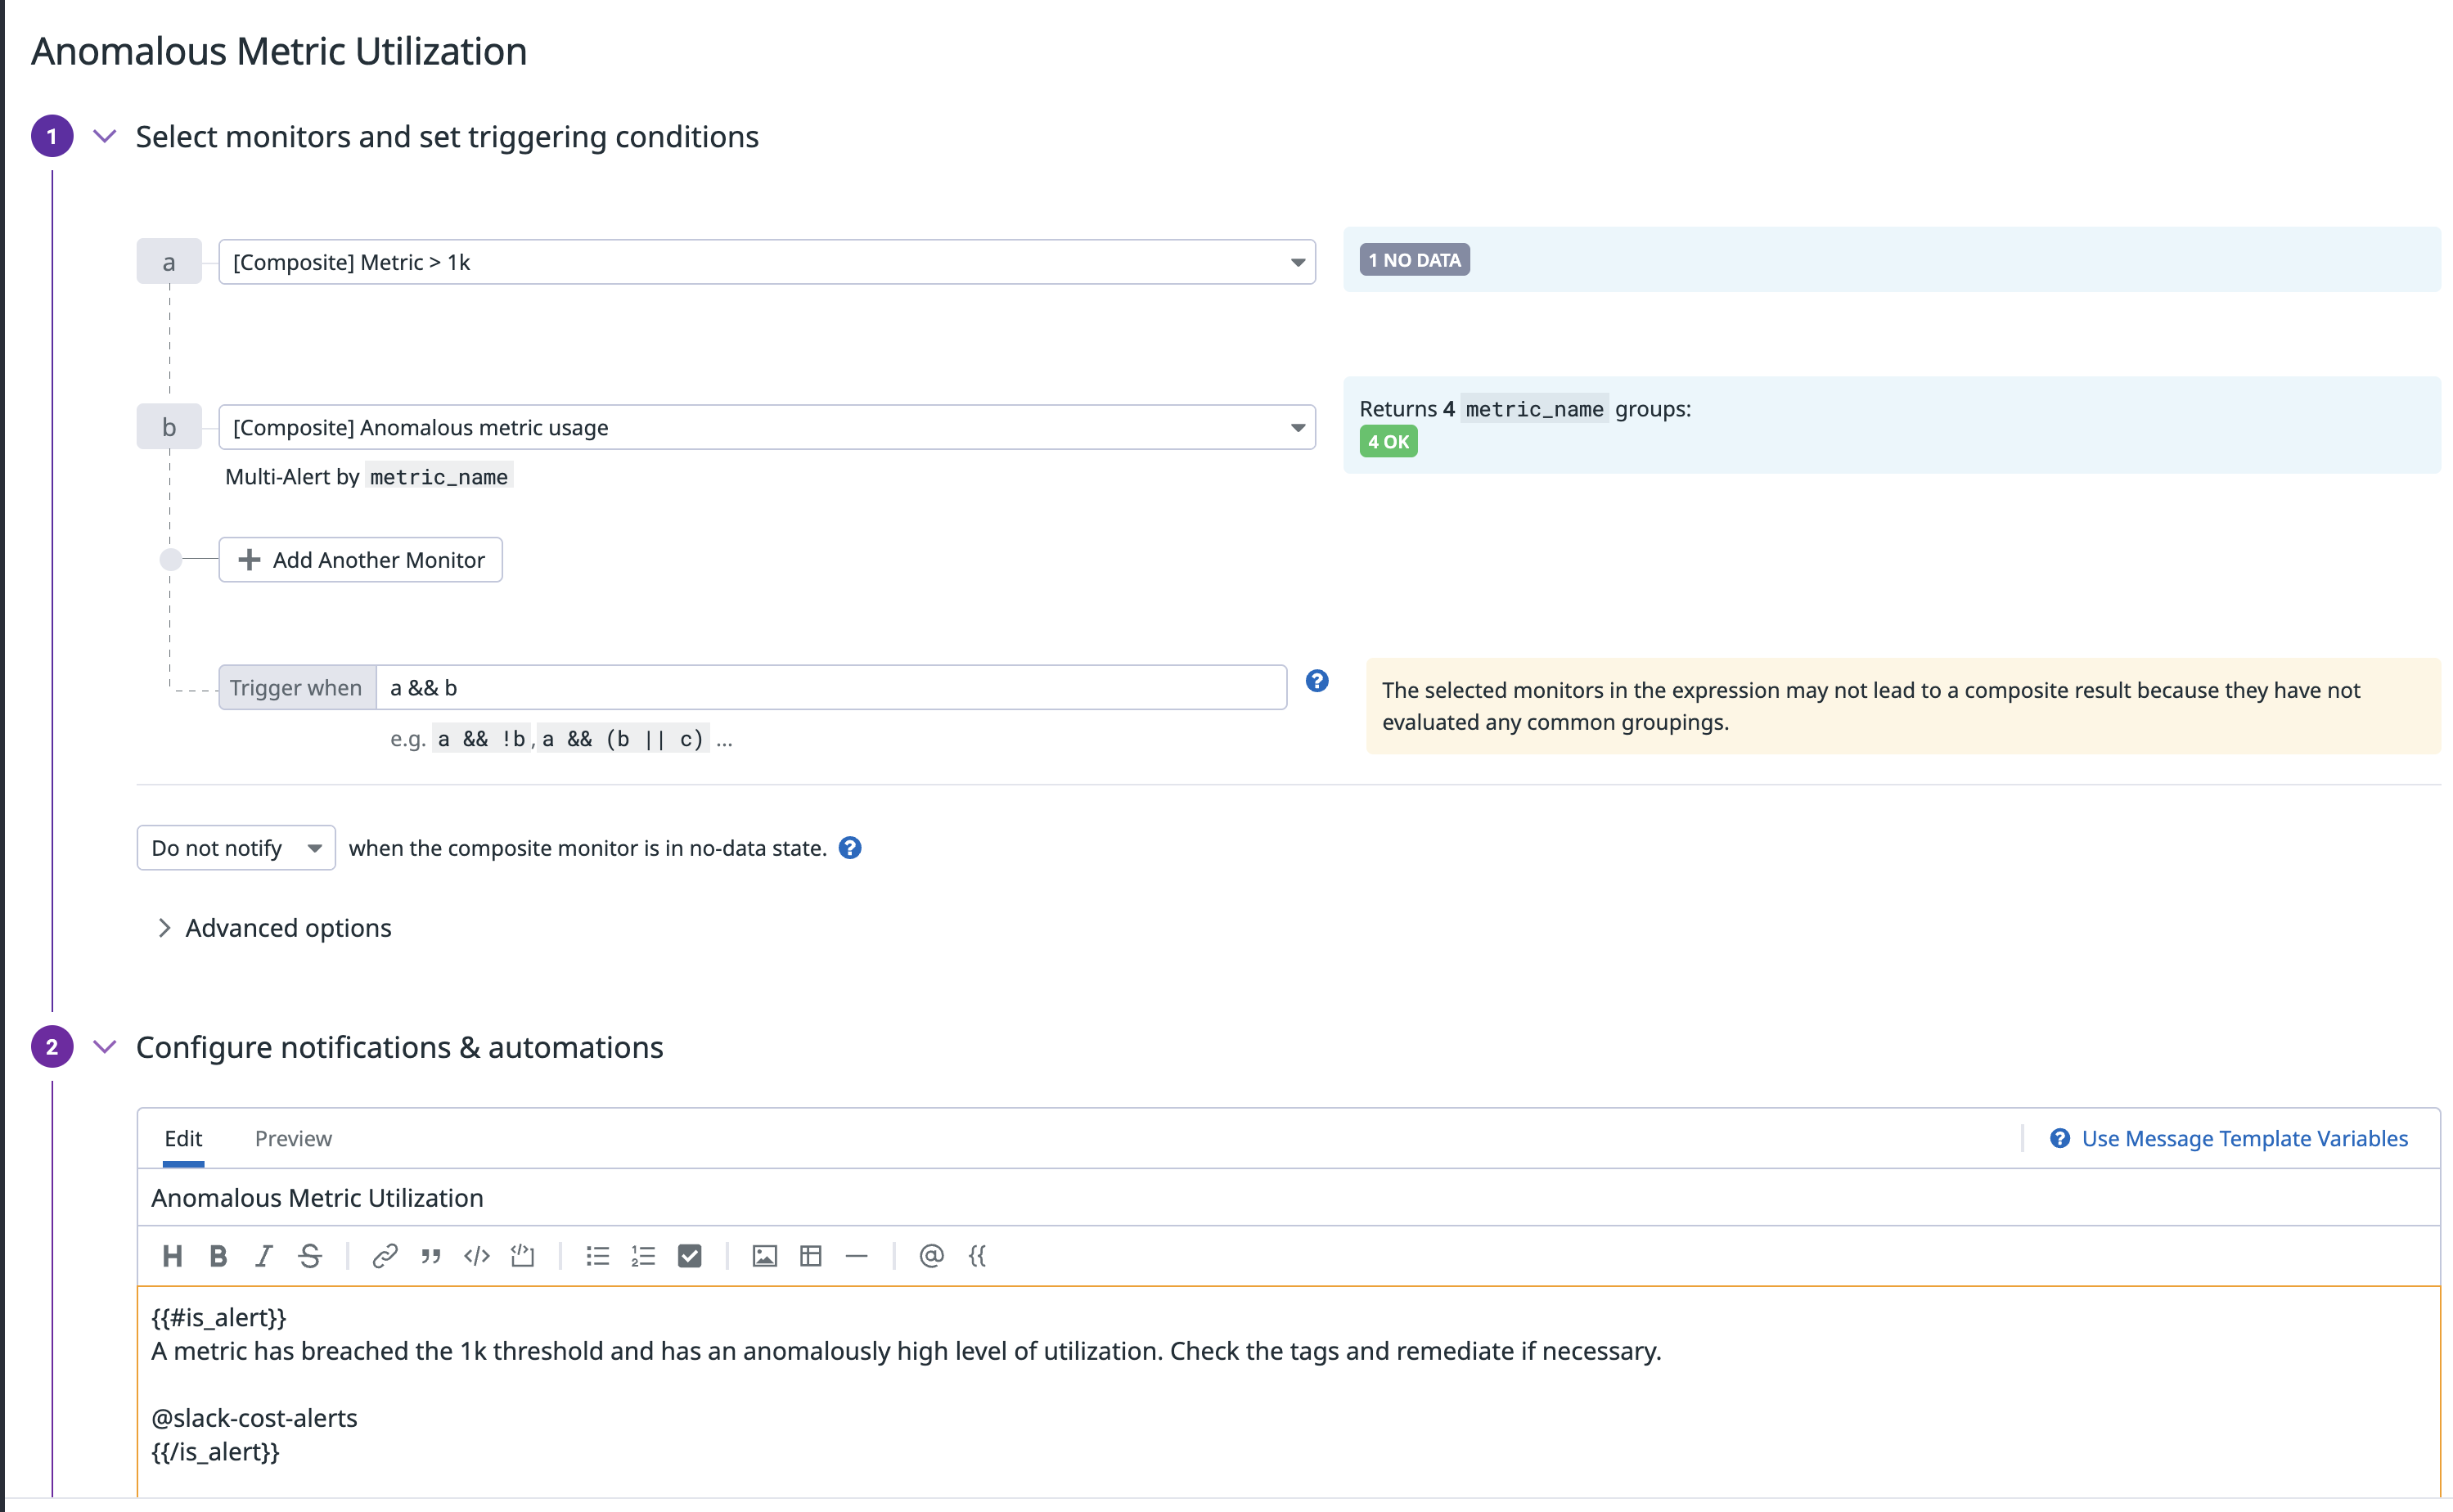
Anomaly detection monitor for custom metrics usage
Next, get surgical with metrics without limits to specify exactly which tags matter for each metric. Claude Code does have some configurability here via OTEL_METRICS_INCLUDE_SESSION_ID, OTEL_METRICS_INCLUDE_VERSION and OTEL_METRICS_INCLUDE_ACCOUNT_UUID but it’s safer at the ingest level.

Metrics Without Limits configuration to control which tags are indexed
Vector
Vector is close to offering an elegant solution for OpenTelemetry metrics ingestion. This lightweight, Rust-based open-source tool already acts as a powerful observability pipeline, with existing support for OTLP logs and traces. The missing piece - OTLP metrics support - is currently in review. Once merged, Vector will provide a complete metrics gateway solution. This positions Vector as a particularly efficient option for managing observability data flows across your infrastructure.
Here’s a proposed sample Vector pipeline that should address these concerns shortly:
Once available, this minimal config will deliver filtering, cardinality control, and centralized API management. Deploy it on a single gateway server to reduce your attack surface by orders of magnitude. Until then, an OpenTelemetry Collector can serve as a temporary bridge.
Future Improvements I’d Like to See
- Claude Code support for adding custom tags (e.g., to decorate with project, repo, team, etc.)
- I did notice an undocumented OTEL_RESOURCE_ATTRIBUTES is in the CLI, but I couldn’t make it do anything useful
- Improved debugging from the Claude Code CLI for telemetry issues (e.g. for invalid json, errors from OTLP endpoints, etc.)
- Ability to scope API keys in Datadog to mitigate the blast radius of distributing keys to hundreds/thousands of engineers
- Bonus points if you can also scope what metrics they can emit without Vector
- Vector OTLP Metrics support soon!
Conclusion
You can’t improve what you can’t measure, and OTel support shows a strong commitment to the enterprise from Anthropic. Datadog’s agentless intake API is perfectly timed to capitalize on the movement towards more fragmented autonomy that will undoubtedly need to be observed.
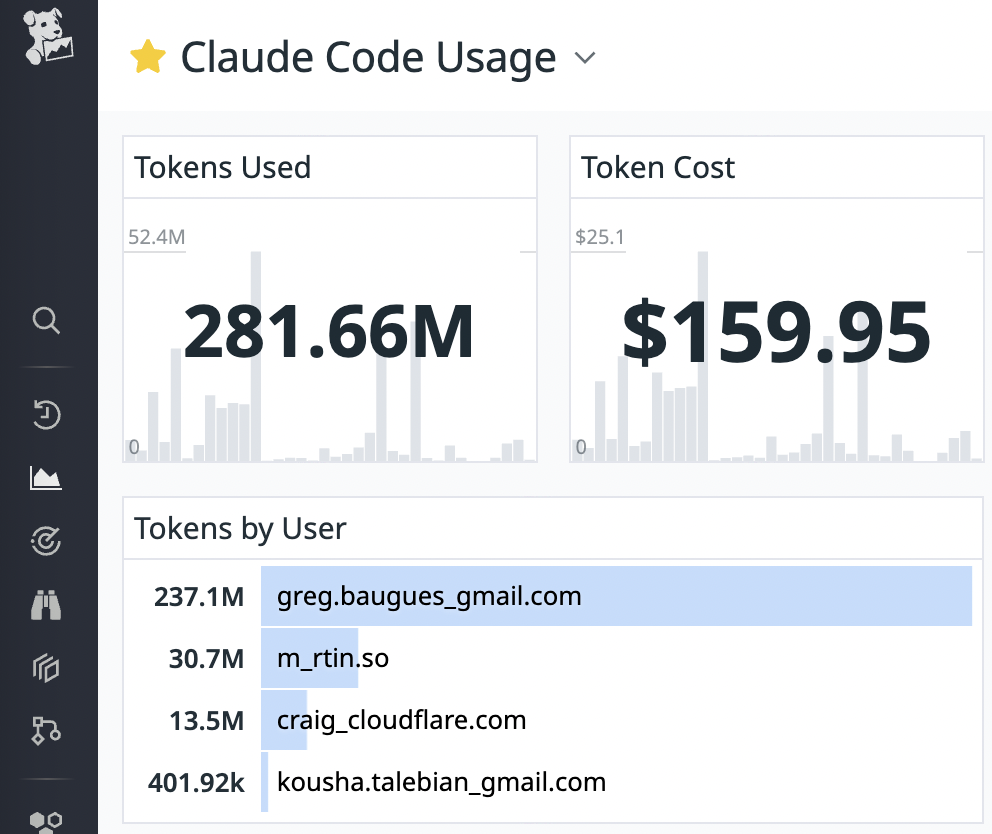
Here’s a more comprehensive Claude Code metrics dashboard:
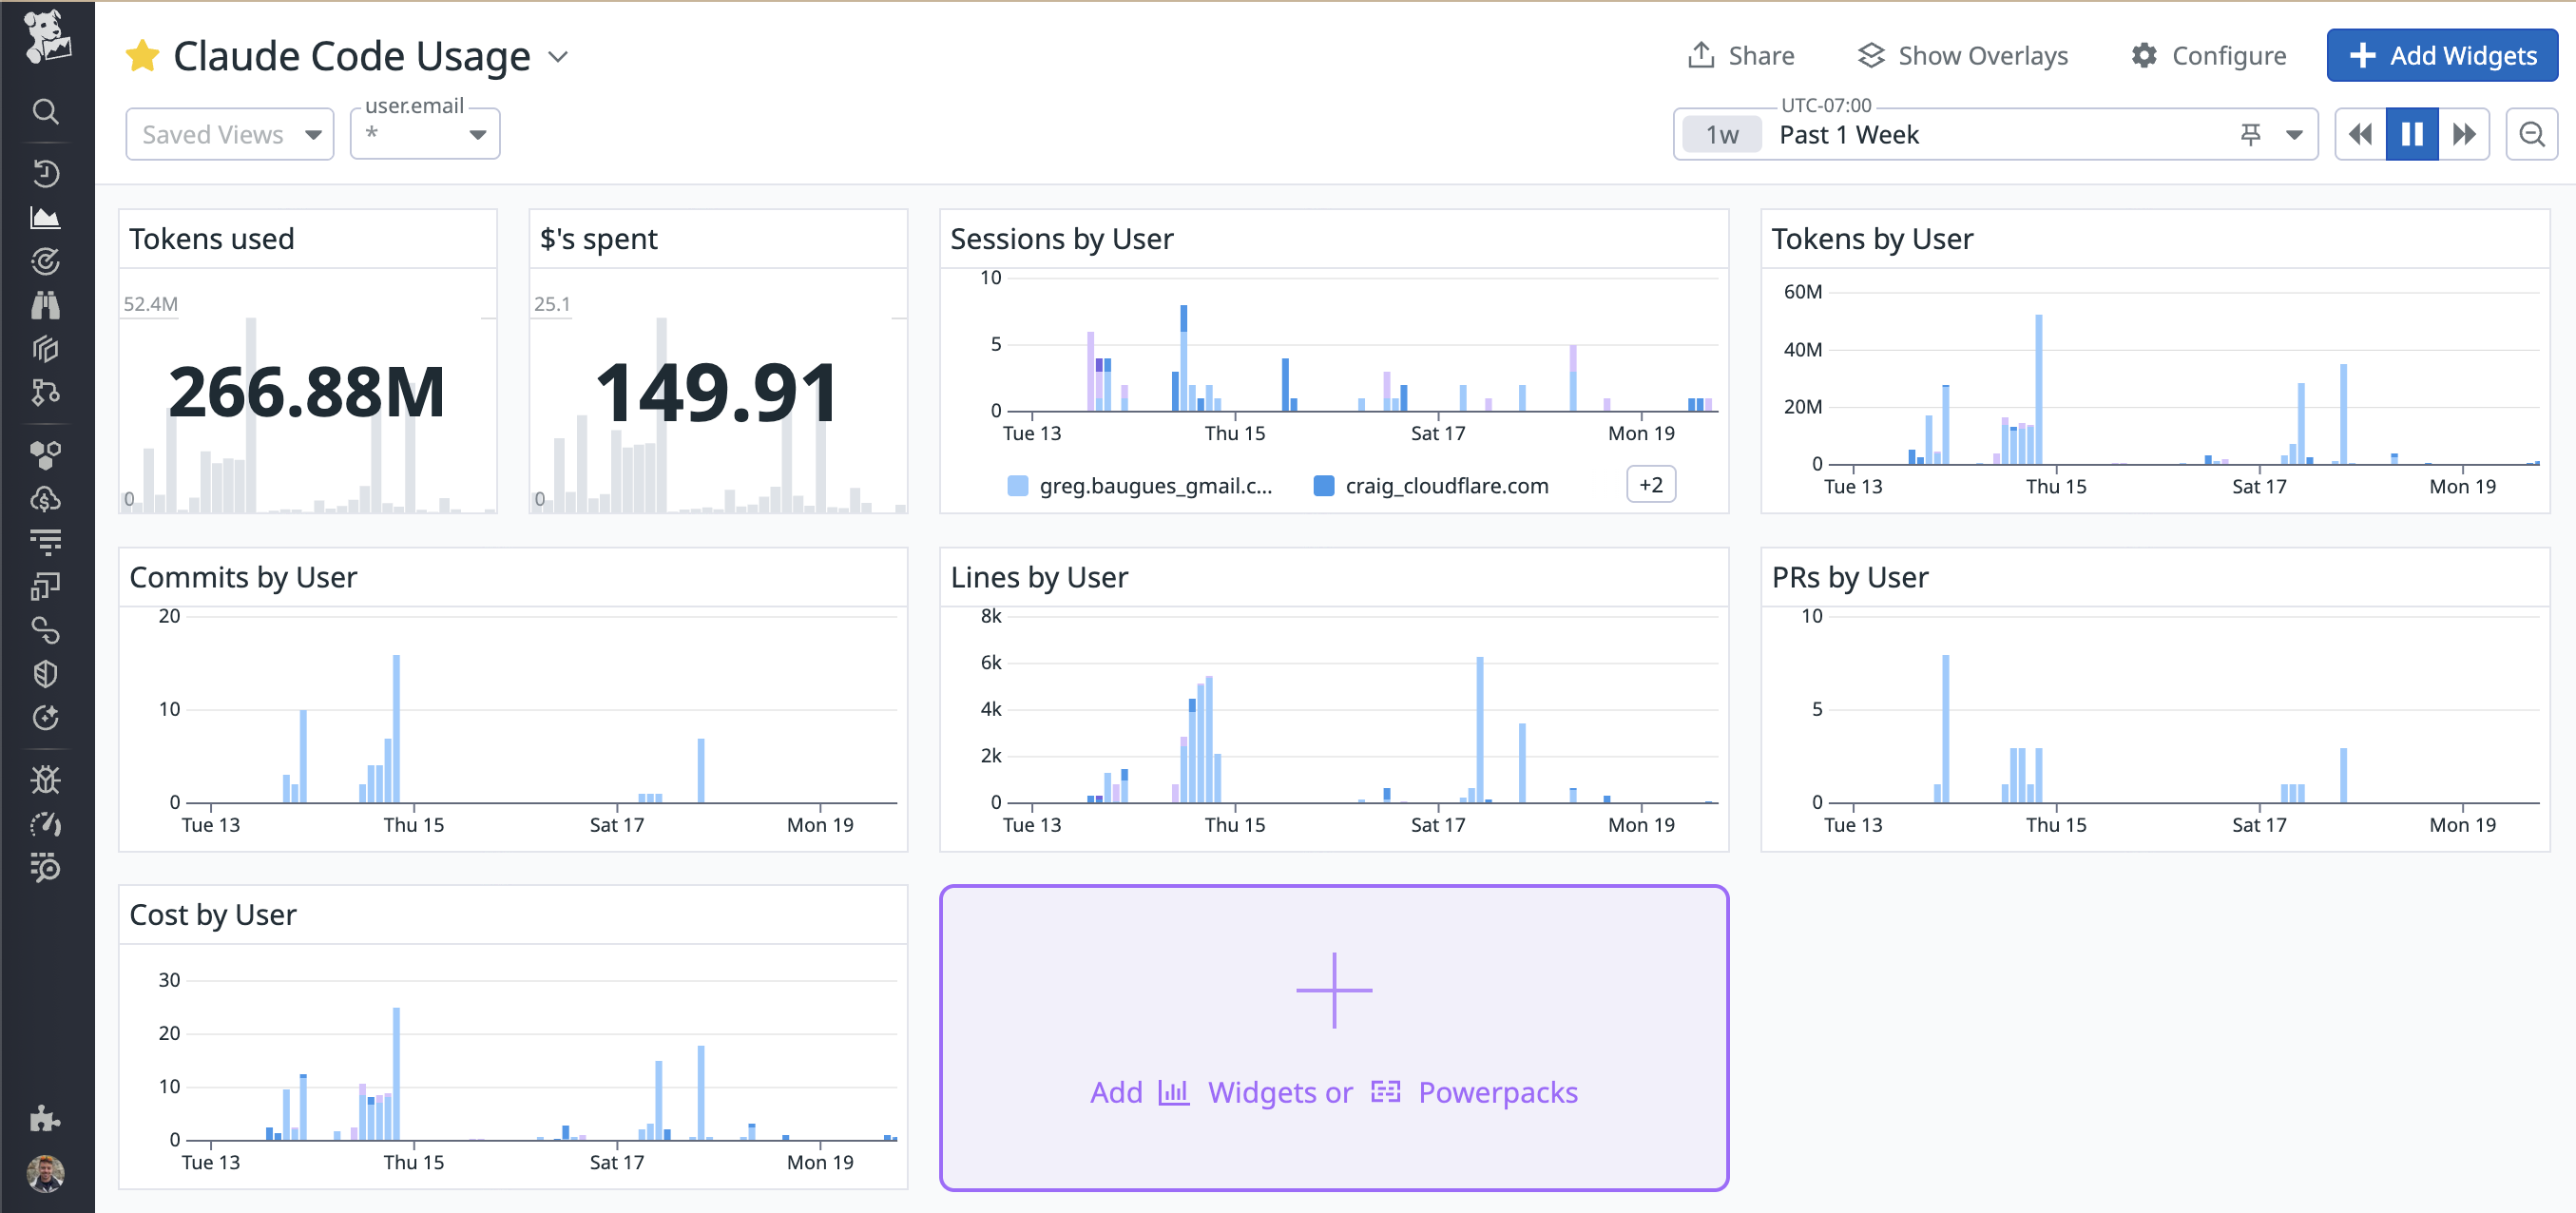
Sample Claude Code Usage dashboard in Datadog
The JSON for easy import of this dashboard is available here.
Anything I missed? Questions, feedback, comments? Hit me up on X!
Thanks to Greg, Craig, & Kousha for sending over some metrics to my sandbox datadog instance for prettier graphs :)


