.png)

I decided to write this post because something that seemed simple and easy, turned into a deep rabbit hole of UPS units, USB updates, serial cables, network cards, and other mess…
Introduction
It all starts when I decided to change the UPS that keeps the server/cabinet running. I had found an offer on Amazon for the same UPS as my actual one but the new model, which has the option to be monitored via apcupsd exporter, this is the model: APC Back-UPS BX500MI (which was replacing this: APC Back-UPS BX500CI)
When it arrived and I installed it, I immediately noticed that the entire server was consuming 8/10W more than before. Additionally, this new UPS was heating up a lot! I put my hand on it and felt it quite hot, while the previous one consumed less and, most importantly, didn’t heat up at all.
Anyway, with the new BX500MI’s USB cable connected to my Prometheus/Grafana server using apcupsd, I built a useful dashboard displaying extensive info (UPS load, temperature, voltages, etc.).
…but the consumption and heat were too high, so I decided to return it to Amazon. I was disappointed to lose the dashboards by switching back to the old UPS, so I opted to use an old spare UPS I was using for the Intel iMac 27", the excellent APC SMT750I - Smart-UPS. This medium/high-end UPS features a pure sine wave, display, USB and serial ports, network card, etc. Although I initially thought it was “wasteful” to use it for a small server, it has the advantage of consuming very little power online—less than the first APC BX500CI UPS and less than half of the new BX500MI (just a dozen watts)..
Instead of doing nothing, I chose to use the APC SMT750I because its USB port allowed me to monitor it in Grafana.
And that’s where the rabbit hole started:
Installation
When I decided to replace the old one, I measured the cabinet and saw it fit perfectly inside. However, during installation, I encountered an issue I hadn’t considered: the cables and ports on the back =[
Due to the IEC power sockets and USB cable, the UPS stuck out of the cabinet by 8/10 cm.
I didn’t give up, I used a drill to widen the back of the furniture I use as a cabinet.
After spending a few hours taking out all the hardware, expanding the hole and reassembling, everything worked and the UPS was perfectly flush (it was even better because I had widened the hole on the back of the cabinet for the cables, and they passed through more easily):

But I immediately found a problem:
Issues with metrics and USB
This UPS exposed very few data via USB!
Basically only whether the UPS was running on battery or electricity, and the voltage. That’s it. Much less than the other one, which also exposed temperature, load, input/output voltages, number of power outages, etc…
Investigating, I noticed that the firmware was very old, from 2010.
So I decided to…
Update the firmware…
…to see if more information could be obtained via USB on a 15-years-newer firmware (as it was supposed to be).
The update process started with Windows because there is no update tool for macOS or Linux, so I connected the USB cable to a miniPC and tried updating using “APC Firmware Upgrade,” but it never found any UPS connected to the PC.
Hmm, I started investigating and discovered that the old versions of this firmware did not allow updating via USB but only via serial! That’s why the APC Firmware Upgrade utility couldn’t even read/find the UPS.
What the [insert insults]…
I decided to look for its serial cable at home but couldn’t find it (after all, it was 15 years old), so I decided to get one via Aliexpress.
🤬
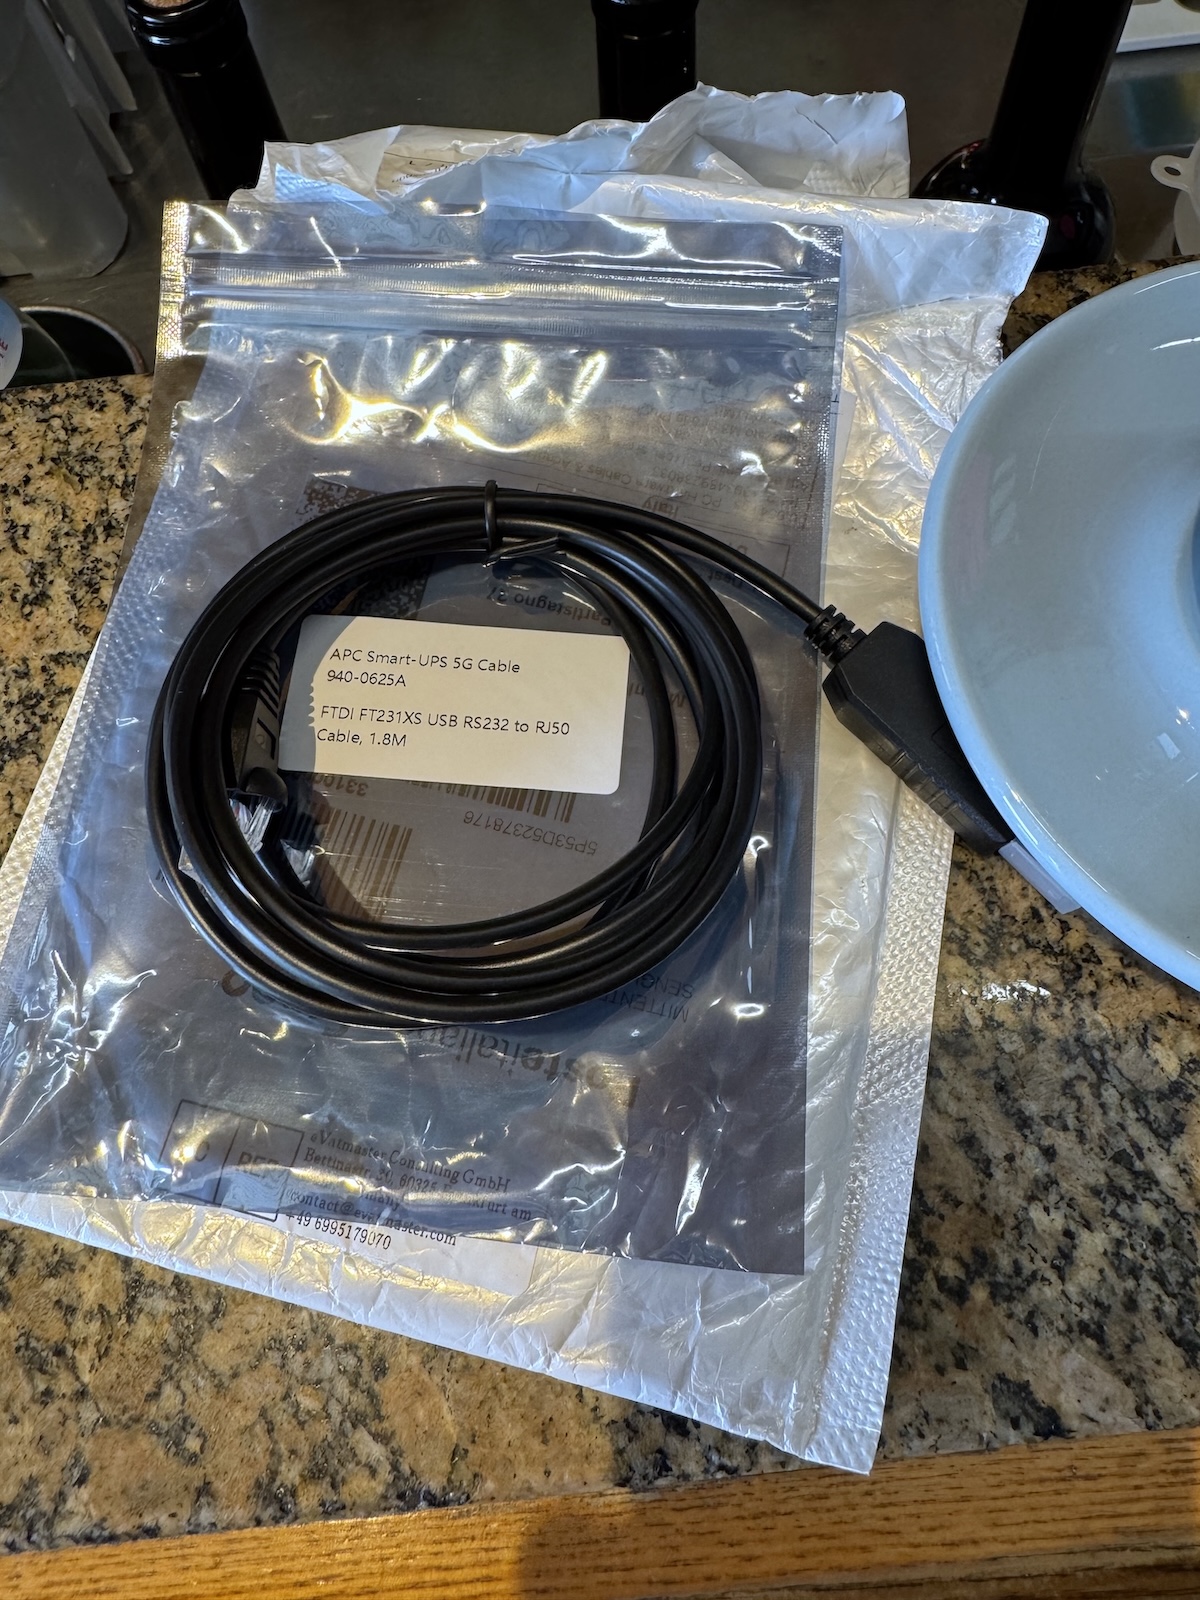
Just so you know, these damn APC UPS units use a proprietary serial cable: RJ50 –> USB with a custom pinout (and if you use the wrong cable, you might even fry the serial port)
The cable I bought for about 10€ is this one: FTDI USB RS232 to RJ50 RJ45 10P Modular Plug for APC Smart UPS
…to see if more information could be obtained via USB on a 15 years newer firmware (as it was supposed to be).
Well, after ~10/12 days the cable arrived, and I went quickly to update the firmware, and everything was quite simple.
But when I restarted the apcupsd_exporter, I noticed that the information/metrics it provided was always the same!
Damn, all that work for nothing! The only real improvement is that the new firmware lets you turn off or dim the display light… well, at least there’s that!
But I didn’t give up this time either =)
Monitoring via network card
I remembered at work having monitored a UPS like this one (the APC’s SMT serie) using the network card, and that it provided very advanced metrics and details.
So I decided to learn about the network card for this UPS and discovered it can use the old AP9630 / AP9631 cards or the newer AP9640 / AP9641 models.
The price of the new cards was outrageous: over 3/400€! But on German eBay, I found the AP9631 model (the final “1” indicates the more advanced version with environmental monitoring of temperature and humidity) for 35€ + 15€ shipping. Nice, I decided to buy it, and in just 3 days it arrived at my house.
AP9631 Smart Network Card 2
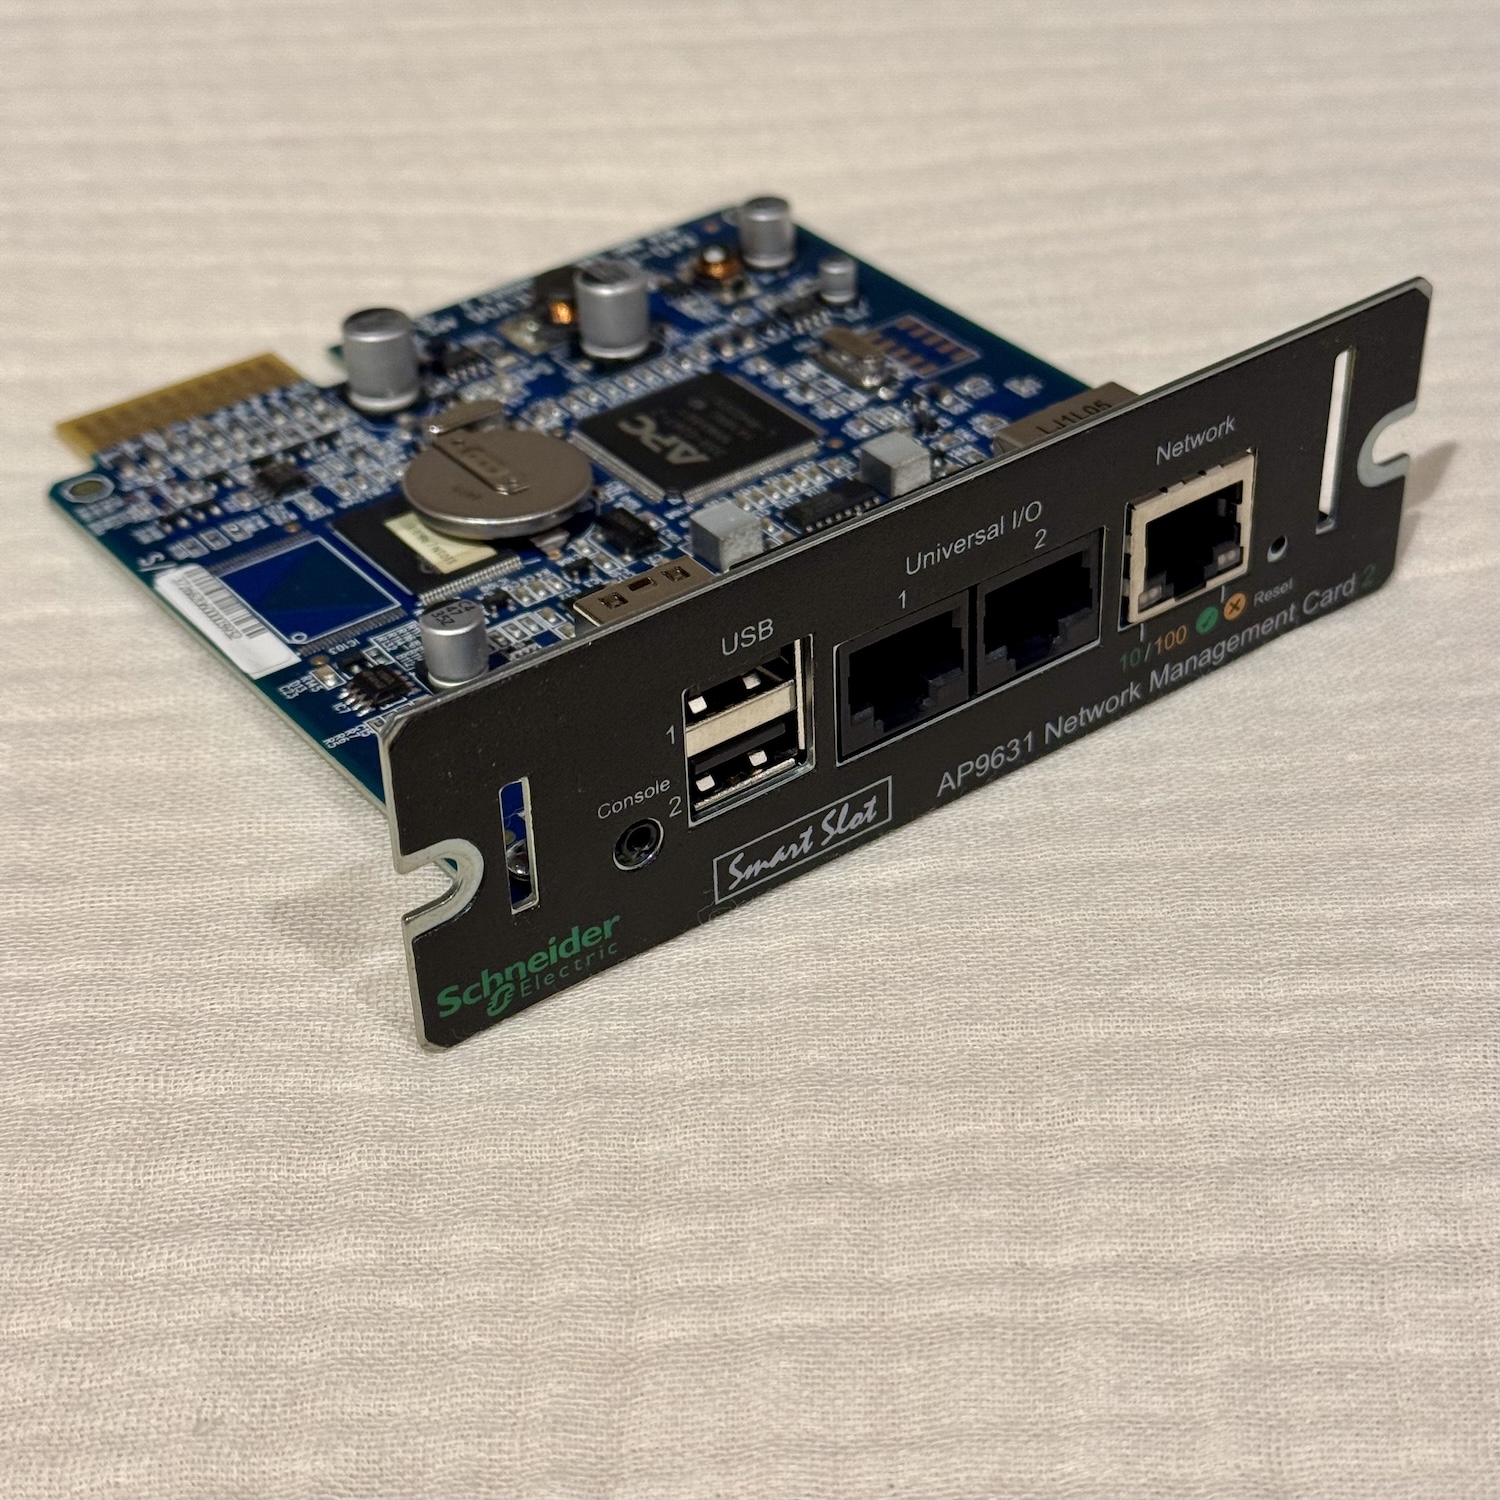
Wow, it’s almost new, cool purchase.
I installed it in the UPS

And then I connected it to the network, giving it the IP 192.168.1.242 (.240 and .241 are the two switches).
As soon as I logged into the interface, I noticed that it really has a lot more features than I expected, even a firewall. Nice!

I went on SNMP page and enabled the metrics on the IP of my Grafana/Prometheus server 192.168.1.6.
Then I went to the Grafana/Prometheus server and had to start the fundamental software stack to be able to read the correct OIDs.
On the Grafana/Prometheus server there was already running the snmp_exporter because I use it to monitor the Synology NAS (link to the NAS post).
So I added a scrape point on Prometheus for the UPS:
job_name: "apc_smt750i" metrics_path: /snmp params: module: [ups_apc] auth: [public_v1] static_configs: - targets: ["192.168.1.242"] labels: name: "APC SMT750I" relabel_configs: - source_labels: [__address__] target_label: __param_target - source_labels: [__param_target] target_label: instance - target_label: __address__ replacement: "192.168.1.6:9116"And then I had to implement all the correct OIDs for the exporter’s snmp.yml file to be able to read the data. So I spent some hours and in the end the APC module in the snmp.yml file is this:
modules: UPS_APC: walk: - 1.3.6.1.2.1.33.1.2 - 1.3.6.1.2.1.33.1.3 - 1.3.6.1.2.1.33.1.4 - 1.3.6.1.2.1.33.1.6 - 1.3.6.1.2.1.33.1.7 - 1.3.6.1.2.1.33.1.8 - 1.3.6.1.4.1.318.1.1.1 - 1.3.6.1.4.1.318.1.1.2 - 1.3.6.1.4.1.318.1.1.3 - 1.3.6.1.2.1.1 - 1.3.6.1.2.1.33.1.3.2.0 metrics: - name: UPS_powernet_output_frequency_hz oid: 1.3.6.1.4.1.318.1.1.1.4.3.2.0 type: gauge help: Output frequency in tenths of Hz from PowerNet MIB (divide by 10) - name: UPS_battery_test_capacity_mah oid: 1.3.6.1.4.1.318.1.1.1.2.2.5 type: gauge help: Battery capacity as determined by the last test (mAh) - name: UPS_input_line_bads oid: 1.3.6.1.2.1.33.1.3.2.0 type: counter help: Number of input line faults or dropouts detected - name: UPS_battery_status oid: 1.3.6.1.2.1.33.1.2.1.0 [...] cutFull OID module on Gist: snmp.yml for APC SMT-750I and snmp_exporter
With these OIDs, I can read these metrics:
# HELP snmp_scrape_duration_seconds Total SNMP time scrape took (walk and processing). # TYPE snmp_scrape_duration_seconds gauge snmp_scrape_duration_seconds{module="ups_apc"} 6.522366084 # HELP snmp_scrape_packets_retried Packets retried for get, bulkget, and walk. # TYPE snmp_scrape_packets_retried gauge snmp_scrape_packets_retried{module="ups_apc"} 0 # HELP snmp_scrape_packets_sent Packets sent for get, bulkget, and walk; including retries. # TYPE snmp_scrape_packets_sent gauge snmp_scrape_packets_sent{module="ups_apc"} 271 # HELP snmp_scrape_pdus_returned PDUs returned from get, bulkget, and walk. # TYPE snmp_scrape_pdus_returned gauge snmp_scrape_pdus_returned{module="ups_apc"} 259 # HELP snmp_scrape_walk_duration_seconds Time SNMP walk/bulkwalk took. # TYPE snmp_scrape_walk_duration_seconds gauge snmp_scrape_walk_duration_seconds{module="ups_apc"} 6.521636888 # HELP sys_uptime_seconds System uptime in seconds # TYPE sys_uptime_seconds gauge sys_uptime_seconds 159155.5 # HELP ups_apc_total_runtime APC UPS total runtime in seconds # TYPE ups_apc_total_runtime counter ups_apc_total_runtime 0 # HELP ups_apc_transfer_count Number of transfers to battery power # TYPE ups_apc_transfer_count counter ups_apc_transfer_count 1 # HELP ups_battery_charge_remaining Battery charge remaining (percent) # TYPE ups_battery_charge_remaining gauge ups_battery_charge_remaining 100 # HELP ups_battery_model UPS battery model (e.g., RBC48) # TYPE ups_battery_model gauge ups_battery_model{ups_battery_model="RBC48"} 1 # HELP ups_battery_needs_replacement Indicates if battery needs replacement (1=yes, 2=no) # TYPE ups_battery_needs_replacement gauge ups_battery_needs_replacement 2 # HELP ups_battery_replacement_date Date the UPS battery was last replaced # TYPE ups_battery_replacement_date gauge ups_battery_replacement_date{ups_battery_replacement_date="06/07/2025"} 1 # HELP ups_battery_status Battery status of the UPS (1=unknown, 2=batteryNormal, 3=batteryLow, 4=batteryDepleted) # TYPE ups_battery_status gauge ups_battery_status 2 [...] cutFull metrics on Gist: Prometheus APC SMT-750I scrape via snmp_exporter
That allow me to built this useful Grafana dashboard:

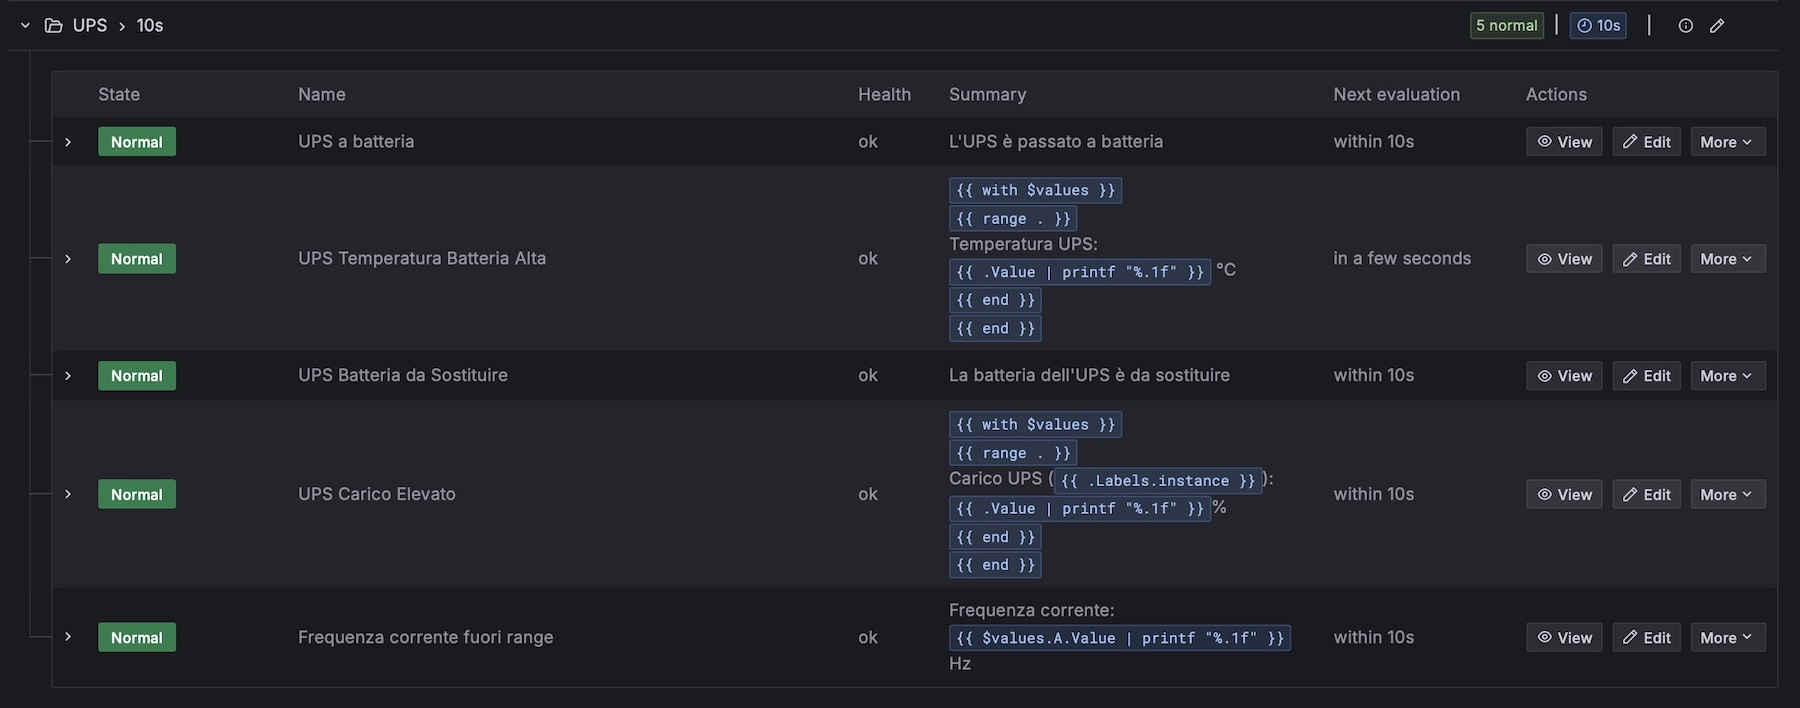
Using these queries I also added many useful alerts in Grafana for power outages, excessive load, high temperature, and more. Example:
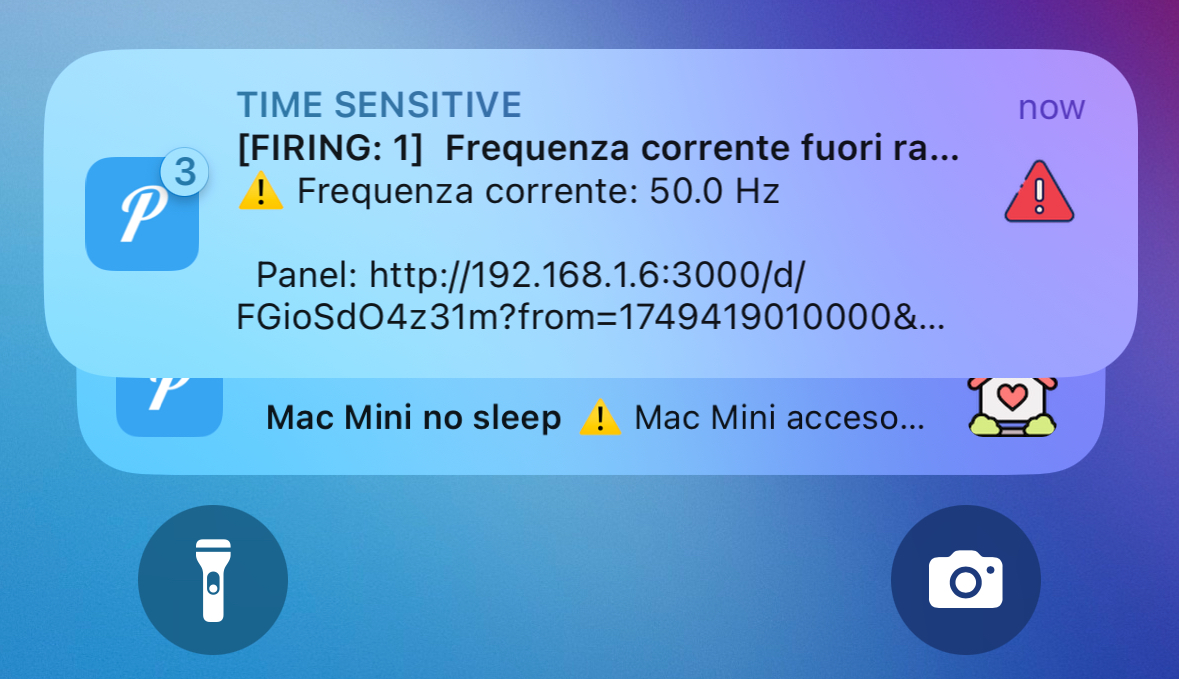
I’m still working on the alerts, aiming to identify the most useful ones while avoiding unnecessary flood of push notifications:
Conclusions
It’s curious how something as simple as changing a UPS turned into a rabbit hole of USB updates, serial cables, network management cards, etc… that consumed over a month of my time! But it’s nice this way: I learned and discovered new things.
PS: My “summary” is getting too long… new updates coming soon =)