.png)

And they fell in 21 of our 33 metros: Tampa, Austin, Miami, San Diego, Los Angeles, San Jose, San Francisco, San Antonio, Dallas, Phoenix, Orlando, Atlanta, Denver, Raleigh, Houston, Seattle… Others up YoY: Boston, Chicago, New York, Philadelphia… A few hit new highs.
By Wolf Richter for WOLF STREET.
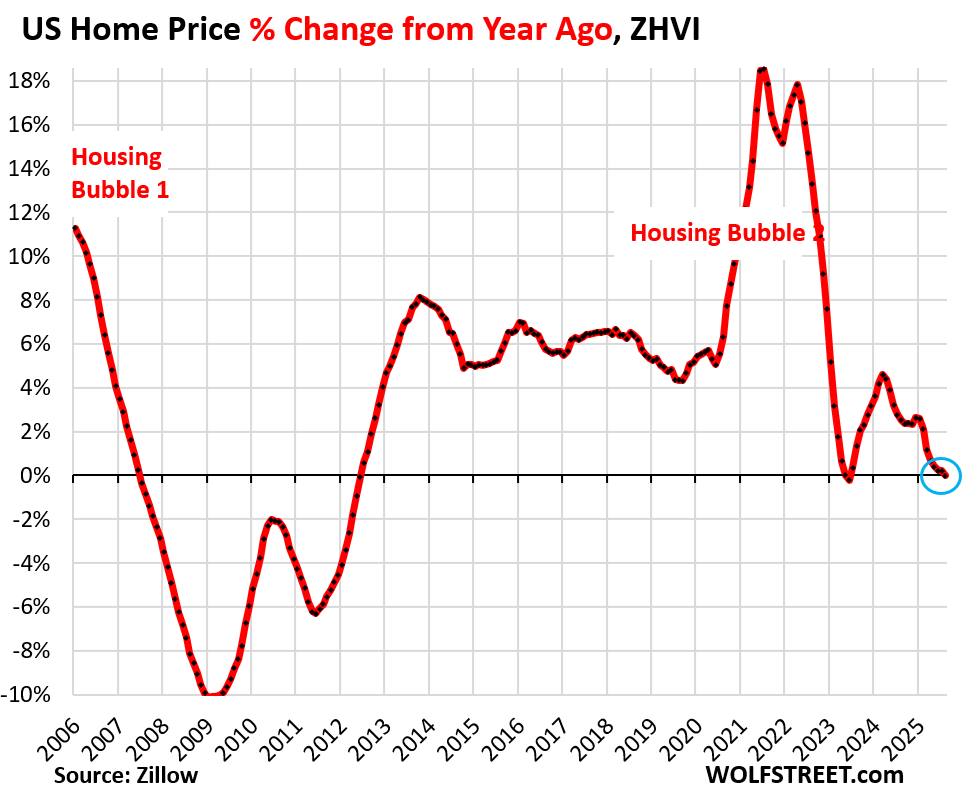
At the national level, prices of mid-tier single-family homes, condos, and co-ops declined year-over-year in August, the first decline since June 2023, and both were the first declines since the Housing Bust.
But prices moved in different directions among the 33 large and expensive metropolitan statistical areas (MSAs) that we track here: 21 had year-over-year (YoY) declines in July, up from 6 at the end of 2024. And in 23 of our 33 metros, prices were down from their peaks in prior years. But in a few others, prices inched up to new records.
The 21 metros of our 33 metros with year-over-year price declines:
The five metros with the biggest year-over-year declines among our 33 metros were in Florida and Texas.
Year-over-year declines in August:
- Tampa: -6.1%
- Austin: -5.8%
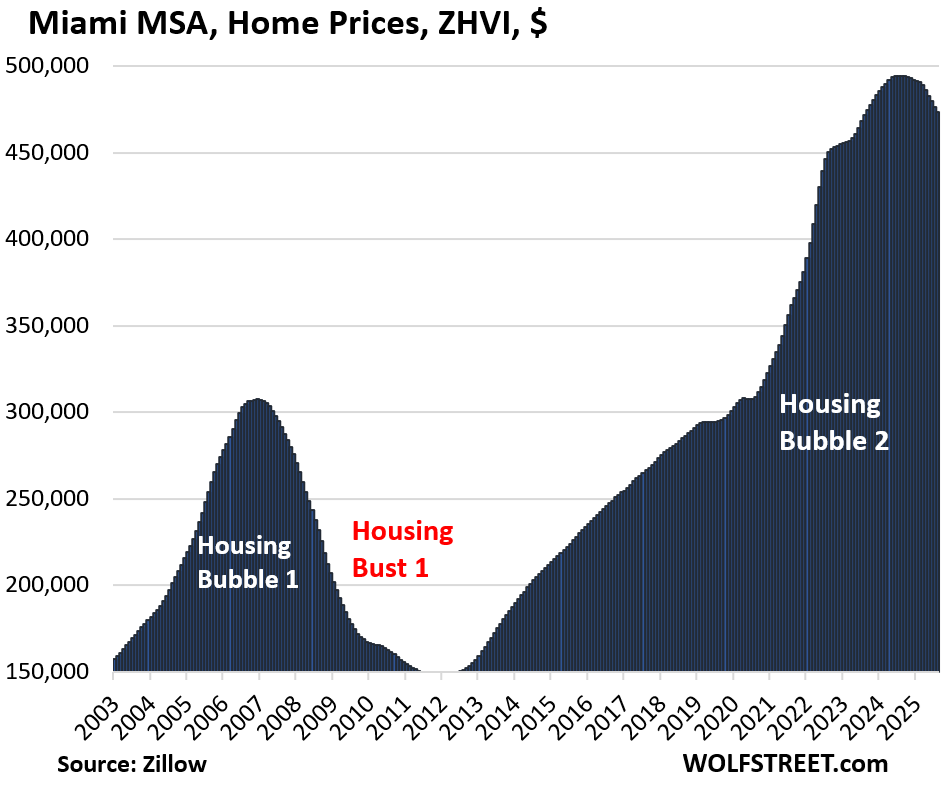
- Miami: -4.3%
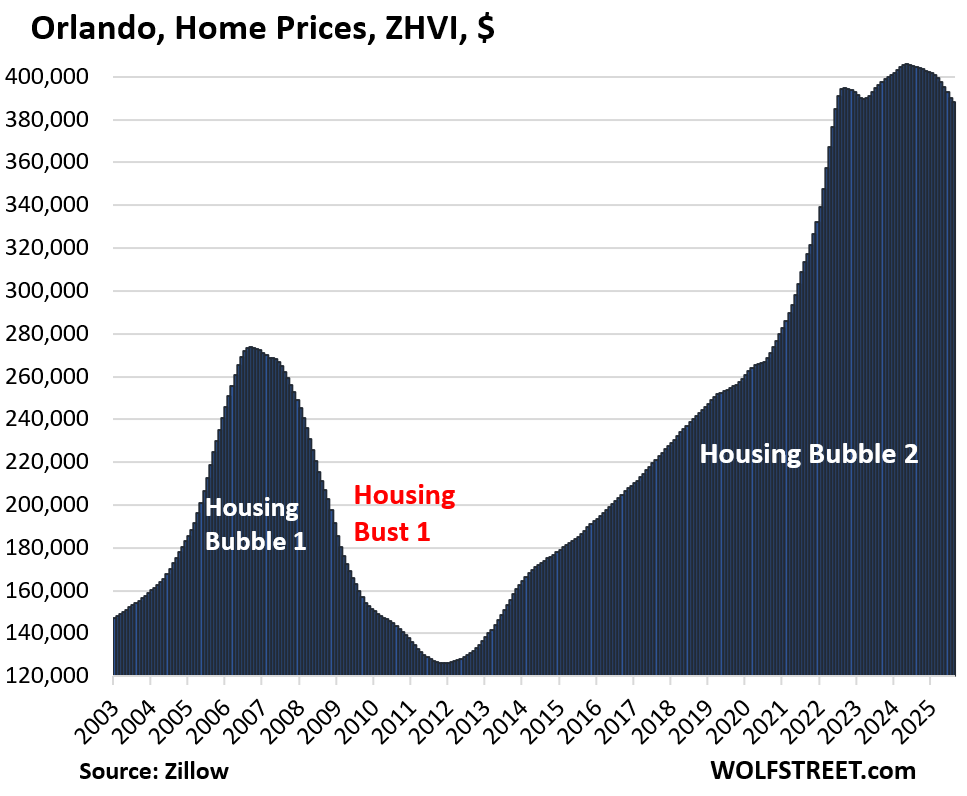
- Orlando: -4.1%
- Dallas: -3.8%
- San Francisco: -3.8%
- Phoenix: -3.6%
- San Antonio: -3.2%
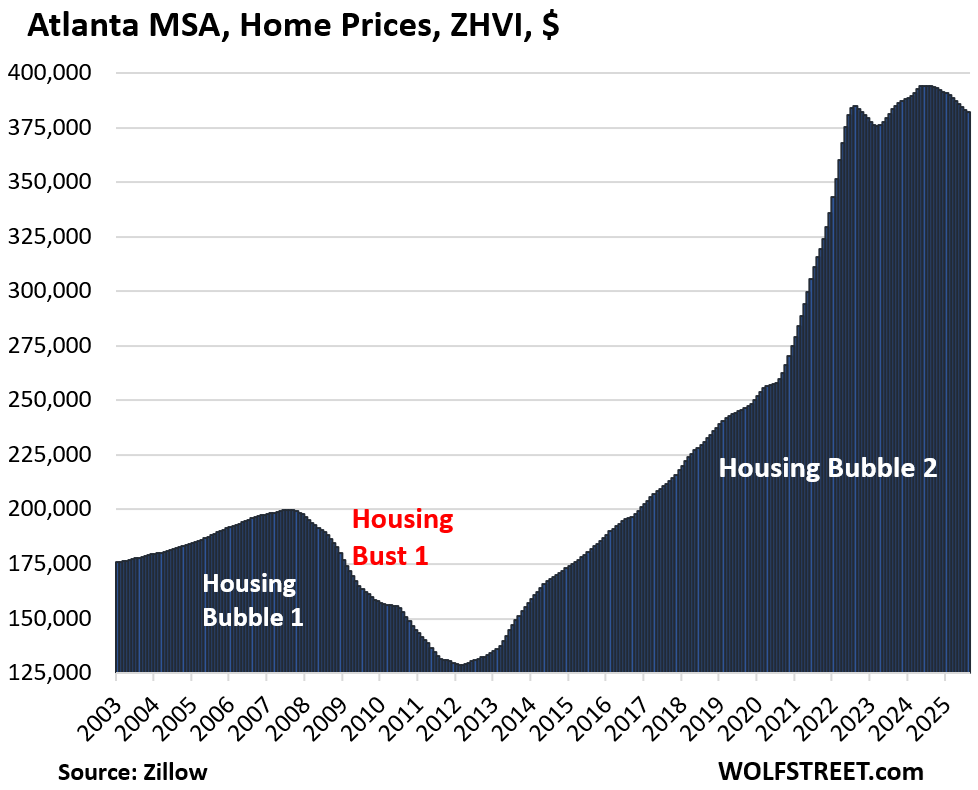
- Atlanta: -3.0%
- Denver: -2.8%
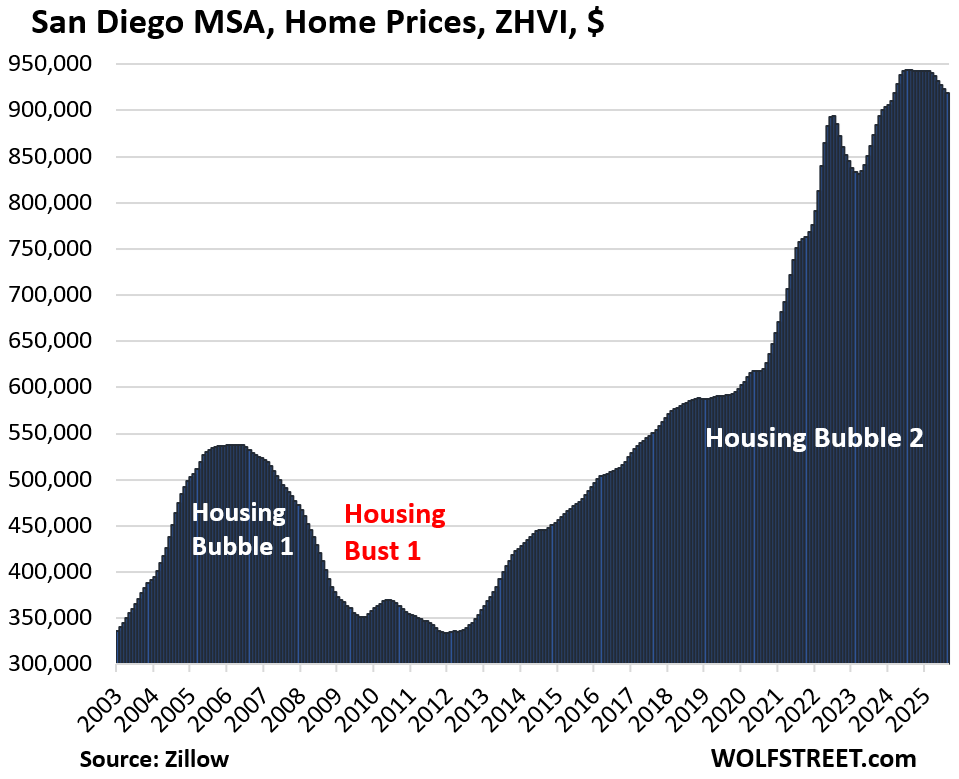
- San Diego: -2.5%
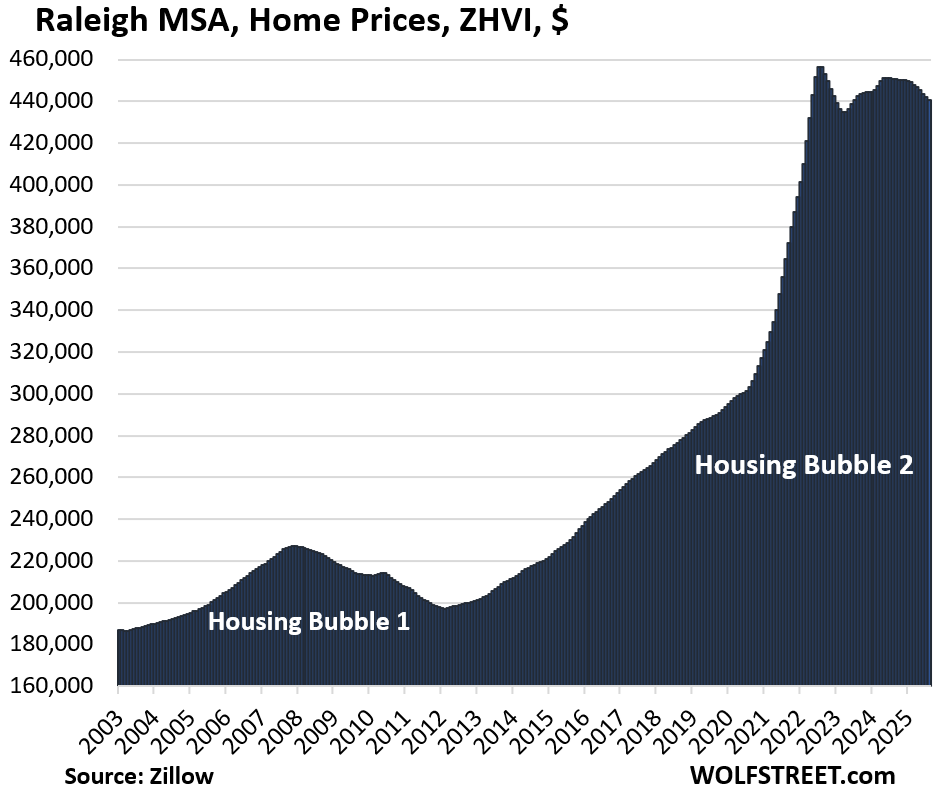
- Raleigh: -2.2%
- Sacramento: -2.0%
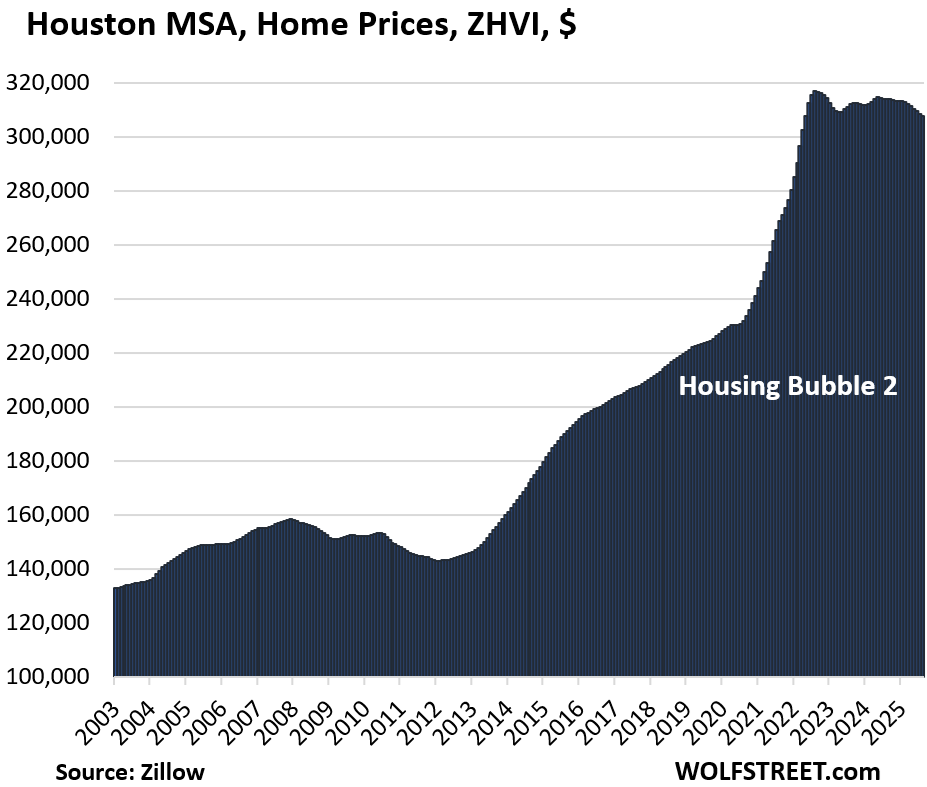
- Houston: -1.9%
- San Jose: -1.7%
- Honolulu: -1.7%
- Charlotte: -0.9%
- Portland: -0.7%
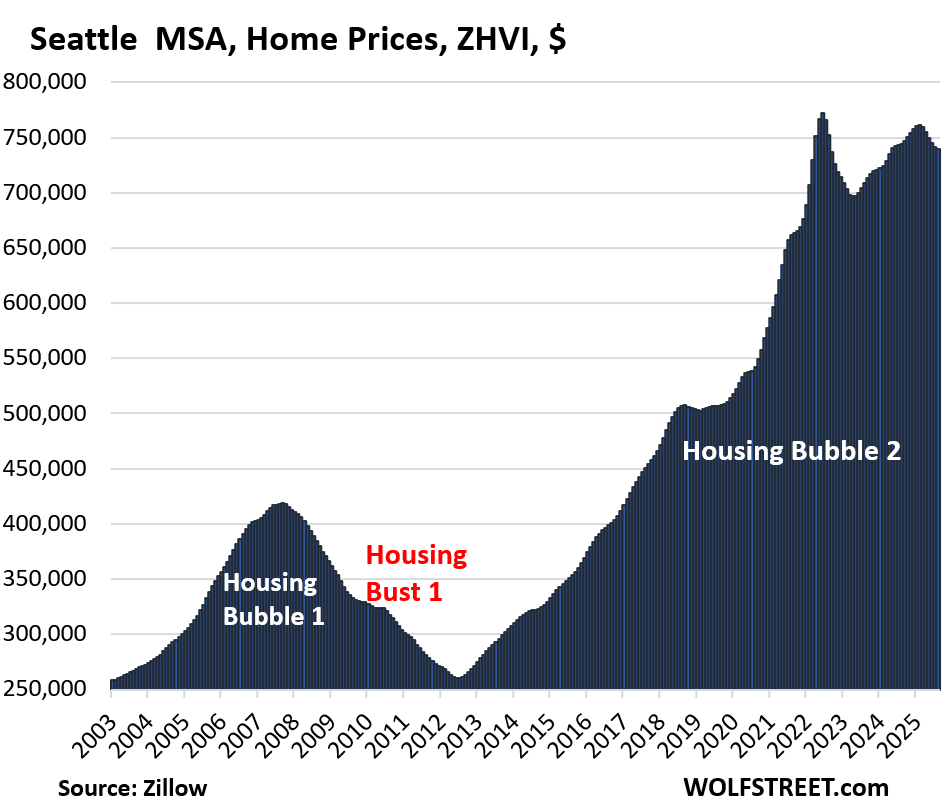
- Seattle: -0.6%
- Los Angeles: -0.4%
- Nashville: -0.1%
The 23 metros of our 33 whose prices are down from their highs in 2022 and 2024.
The peaks of 17 metros were in 2022; the peaks of the remaining 6 were in 2024 (Miami, San Diego, Atlanta, Charlotte, San Jose, Los Angeles).
Percentage declines from their respective highs in prior years:
- Austin: -23.2%
- San Francisco: -10.7%
- Phoenix: -10.5%
- San Antonio: -8.4%
- Denver: -7.2%
- Sacramento: -7.1%
- Tampa: -6.7%
- Dallas: -6.5%
- Honolulu: -5.2%
- Portland: -4.8%
- San Jose: -4.8%
- Orlando: -4.4%
- Miami: -4.3%
- Seattle: -4.1%
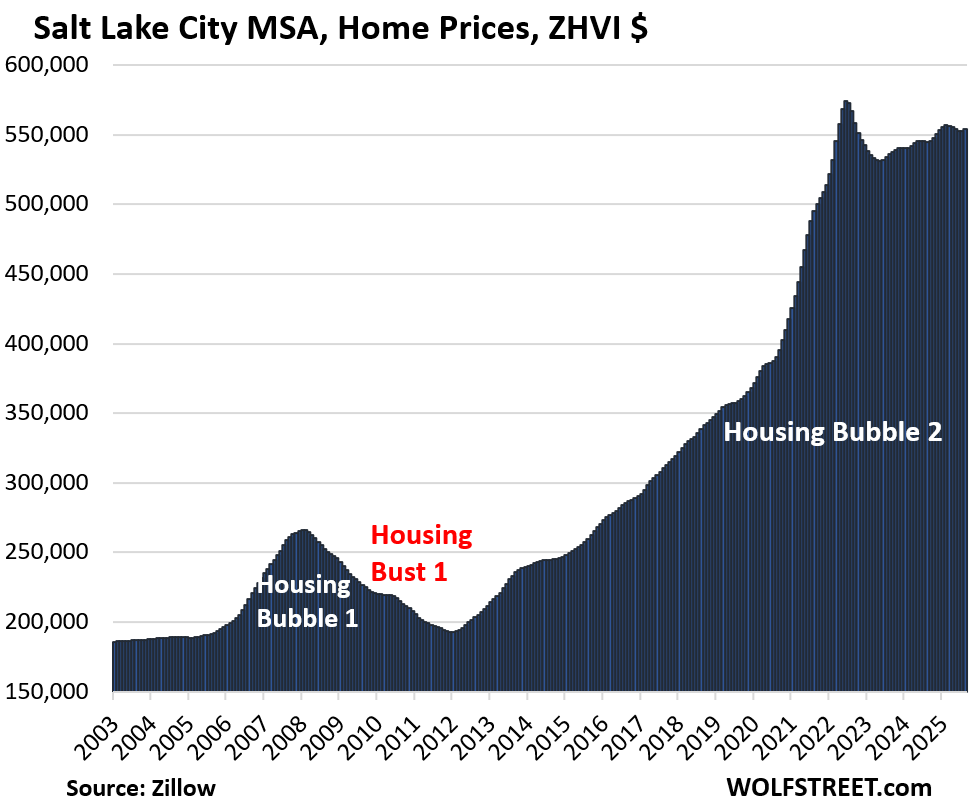
- Salt Lake City: -3.7%
- Raleigh: -3.5%
- Atlanta: -3.1%
- Houston: -2.8%
- San Diego: -2.6%
- Las Vegas: -2.5%
- Los Angeles: -2.5%
- Nashville: -1.7%
- Charlotte: -1.0%
Prices skidded in many markets because supply of existing homes has surged and demand has plunged. And homebuilders have been aggressively building inventory, and that inventory of new homes for sale reached the highest level since 2008, and in the South the highest level ever.
Methodology: All pricing data here for the 33 metropolitan statistical areas (MSA) is from the seasonally adjusted three-month-average mid-tier Zillow Home Value Index (ZHVI), released today. The ZHVI is based on millions of data points in Zillow’s “Database of All Homes,” including from public records (tax data), MLS, brokerages, local Realtor Associations, real-estate agents, and households across the US. It includes pricing data for off-market deals and for-sale-by-owner deals. Zillow’s Database of All Homes also has sales-pairs data.
All data here about active listings is from Realtor.com.
To qualify for this list of 33 most splendid housing bubbles, the MSA must be one of the largest by population and must have had a ZHVI of at least $300,000 at some point. Some metros that are large enough don’t qualify for this list because their ZHVI has never reached $300,000, despite the blistering surge of home prices in recent years, such as the metros of New Orleans, Memphis, Oklahoma City, Tulsa, Cincinnati, and Pittsburgh.
The 33 Most Splendid Housing Bubbles.
In the little tables, MoM = month over month; YoY = year-over-year. In the column furthest to the right: the percentage increase “since 2000.”
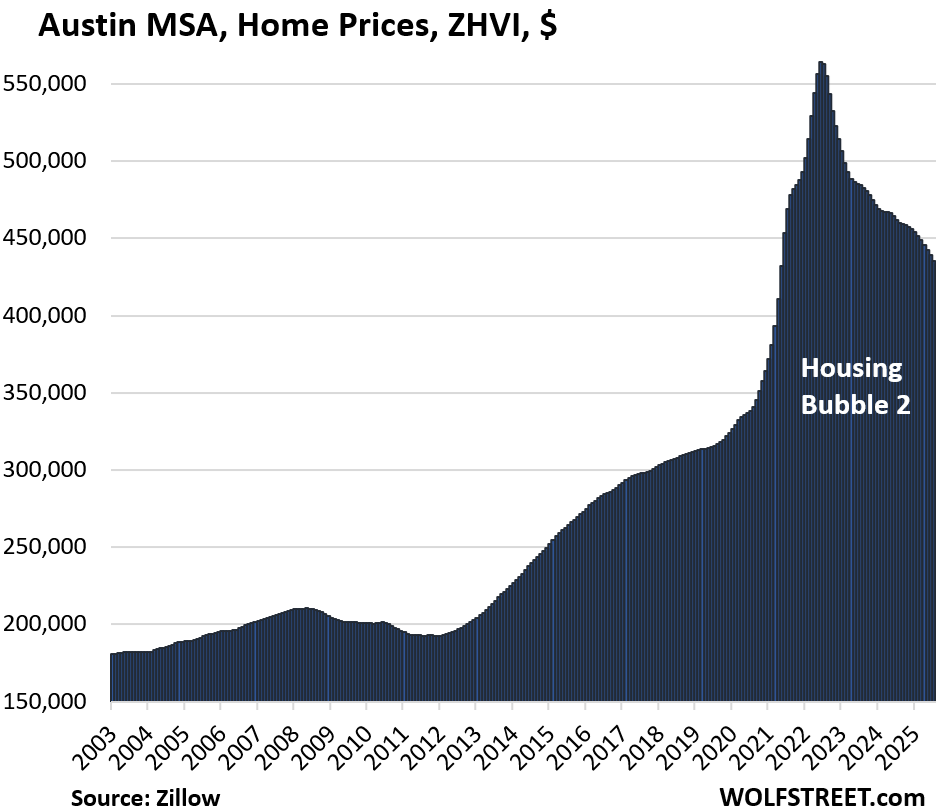
| Austin MSA, Home Prices | |||
| From Jun 2022 peak | MoM | YoY | Since 2000 |
| -23.2% | -0.5% | -5.8% | 149% |
The lowest since May 2021.
From January 2020 through June 2022, prices in the Austin-Round Rock-San Marcos metro exploded by 73%. This price explosion documents the absurdity that the housing markets had become under the Fed’s reckless free-money monetary policy until 2022 – and when money is free, prices don’t matter.
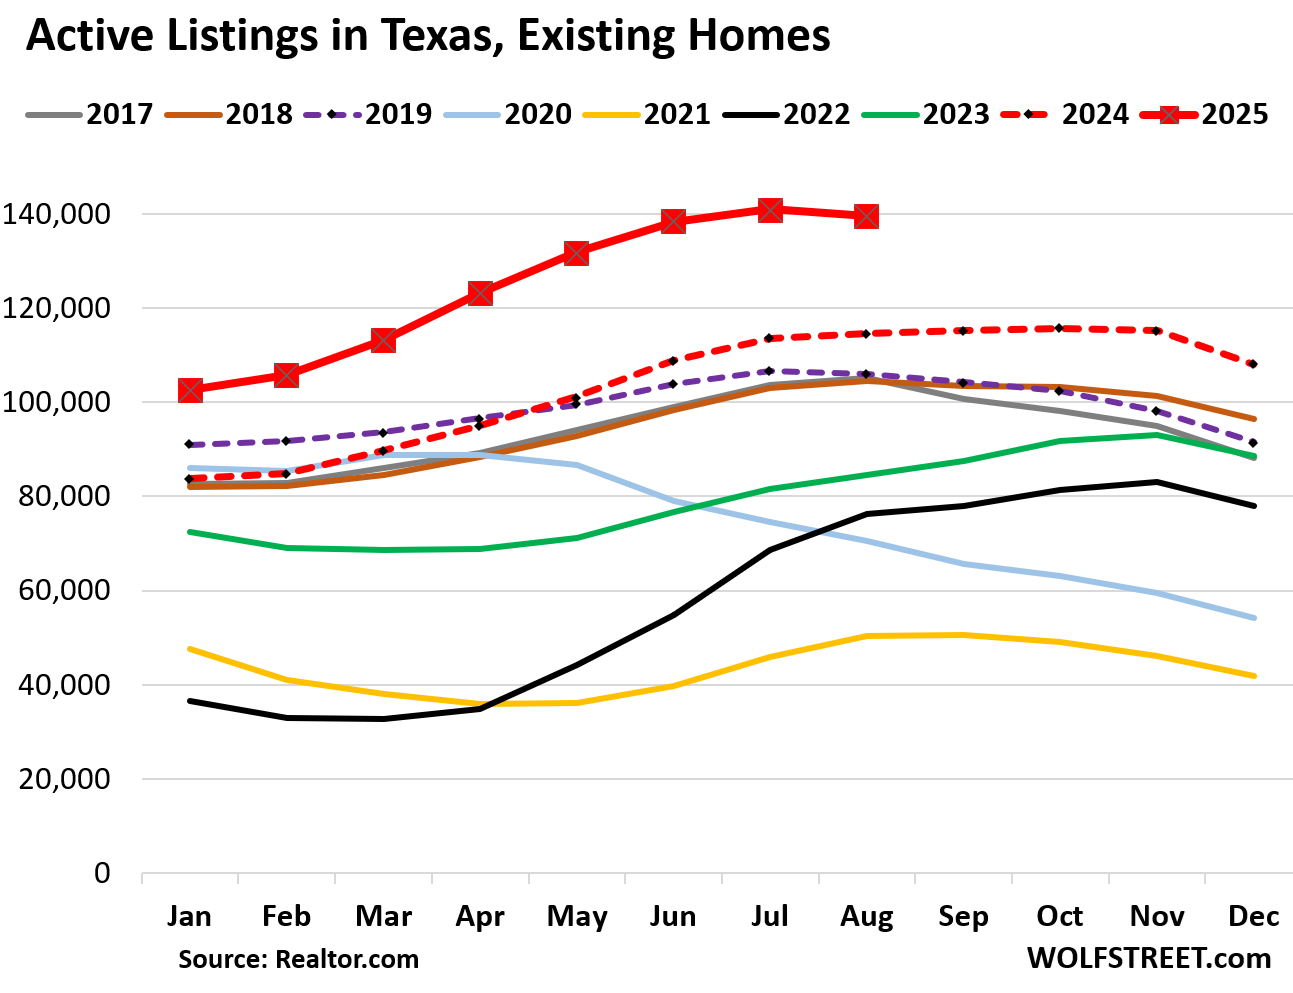
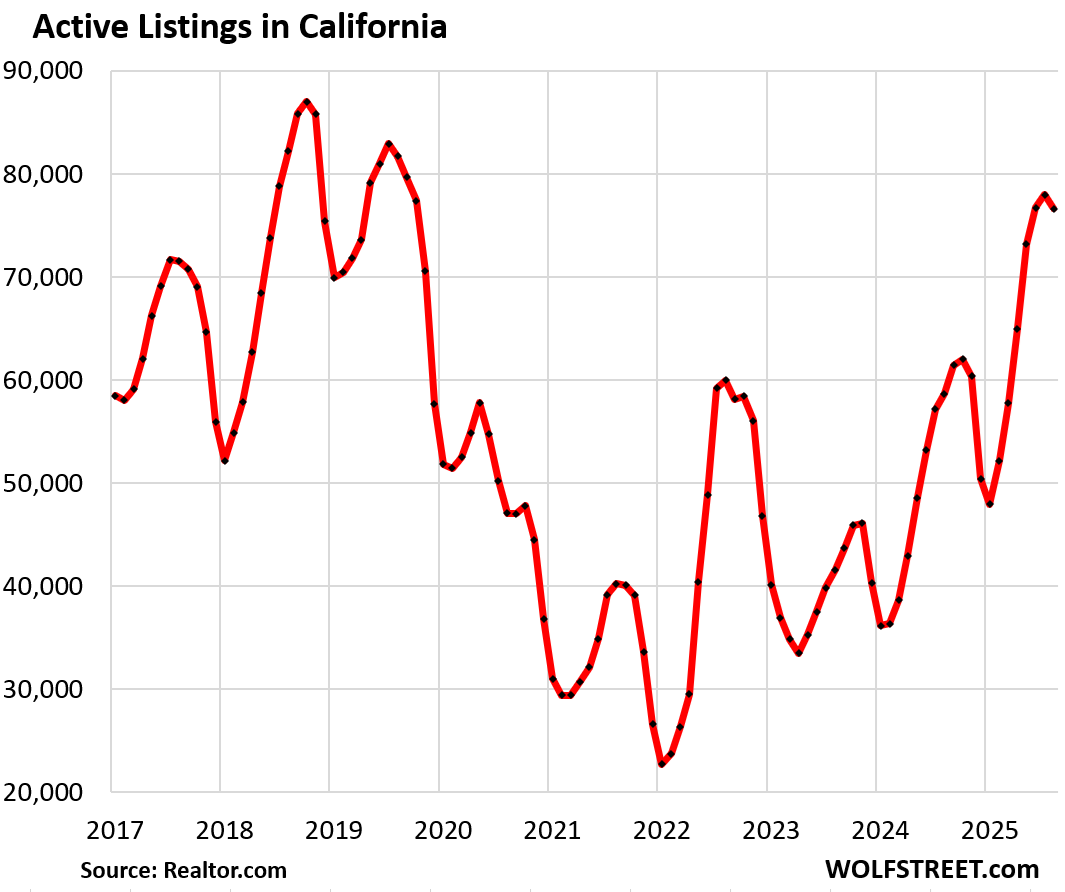
Here is what active listings in Texas look like:
| San Francisco MSA, Home Prices | |||
| From May 2022 peak | MoM | YoY | Since 2000 |
| -10.7% | -0.6% | -3.8% | 283% |
The San Francisco-Oakland-Fremont metro includes San Francisco, much of the East Bay (such as Oakland), much of the North Bay, and goes south on the Peninsula into Silicon Valley through San Mateo County. It does not include the San Jose metro, which covers the southern portion of the Bay Area (see below).
From January 2020 through June 2022, prices exploded by 33%.
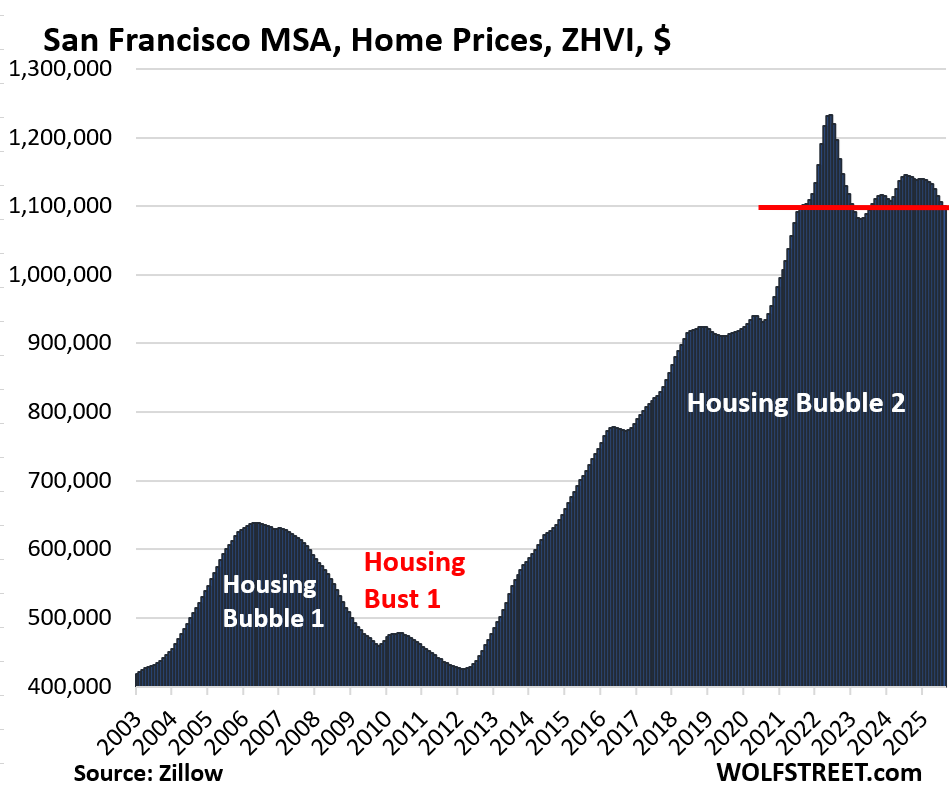
Inventory across California has been surging. And homes now spend more time on the market before they’re delisted or sold for this time of the year than in well over a decade.
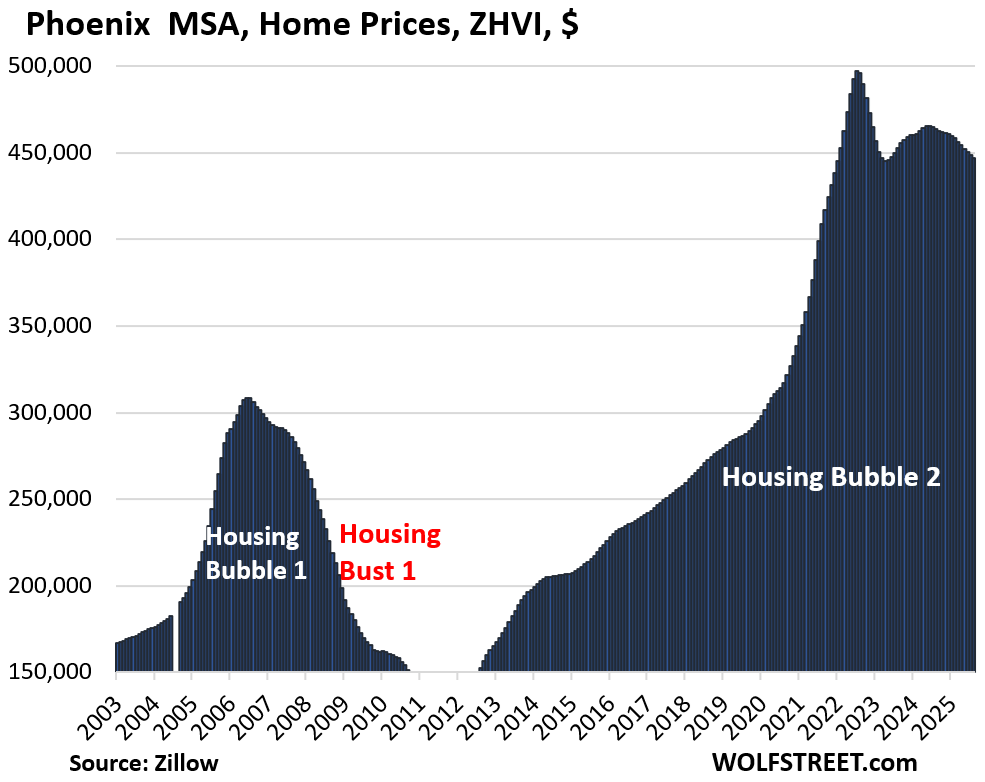
| Phoenix MSA, Home Prices | |||
| From Jun 2022 peak | MoM | YoY | Since 2000 |
| -10.1% | -0.4% | -3.6% | 212% |
Prices exploded by 65% from January 2020 through June 2022.
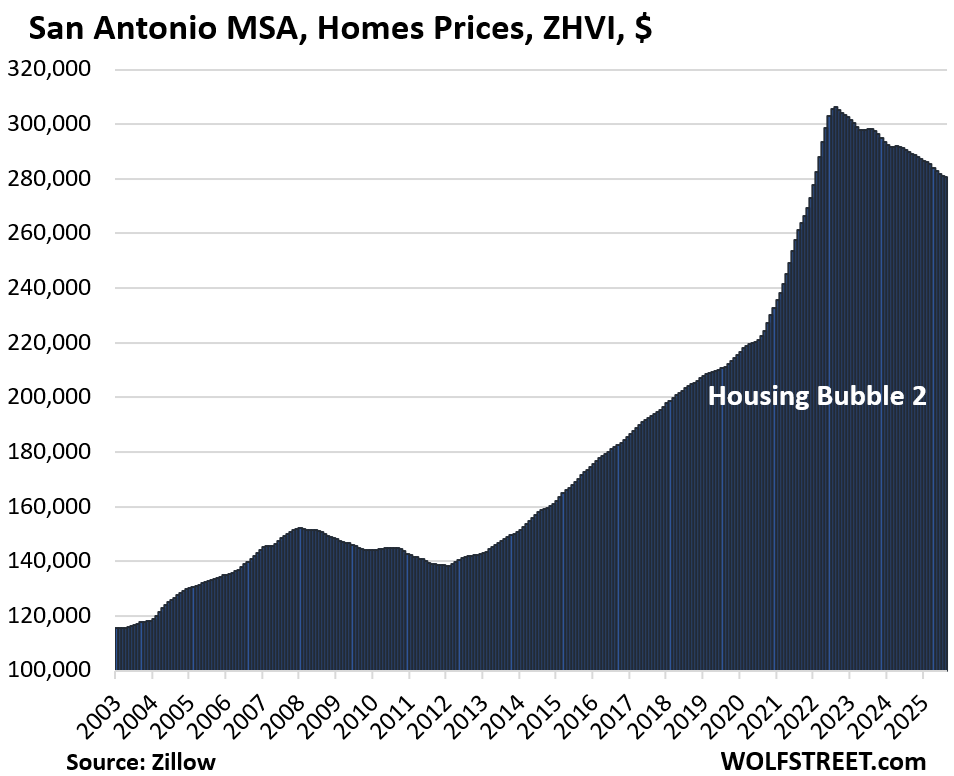
| San Antonio MSA, Home Prices | |||
| From Jul 2022 peak | MoM | YoY | Since 2000 |
| -8.4% | -0.2% | -3.2% | 144% |
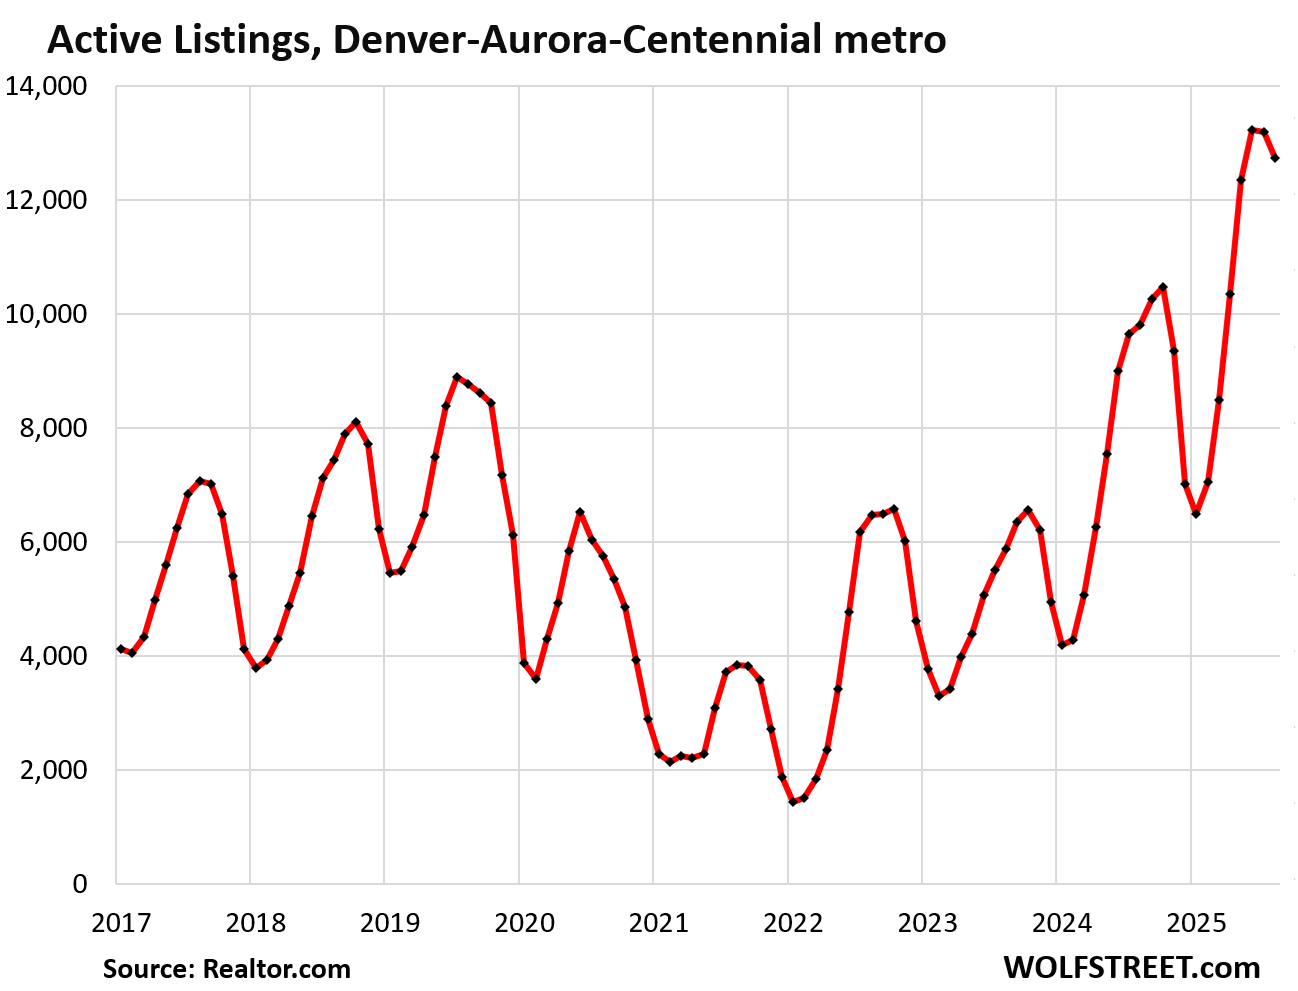
| Denver MSA, Home Prices | |||
| From Jun 2022 peak | MoM | YoY | Since 2000 |
| -7.2% | -0.2% | -2.8% | 203% |
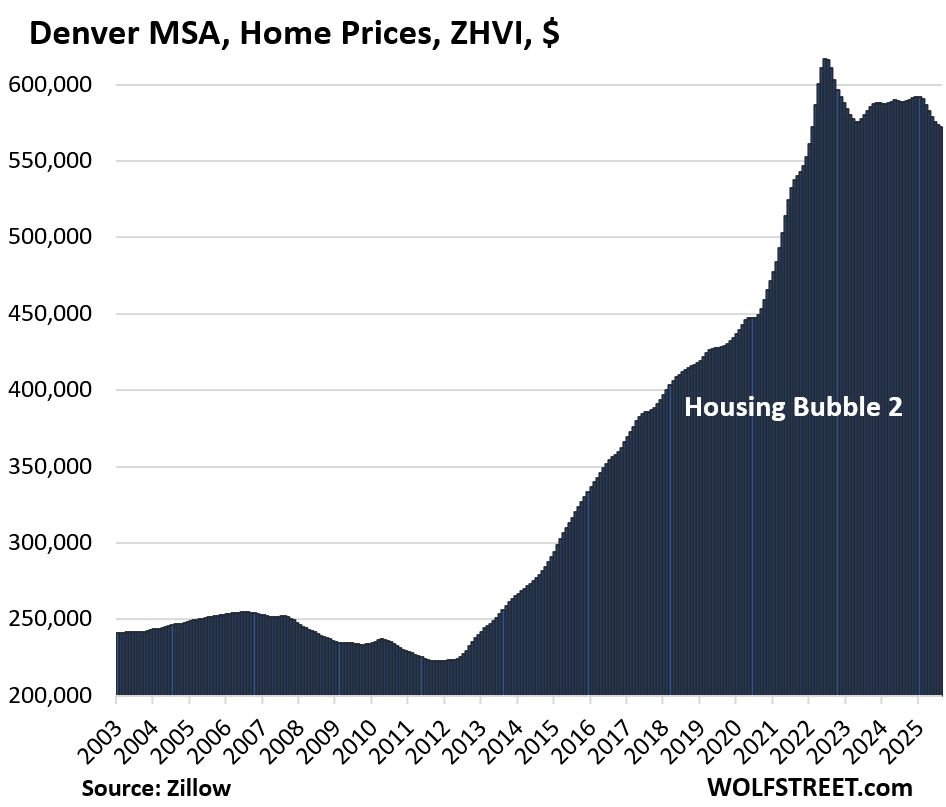
And inventory in the Denver MSA:
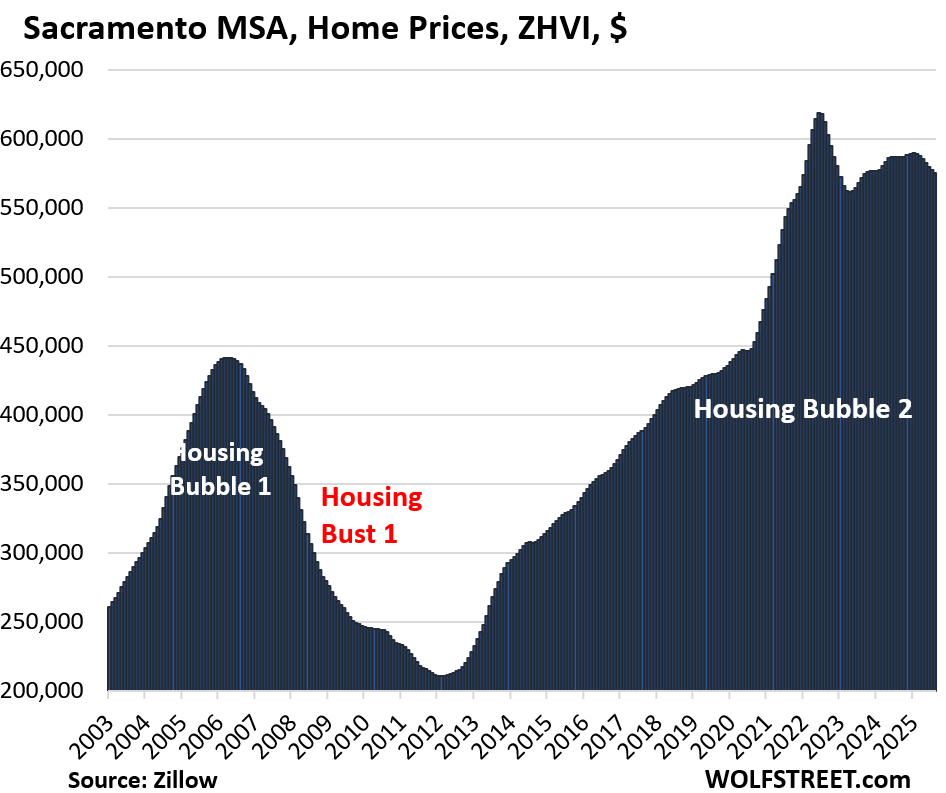
| Sacramento MSA, Home Prices | |||
| From July 2022 peak | MoM | YoY | Since 2000 |
| -7.1% | -0.4% | -2.0% | 239.9% |
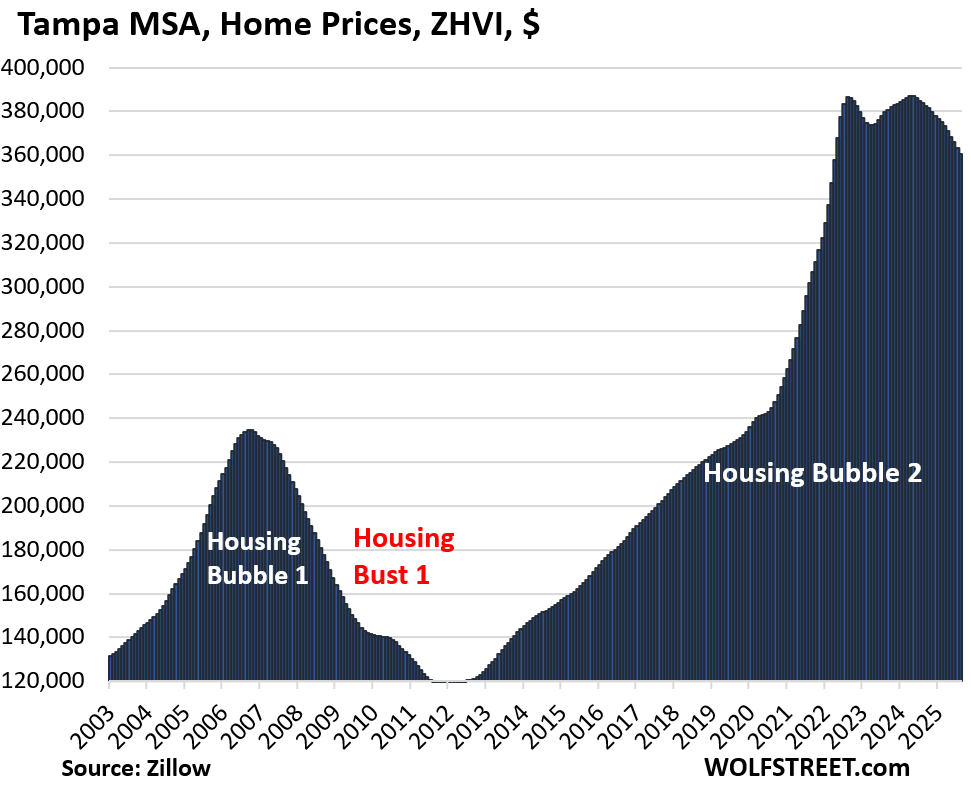
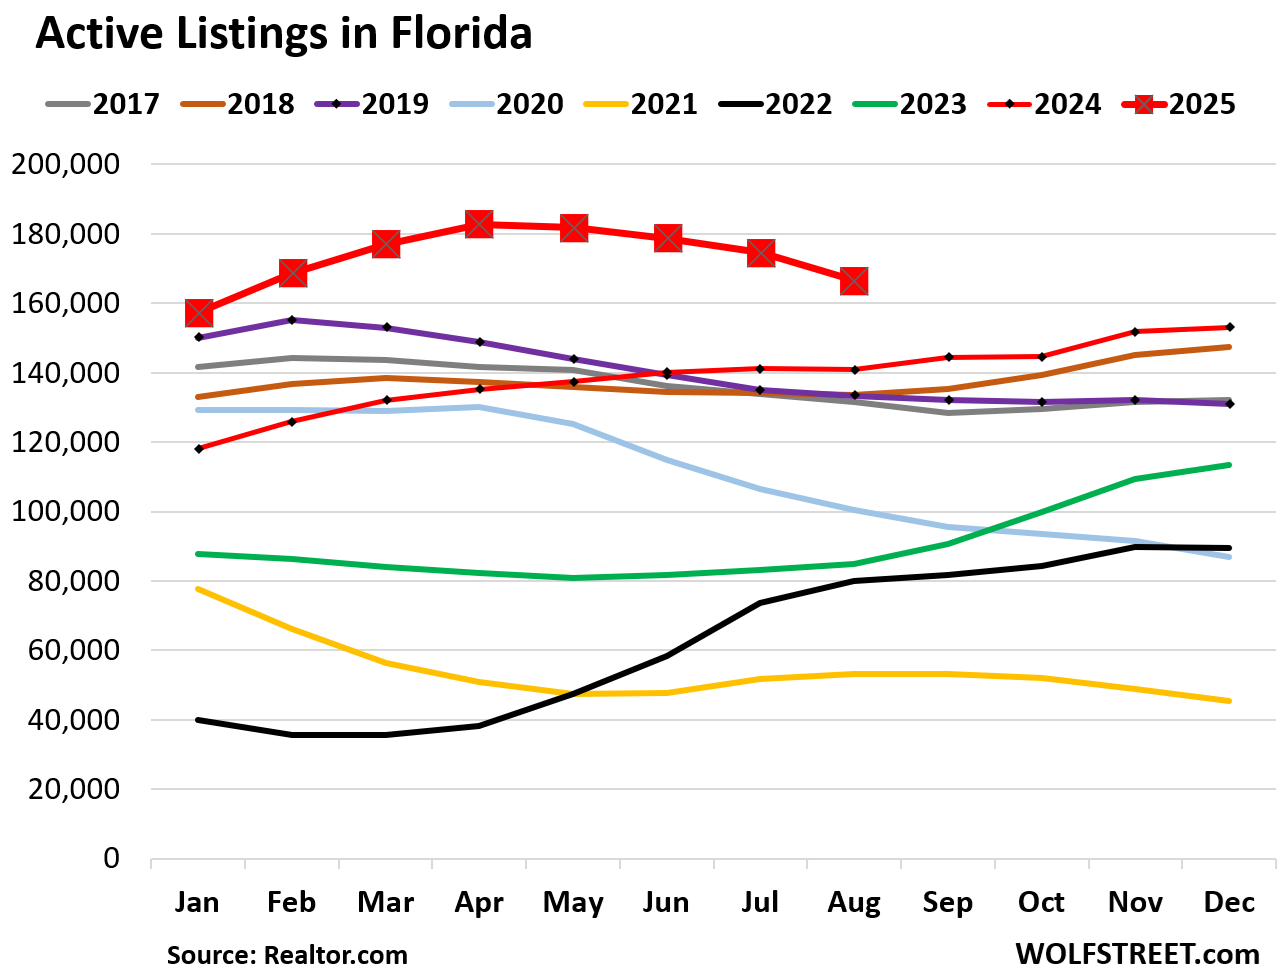
| Tampa MSA, Home Prices | |||
| From Jul 2022 peak | MoM | YoY | Since 2000 |
| -6.7% | -0.7% | -6.1% | 256% |
Prices exploded by 60% between January 2020 and June 2022.
Active listings in Florida have been all year at the highest levels in well over 10 years:
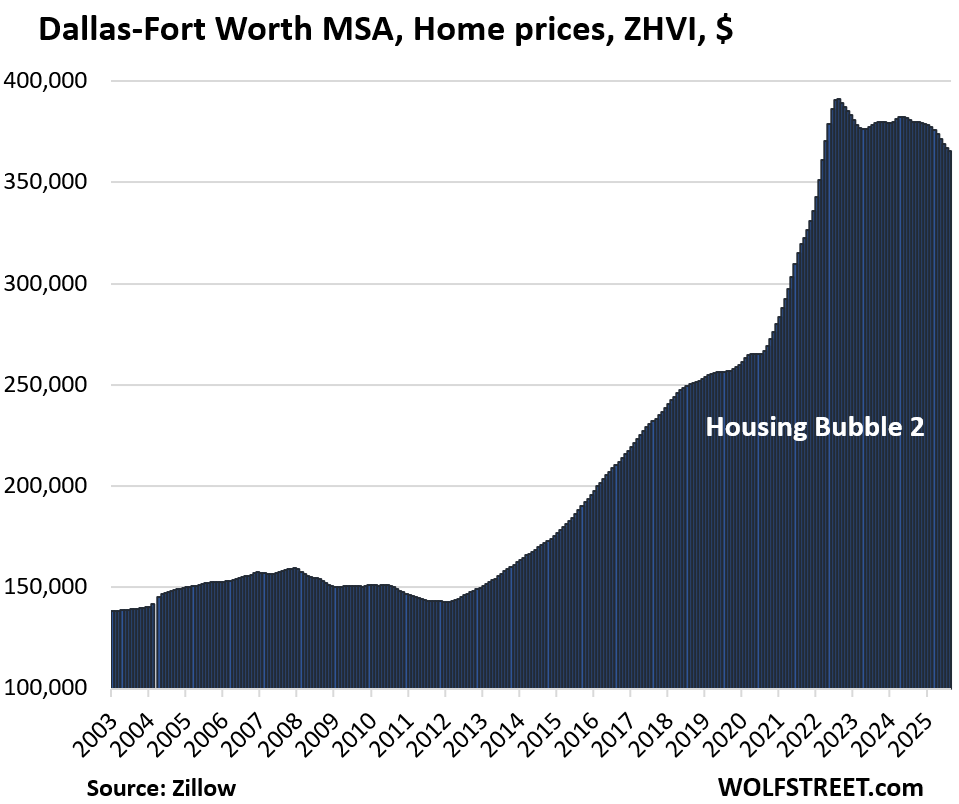
| Dallas-Fort Worth MSA, Home Prices | |||
| From Jun 2022 peak | MoM | YoY | Since 2000 |
| -6.5% | -0.4% | -3.8% | 184% |
Prices exploded by 48% between January 2020 and June 2022.
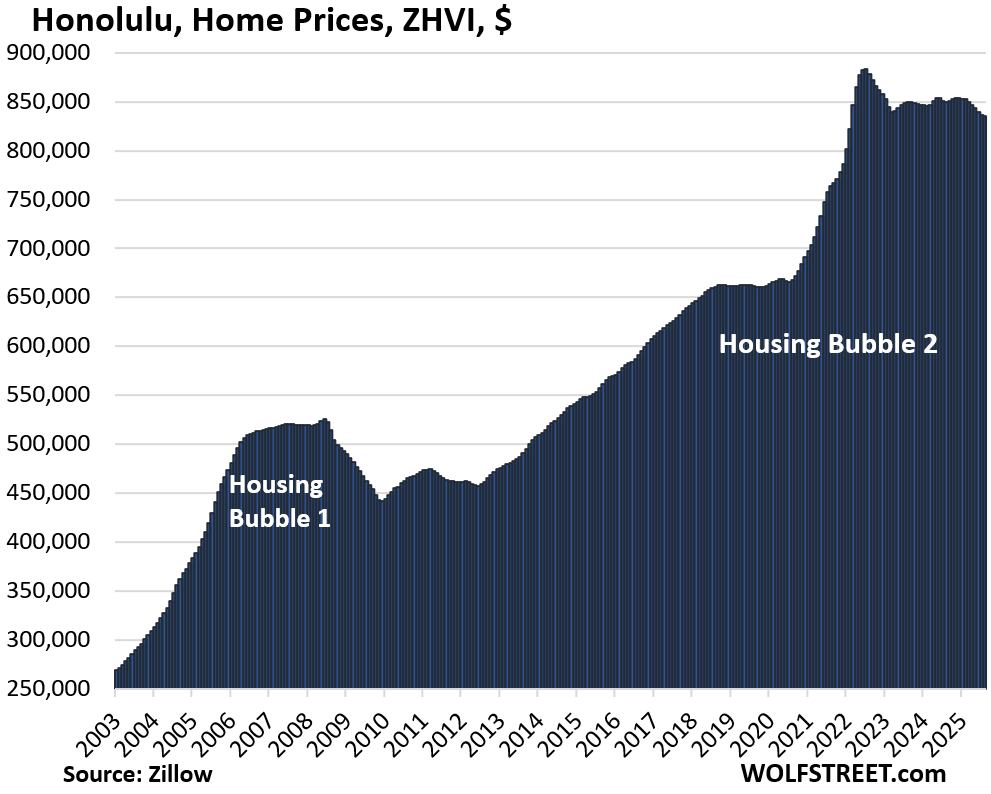
| Honolulu, Home Prices | |||
| From Jun 2022 peak | MoM | YoY | Since 2000 |
| -5.4% | -0.2% | -1.7% | 275% |
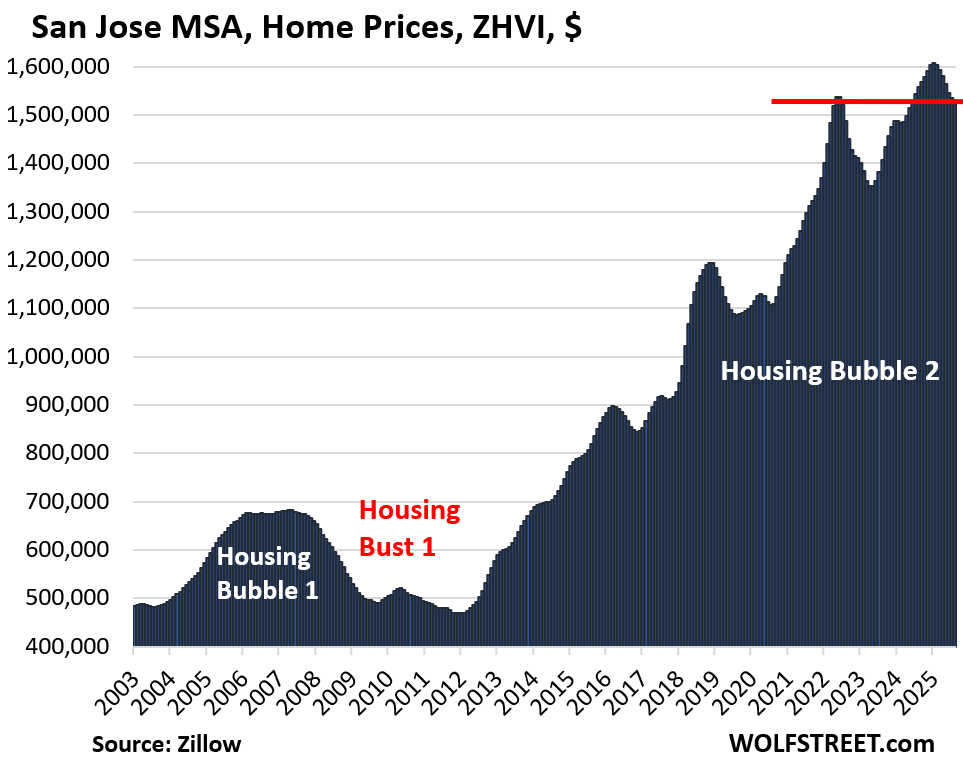
| San Jose MSA, Home Prices | |||
| Fr Dec 2024 high | MoM | YoY | Since 2000 |
| -4.8% | -0.2% | -1.7% | 326% |
Back to March 2022.
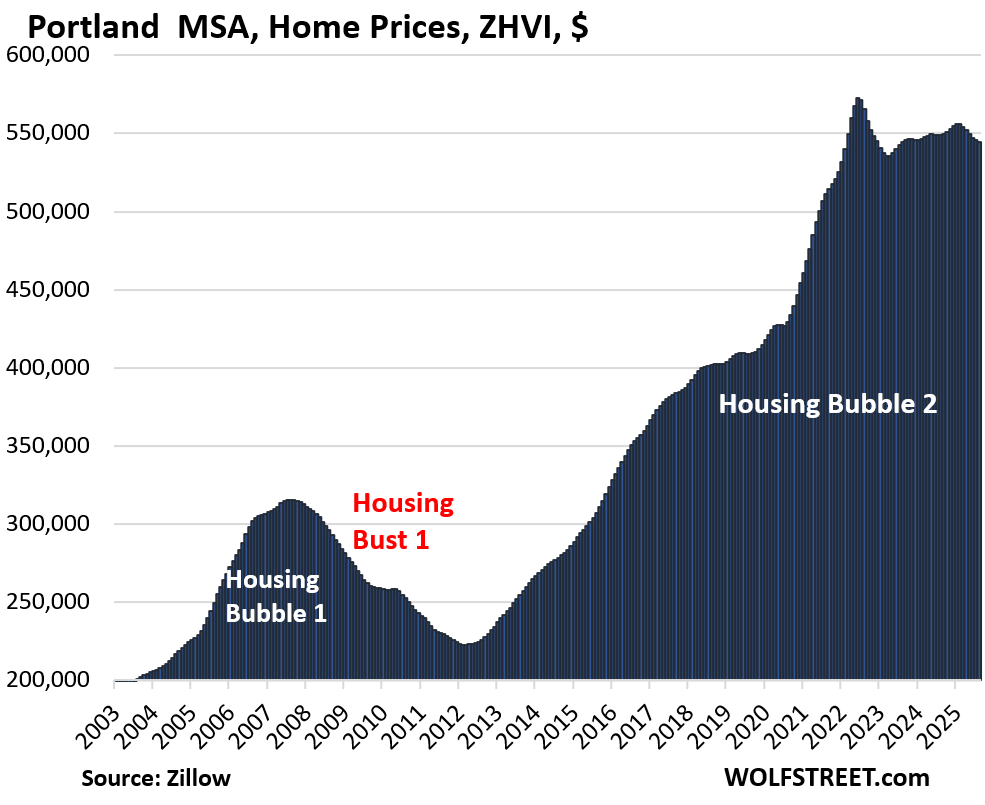
| Portland MSA, Home Prices | |||
| From May 2022 peak | MoM | YoY | Since 2000 |
| -4.8% | -0.2% | -0.7% | 212% |
| Orlando MSA, Home Prices | |||
| From June 2022 | MoM | YoY | Since 2000 |
| -4.4% | -0.6% | -4.1% | 226% |
Prices exploded by 48% between January 2020 and June 2022.
| Miami MSA, Home Prices | |||
| Fr Sep 2024 peak | MoM | YoY | Since 2000 |
| -4.3% | -0.6% | -4.3% | 315% |
| Seattle MSA, Home Prices | |||
| From May 2022 peak | MoM | YoY | Since 2000 |
| -4.1% | -0.2% | -0.6% | 232% |
In the 2.5 years through June 2022, home prices had exploded by 49%.
| Raleigh MSA, Home Prices | |||
| From July 2022 peak | MoM | YoY | Since 2000 |
| -3.5% | -0.3% | -2.2% | 153% |
| Salt Lake City MSA, Home Prices | |||
| From July 2022 peak | MoM | YoY | Since 2000 |
| -3.5% | 0.2% | 1.6% | 215% |
Prices exploded by 54% from January 2020 through June 2022.
| Atlanta MSA, Home Prices | |||
| From July 2022 | MoM | YoY | Since 2000 |
| -3.1% | -0.2% | -3.0% | 156% |
Prices exploded 51% between January 2020 and June 2022.
| Houston MSA, Home Prices | |||
| From Jul 2022 peak | MoM | YoY | Since 2000 |
| -2.8% | -0.2% | -1.9% | 147% |
| San Diego MSA, Home Prices | |||
| Fr Jul 2024 peak | MoM | YoY | Since 2000 |
| -2.6% | -0.4% | -2.5% | 328% |
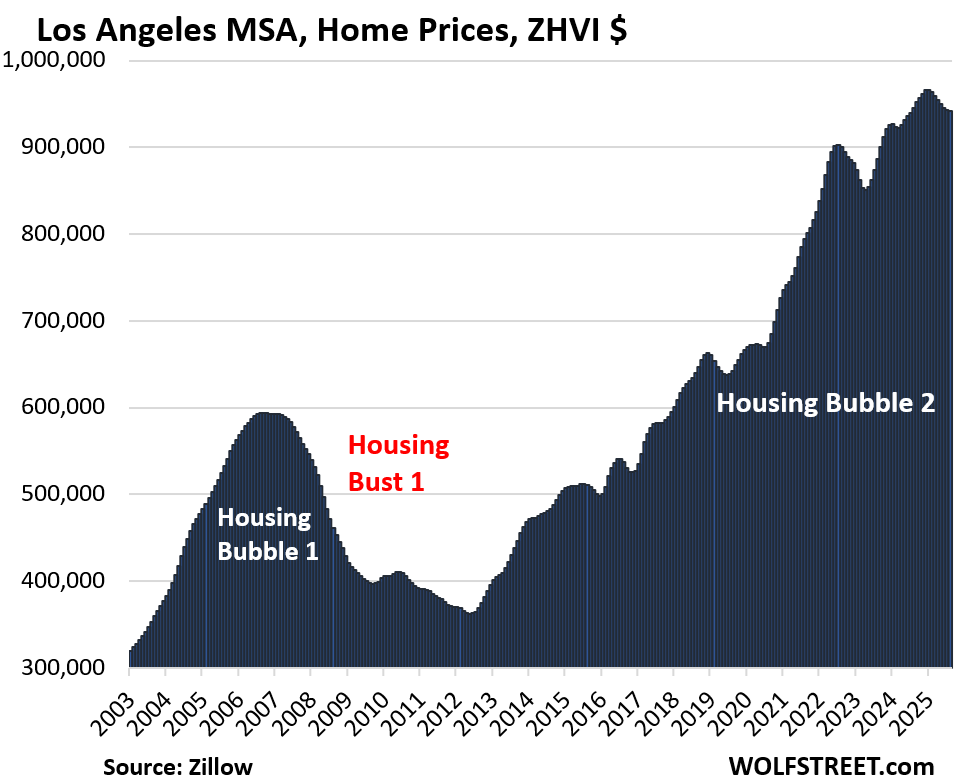
| Los Angeles MSA, Home Prices | |||
| Fr Dec 2024 high | MoM | YoY | Since 2000 |
| -2.5% | -0.1% | -0.4% | 324% |
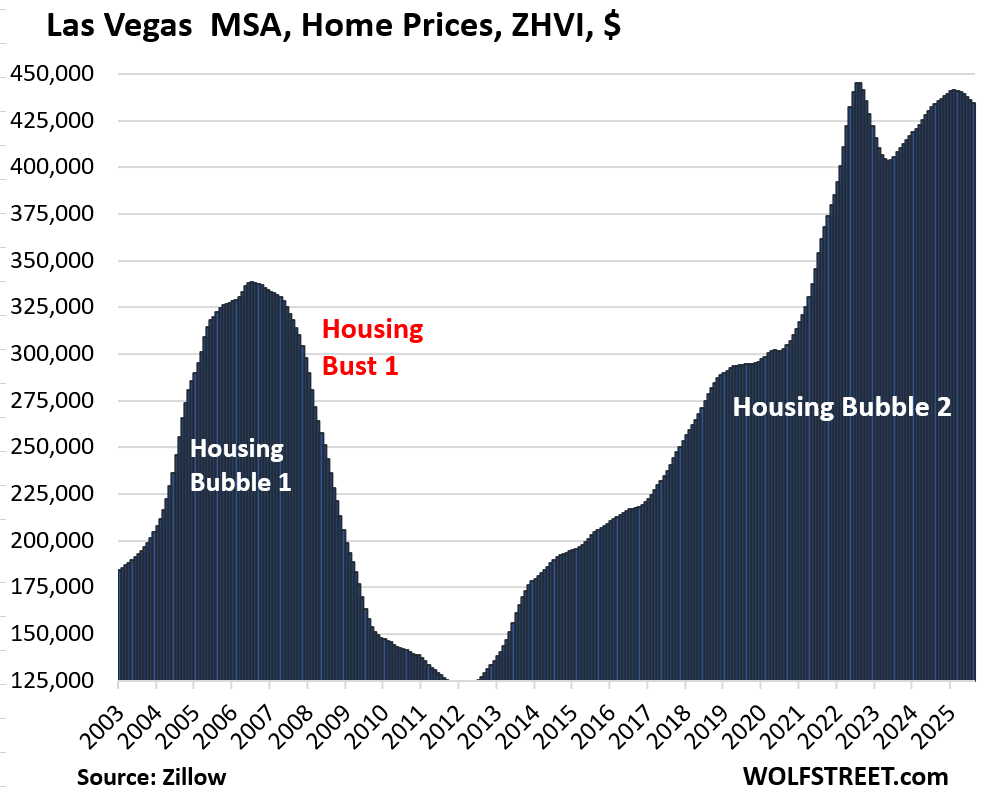
| Las Vegas MSA, Home Prices | |||
| From June 2022 peak | MoM | YoY | Since 2000 |
| -2.5% | -0.4% | 0.1% | 179% |
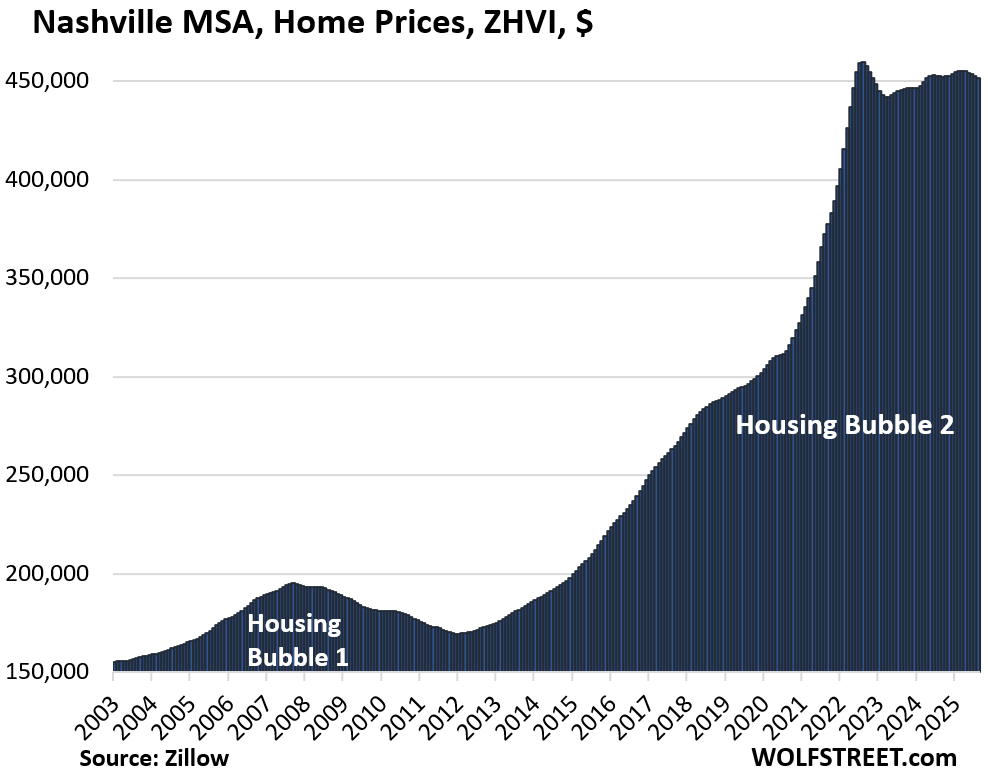
| Nashville MSA, Home Prices | |||
| From July 2022 peak | MoM | YoY | Since 2000 |
| -1.7% | -0.2% | -0.1% | 215% |
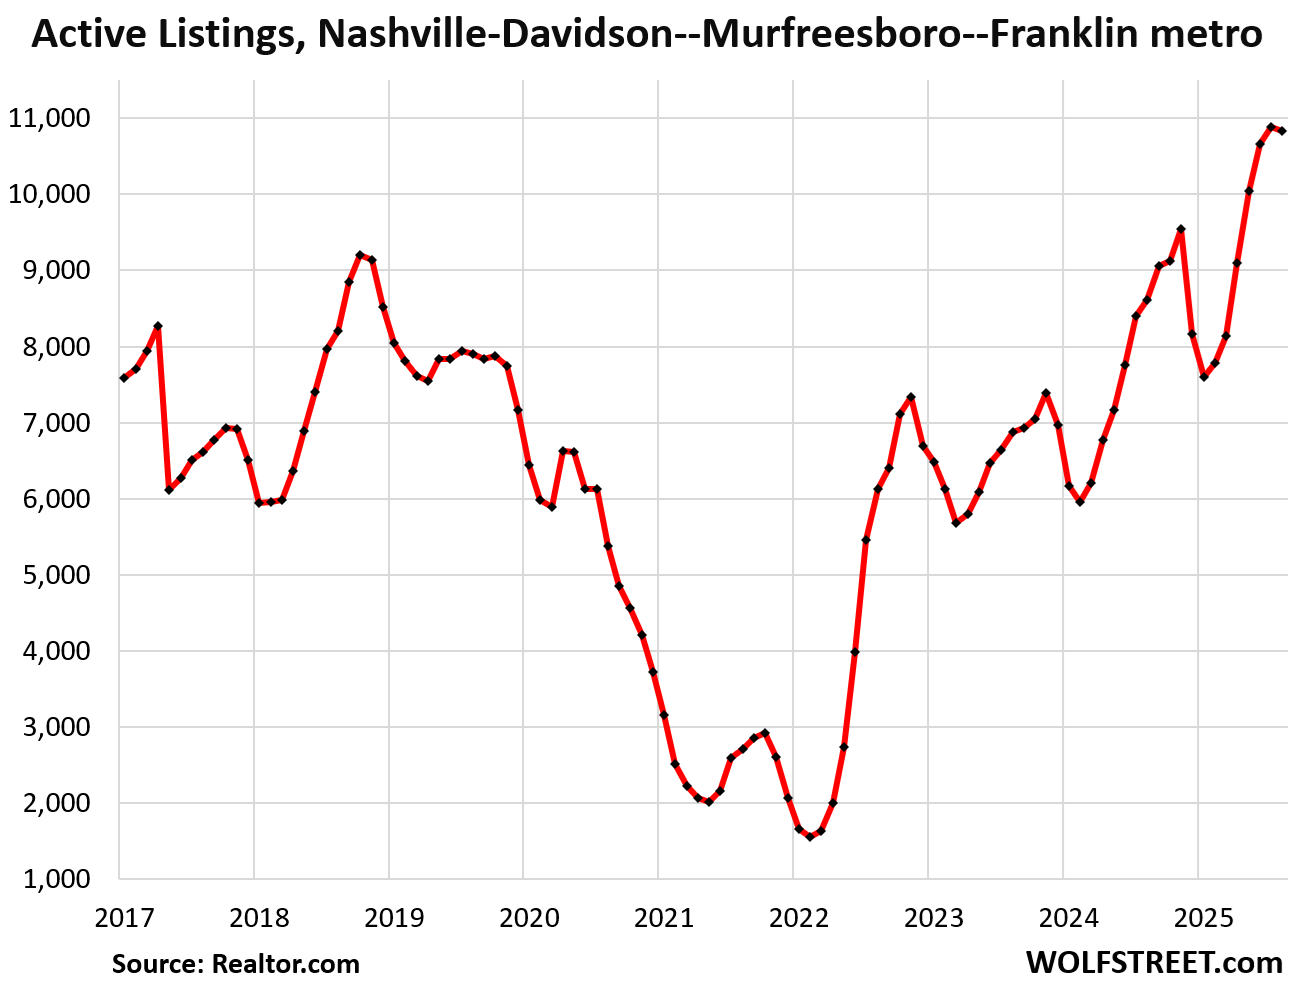
And inventory in the Nashville metro:
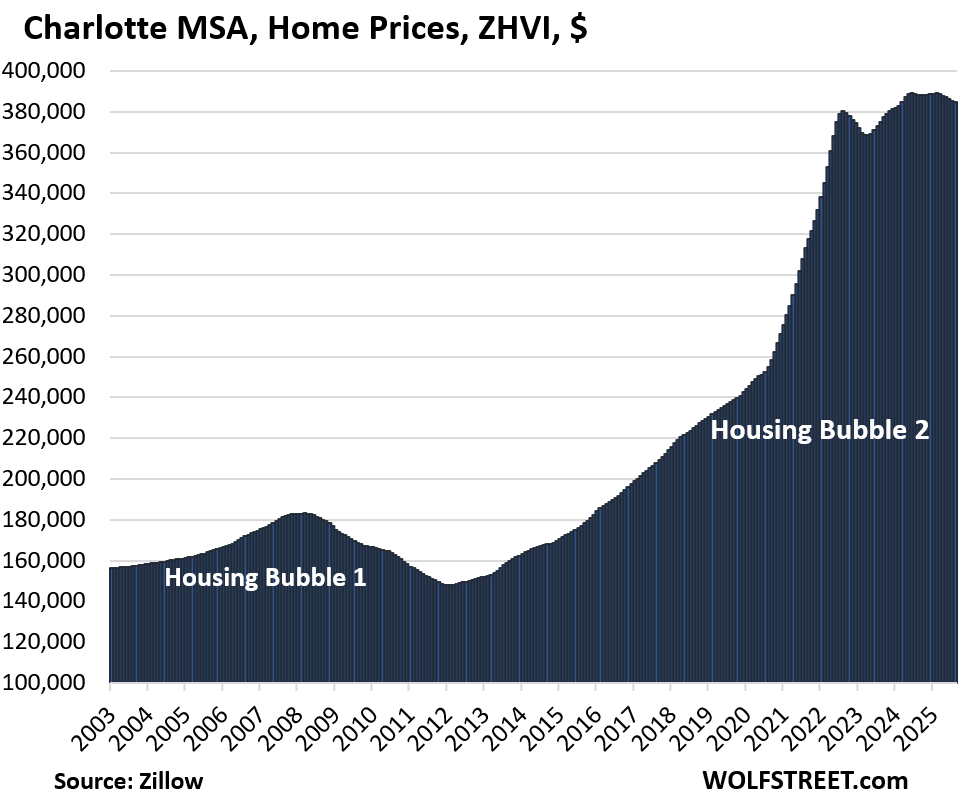
| Charlotte MSA, Home Prices | |||
| Fr May 2024 peak | MoM | YoY | Since 2000 |
| -1.0% | -0.1% | -0.9% | 166% |
Prices exploded by 54% between January 2020 and June 2022.
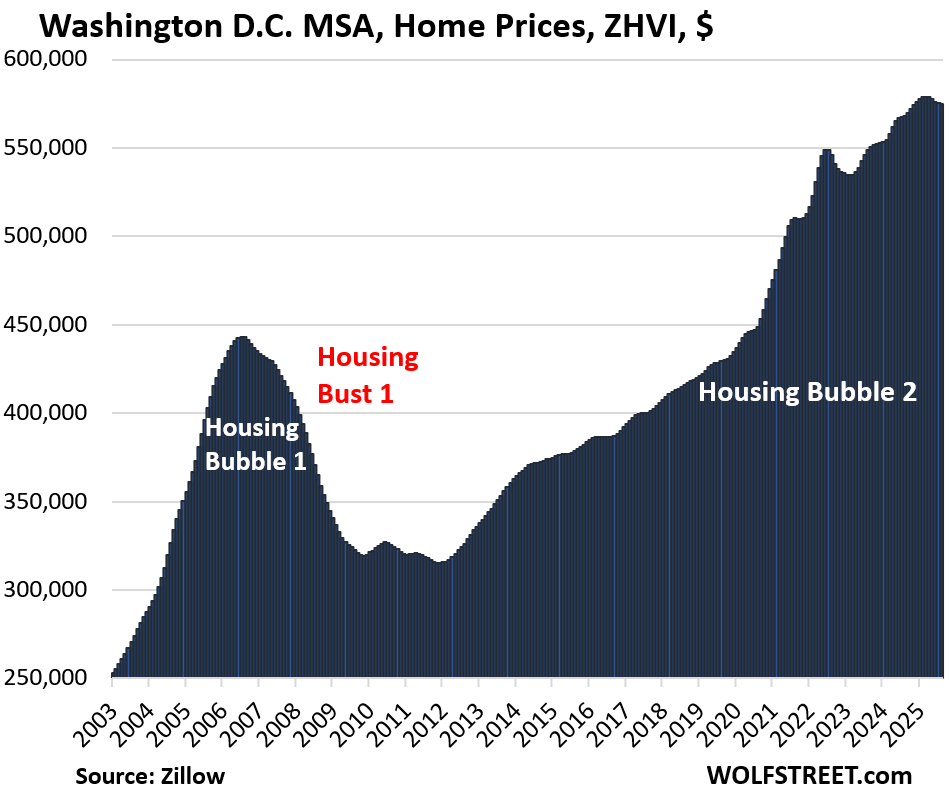
| Washington D.C. MSA, Home Prices | ||
| MoM | YoY | Since 2000 |
| -0.1% | 1.1% | 216% |
The Washington-Arlington-Alexandria, which includes all of Washington, D.C., and parts of Maryland, Virginia, and West Virginia, is a huge diverse area. In Washington DC itself, prices have been skidding, with single-family home prices down 12% from their peak.
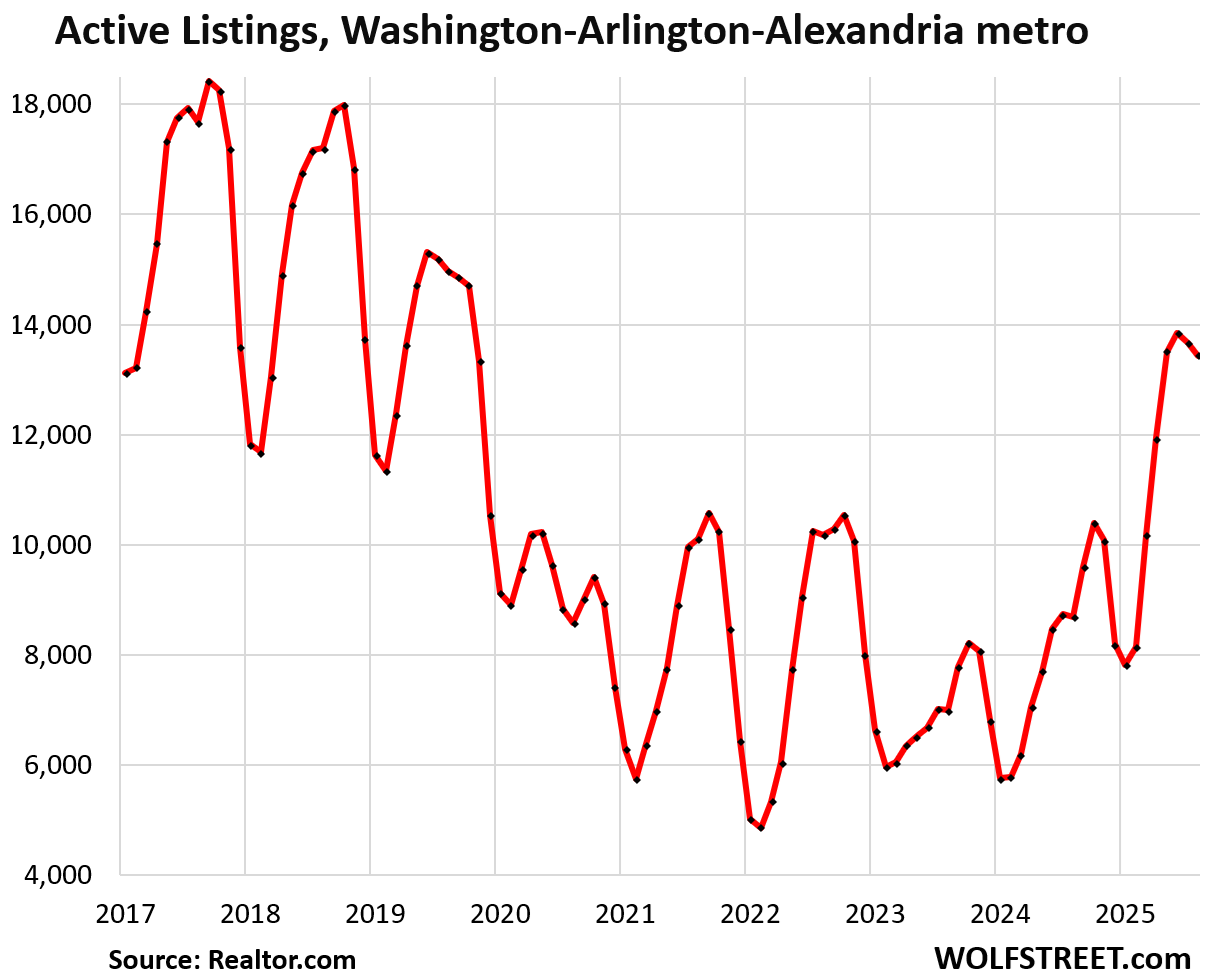
And inventory:
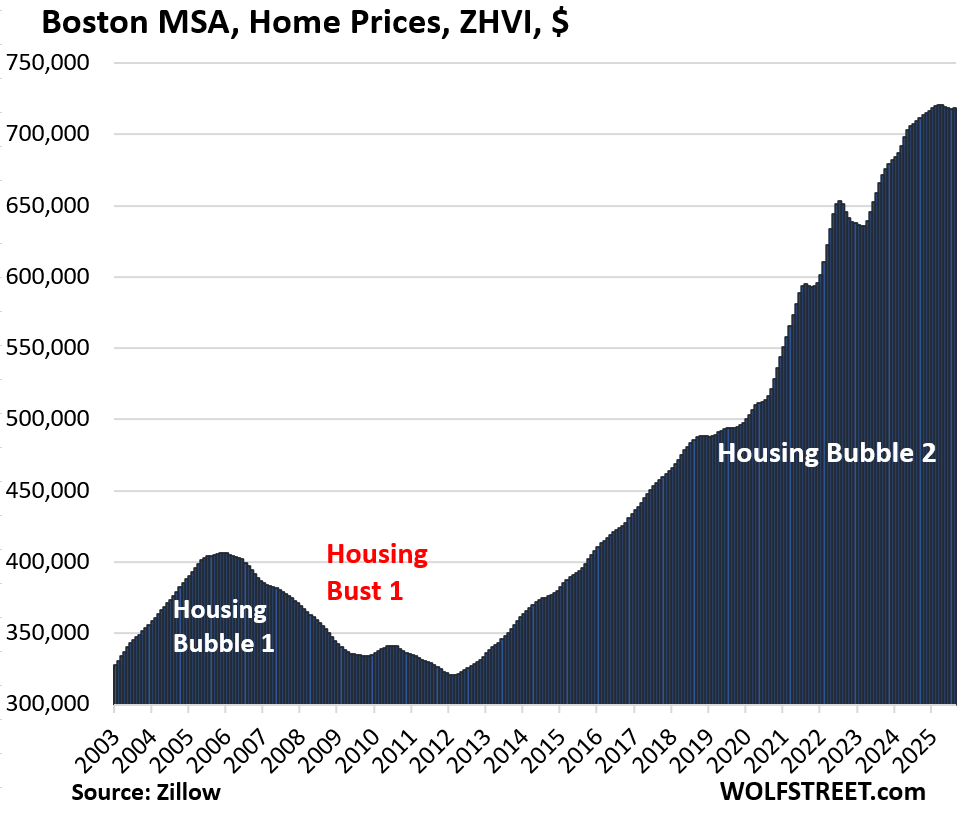
| Boston MSA, Home Prices | ||
| MoM | YoY | Since 2000 |
| 0.0% | 1.2% | 225% |
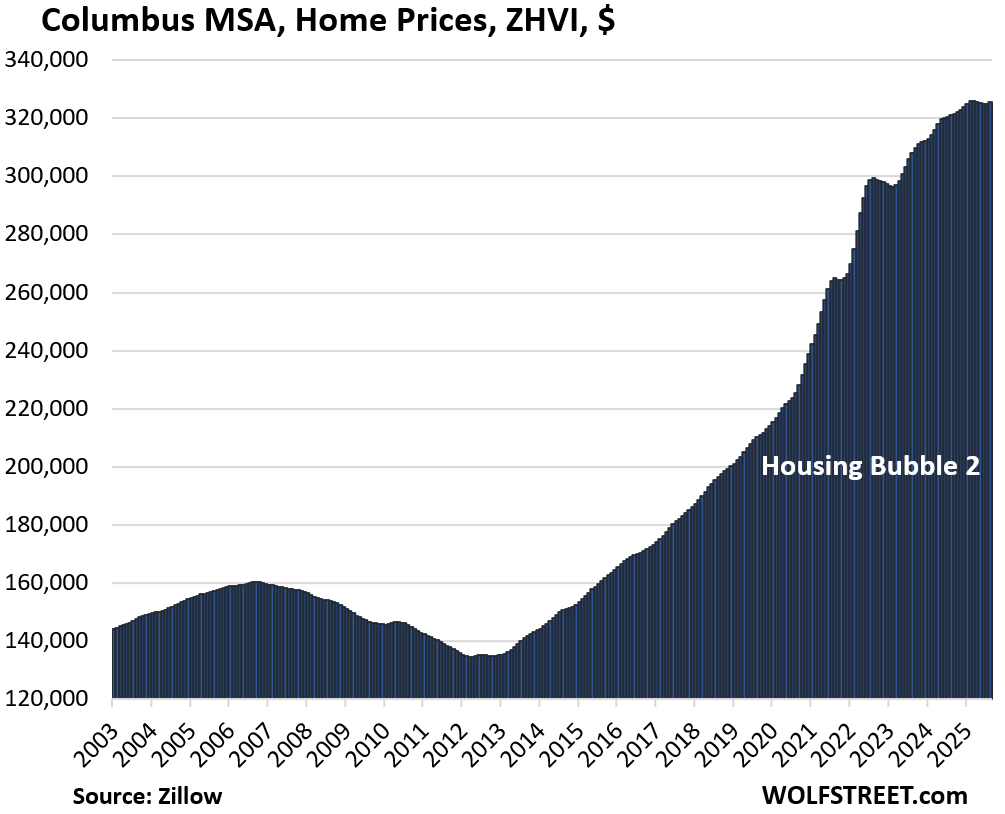
| Columbus MSA, Home Prices | ||
| MoM | YoY | Since 2000 |
| 0.1% | 1.4% | 155% |
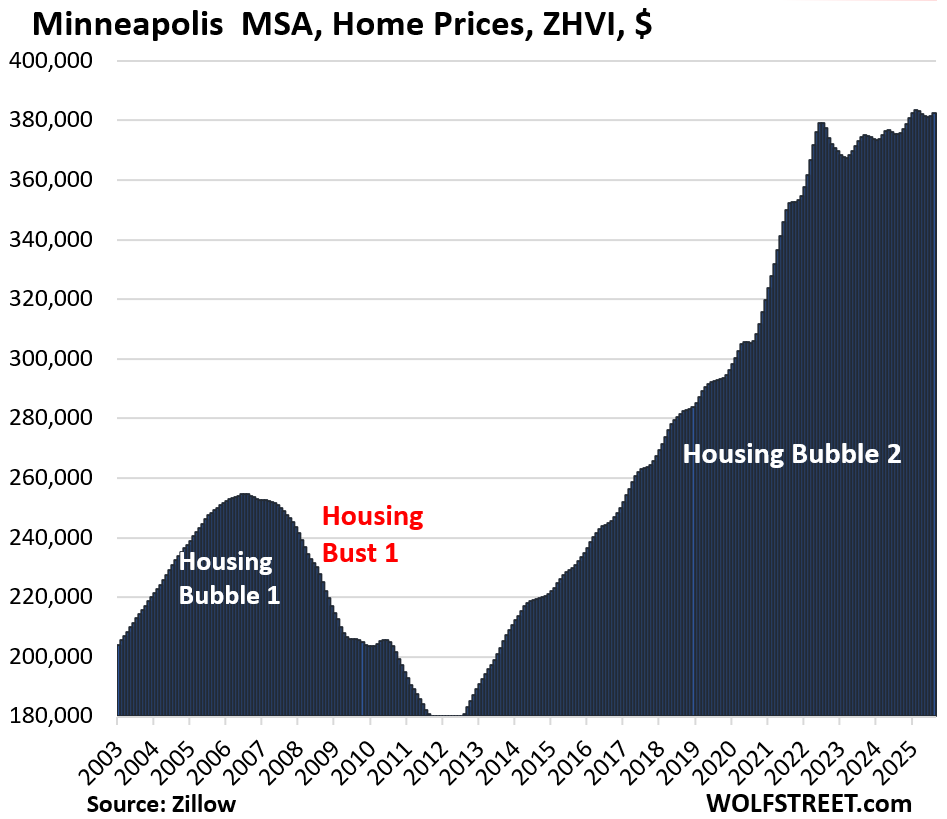
| Minneapolis MSA, Home Prices | ||
| MoM | YoY | Since 2000 |
| 0.3% | 1.9% | 160% |
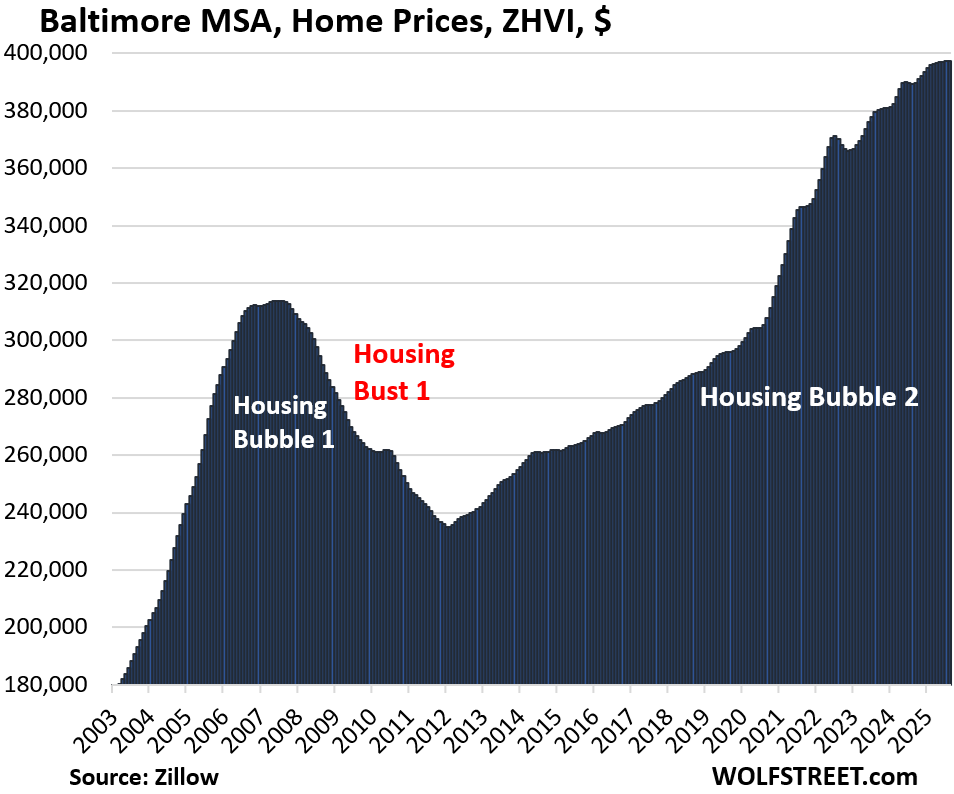
| Baltimore MSA, Home Prices | |||
| MoM | YoY | Since 2000 | |
| 0.1% | 2.1% | 177% | |
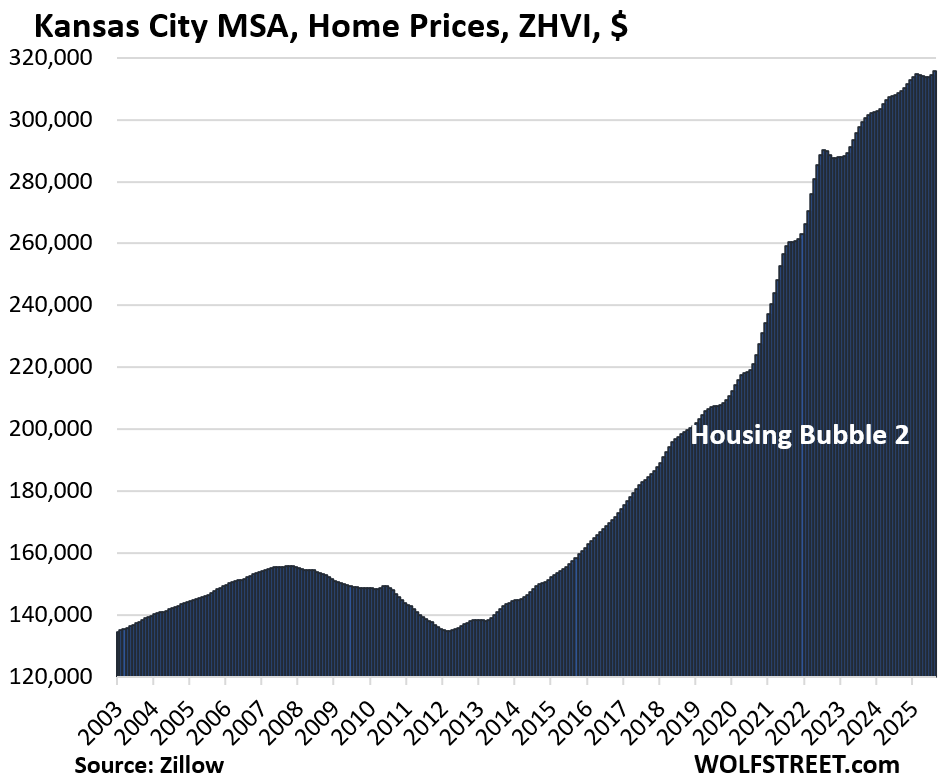
| Kansas City MSA, Home Prices | ||
| MoM | YoY | Since 2000 |
| 0.4% | 2.3% | 178% |
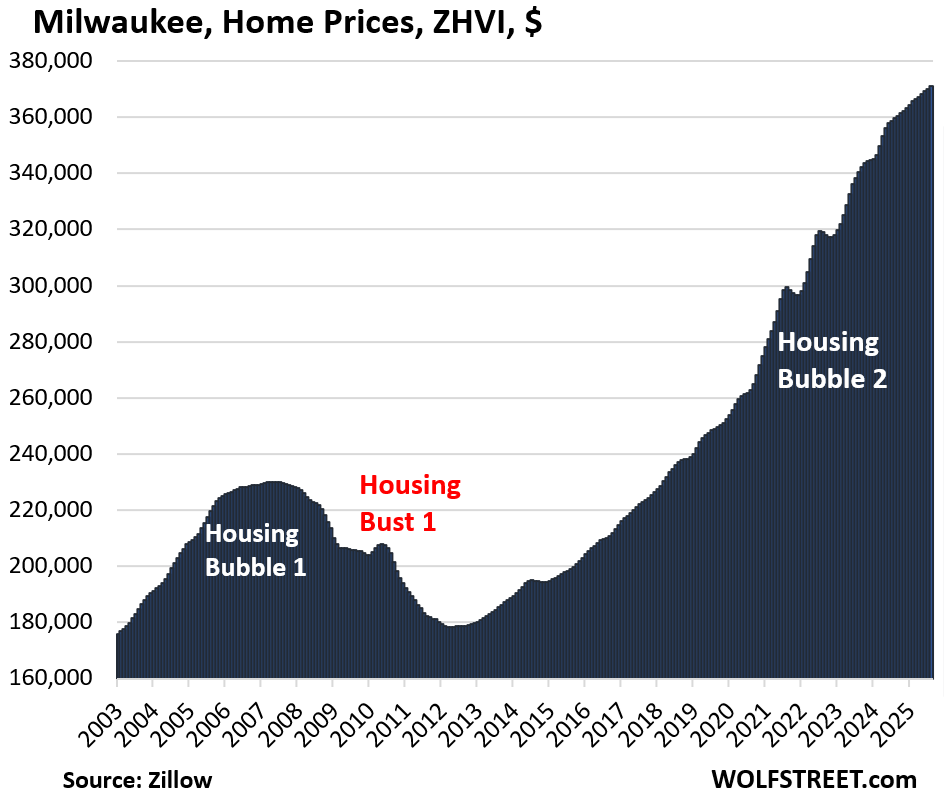
| Milwaukee MSA, Home Prices | ||
| MoM | YoY | Since 2000 |
| 0.2% | 3.2% | 150.7% |
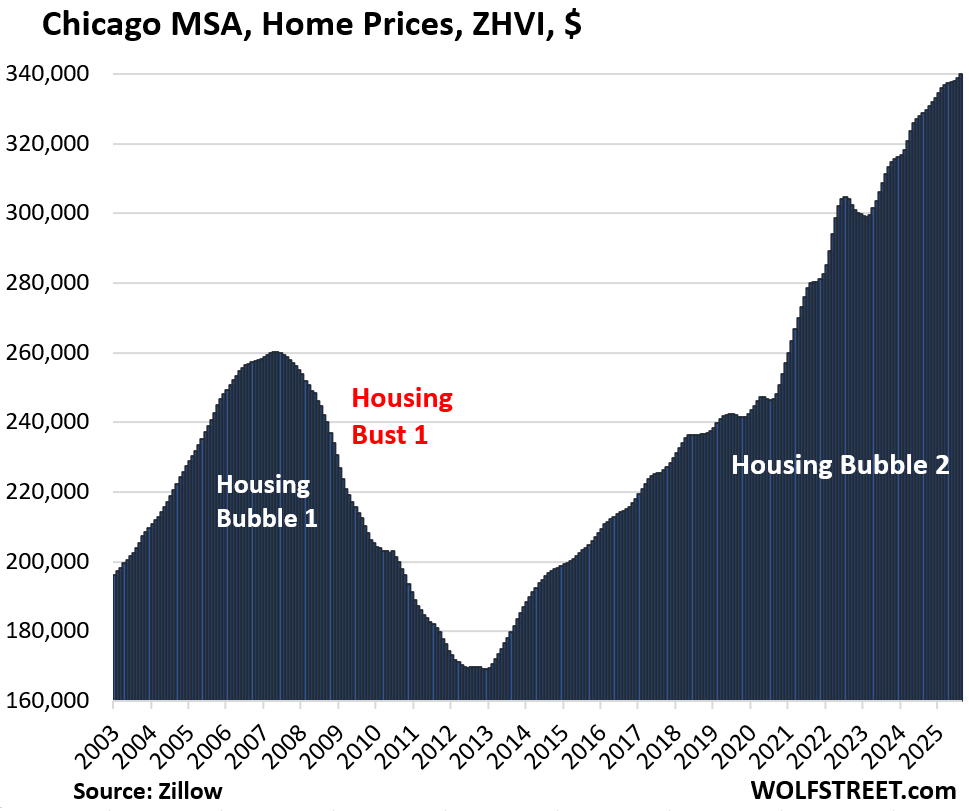
| Chicago MSA, Home Prices | ||
| MoM | YoY | Since 2000 |
| 0.3% | 3.4% | 118% |
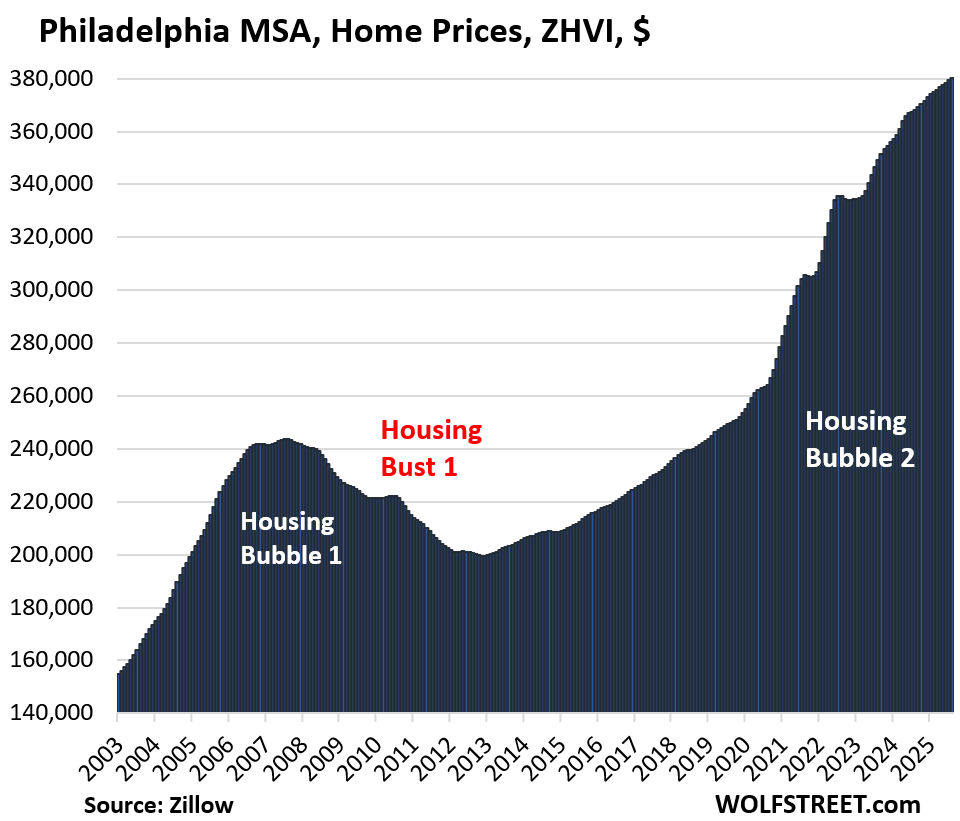
| Philadelphia MSA, Home Prices | ||
| MoM | YoY | Since 2000 |
| 0.2% | 3.4% | 208% |
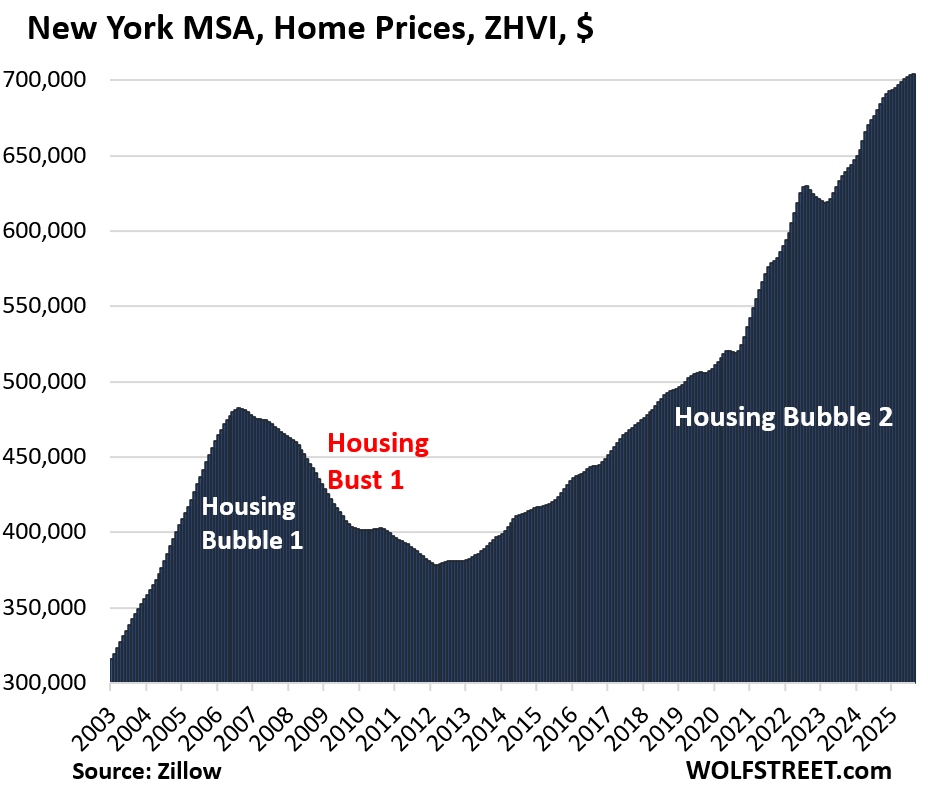
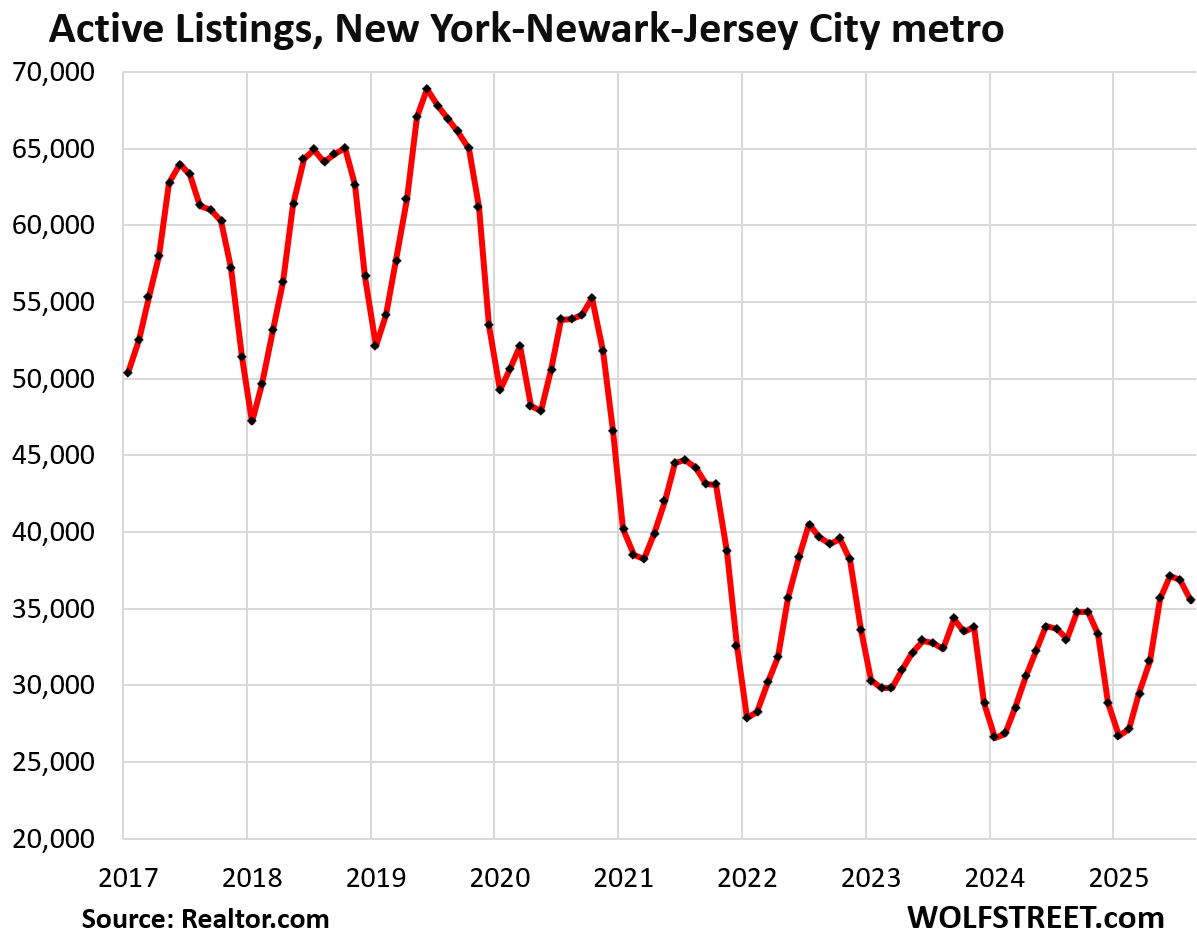
| New York MSA, Home Prices | ||
| MoM | YoY | Since 2000 |
| 0.1% | 3.6% | 219% |
And inventory:
Enjoy reading WOLF STREET and want to support it? You can donate. I appreciate it immensely. Click on the mug to find out how:

![]()


