.png)

Main
ALS is a lethal adult-onset motor neuron (MN) disease, characterized by disruption of NMJs, axonal degeneration and neuronal death1,2,3,4. Most ALS cases are linked to TDP-43 pathology, characterized by its mislocalization from the nucleus to the cytoplasm and the formation of phosphorylated aggregates5,6,7.
TDP-43 is a multifunctional DNA/RNA-binding protein with roles in transcriptional and splicing regulation, RNA processing and RNA transport/subcellular localization8,9,10,11,12. Recently, we showed that TDP-43 co-localizes with the core stress granule component G3BP1 in axonal condensates of patients with ALS and mice. These TDP-43-G3BP1 condensates sequester RNA and inhibit local protein synthesis, resulting in mitochondrial malfunction and NMJ disruption with subsequent axonal degeneration13. Thus, TDP-43 has profound effects in axons and NMJs, and its aggregation causes pathology not limited to the spinal MN cell bodies but also found in the distal portions of motor axons. Furthermore, recent studies revealed aggregation of TDP-43 in peripheral motor axons of patients with ALS during initial diagnosis14,15. Thus, axonal TDP-43 condensates exert pathological regulation over essential local synthesis events.
Localized protein synthesis is a mechanism enabling spatially constrained and temporally sensitive cellular responses to changes in intracellular or extracellular environment16,17,18. Neurons, with their extensively long axons, rely on local protein synthesis for proper function and survival19,20,21. Alterations in this process can lead to various neuropathological disorders, including ALS10,11,22,23,24,25,26. Each MN harbors numerous remote NMJs, and how translation is coordinated within each synapse is still unknown. Moreover, although TDP-43 is a potent driver of ALS toxicity and a key local synthesis regulator, the mode of its accumulation along axons and NMJs is a critical unaddressed question.
Here, we studied the localized accumulation of TDP-43 in axons and NMJs. Our findings highlight the presence of distal TDP-43 pathology in patients with SOD1 ALS and mouse models. We found that TDP-43 accumulates at NMJs due to aberrant local synthesis triggered by a reduction in miR-126a-5p within muscle EVs. This chain of events ultimately initiates neurodegeneration. Notably, miR-126 is neuroprotective in neuromuscular co-cultures, delays TDP-43 accumulation at NMJs and postpones the onset of motor symptoms in SOD1G93A mice. This unveils a new role for muscle EV-loaded micro RNAs (miRNAs) in regulating NMJ protein synthesis, thereby affecting NMJ maintenance and disruption in ALS.
Results
TDP-43 peripheral pathology in SOD1 patients and SOD1 mouse models
TDP-43 pathology is not limited to the spinal MN cell bodies but is also found in motor axons of patients with ALS13,14,15. SOD1 patients are traditionally considered negative for TDP-43 pathology based on observations from postmortem spinal and cortical MNs. However, unexpectedly, when analyzing their peripheral nerves, we identified phosphorylated TDP-43 (pTDP-43) aggregates along the axons in an obturator nerve biopsy from a SOD1 c.442 G > A mutant patient and in intramuscular nerves from a SOD1 c.26 T > A mutant patient (Fig. 1a,b and Extended Data Fig. 1). These pTDP-43 aggregates resemble those found in sporadic ALS (sALS) biopsies and minimally detectable in non-ALS pathologies. We next examined TDP-43 in SOD1G93A and SOD1G37R mouse models. Immunofluorescent and biochemical analyses of sciatic nerves from both models indicated the accumulation of TDP-43 and pTDP-43 in peripheral nerves at symptomatic stages of the disease (Fig. 1c–j and Extended Data Figs. 1b–f and 2). Notably, we did not observe TDP-43 mislocalization or aggregation in cell bodies of spinal MNs (Extended Data Fig. 3). Additionally, using three-dimensional co-localization analysis, we discovered that pTDP-43 accumulates in NMJs of SOD1G93A and SOD1G37R mice before symptom onset and throughout disease progression (Fig. 1k–p and Extended Data Fig. 4a–h). Interestingly, the pathology was more apparent in fast fatigable extensor digitorum longus (EDL) muscles compared to the slow fatigable soleus muscles (Fig. 1k,l and Extended Data Fig. 4i–l). Accumulation of TDP-43 in NMJs is negatively correlated with local protein synthesis13. To verify whether this also occurs in SOD1 mutants, we used O-propargyl puromycin (OPP) to label and quantify newly synthesized proteins in NMJs. Indeed, analysis of the OPP signal specifically within presynaptic axons revealed a reduction in presynaptic protein synthesis in both SOD1G93A and SOD1G37R NMJs as well as in NMJs in SOD1G93A primary co-cultures (Fig. 1q–t and Supplementary Fig. 1). Thus, our findings reveal a confined accumulation of TDP-43 in peripheral nerves and NMJs of patients with SOD1 ALS and animal models, which may affect local protein synthesis. Furthermore, TDP-43 retains its typical nuclear localization in the SOD1 models, suggesting that this process can be regulated by local translation within distal axons and NMJs.
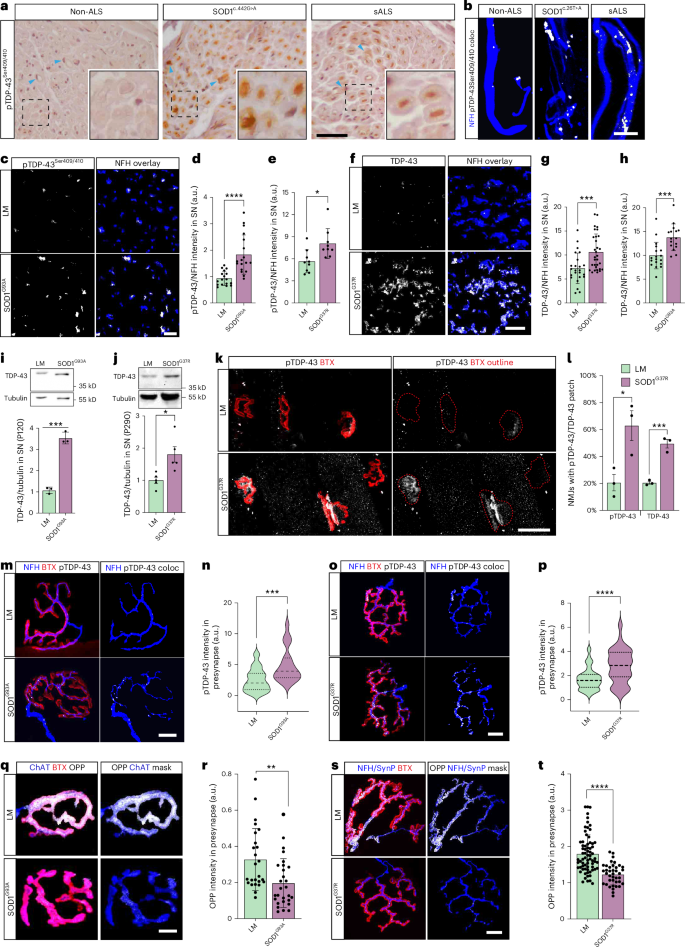
a, Immunohistochemical staining for pTDP-43 in obturator nerve biopsies of non-ALS patients (motor neuropathy), patients with SOD1 (c.442 G > A) and patients with sALS. Arrowheads indicate Schwann cells. Scale bar, 10 µm. b, Immunofluorescent staining for pTDP-43 in intramuscular nerves in biopsies of non-ALS patients, patients with SOD1 (c.26 T > A) and patients with sALS. White indicates NFH–pTDP-43 co-localization. Scale bar, 5 µm. c–e, Immunofluorescent images and quantification of pTDP-43 in sciatic nerve cross-sections of SOD1G93A (d) and SOD1G37R (e) mice and their littermates. White indicates NFH-masked TDP-43. Scale bar, 10 µm. n = 17 (d) and n = 9 (e) nerve sections. *P = 0.0368, ****P = 0.000044. f–h, Immunofluorescent images and quantification of TDP-43 in sciatic nerve cross-sections of SOD1G37R (g) and SOD1G93A (h) mice and their littermates. White indicates NFH-masked TDP-43. Scale bar, 10 µm. n = 24, 31 (g) and n = 18, 16 (h) nerve sections. ***P = 0.0006 (g), P = 0.0004 (h). i,j, Representative images and quantification of western blots for TDP-43 (43 kD) and tubulin (55 kD) in sciatic nerve axoplasms of SOD1G93A (i) and SOD1G37R (j) mice versus their littermates. n = 3, 4 mice, respectively. *P = 0.0149 (j), ***P = 0.0002 (i). k,l, Representative images and quantitative analysis for the percent of NMJs with apparent TDP-43/pTDP-43 patch in EDL muscles from P290 SOD1G37R and littermate controls. Red dashed line marks BTX perimeter. Scale bar, 30 µm. n = 3 mice per group. ***P = 0.0009, *P = 0.0288. m–p, Immunofluorescent images and quantification of NFH–pTDP-43 co-localization in NMJs of presymptomatic (P60) SOD1G93A (m,n) and (P290) SOD1G37R (o,p) mice versus their littermates. White indicates NFH–pTDP-43 co-localization. Scale bar, 15 µm. n = 29, 20 (n); n = 53, 59 (p) NMJs. ***P = 0.0005 (n), ****P = 0.000019 (p). q–t, Representative images and quantification of the OPP labeling in NMJs of presymptomatic (P60) SOD1G93A (q,r) and (P290) SOD1G37R (s,t) mice and their littermates. White indicates OPP–ChAT or OPP–NFH–synaptophysin three-dimensional co-localization. Scale bar, 10 µm. n = 30 (r) and n = 72, 40 (t) NMJs. **P = 0.0032, ****P= 1.21 × 10⁻⁶. For d,e,g,h,r,t, data are shown as the mean ± s.d., repeated in three mice per genotype. For i,j,k,l, data are shown as the mean ± s.e.m., repeated in three mice per genotype. For n,p, data are shown in violin density plots with markings of first, median and third quartiles, repeated in three mice per genotype. For d,e,g–l,n,p,r,t, two-tailed unpaired Student’s t-test. coloc, co-localization; LM, littermate; SN, sciatic nerve.
Muscles restrain local TDP-43 mRNA translation
Reanalyzing axonal RNA sequencing (RNA-seq) data27, we found that TDP-43 mRNA is abundant in axons (Extended Data Fig. 5a). To determine whether TDP-43 mRNA is localized and locally translated in axons, we isolated pure axonal RNA from primary MN cultures using radial microfluidic chambers (MFCs)13 and performed quantitative polymerse chain reaction (qPCR). This revealed a roughly similar abundance of TDP-43 mRNA in axons and somata (Fig. 2a). Additionally, we purified RNA from sciatic nerve axoplasms after PCR amplification for TDP-43 (Tardbp), polymerase-β (Polb; soma marker, negative control for axonal RNA) and β-actin (Actb) mRNAs (as a positive control for axonal RNA). We detected clear amplicons of both TDP-43 and β-actin mRNAs in the absence of Polb (Fig. 2b). Moreover, single-molecule fluorescence in situ hybridization (smFISH) in primary MNs revealed axonal-localized puncta of TDP-43 and β-actin mRNA (Fig. 2c and Extended Data Fig. 5b). smFISH for TDP-43 and β-actin on EDL muscles showed that both mRNAs are localized in presynaptic axons at NMJs (Fig. 2d). Altogether, this evidence indicates that TDP-43 mRNA is localized in distal axons and NMJs both in vitro and in vivo.
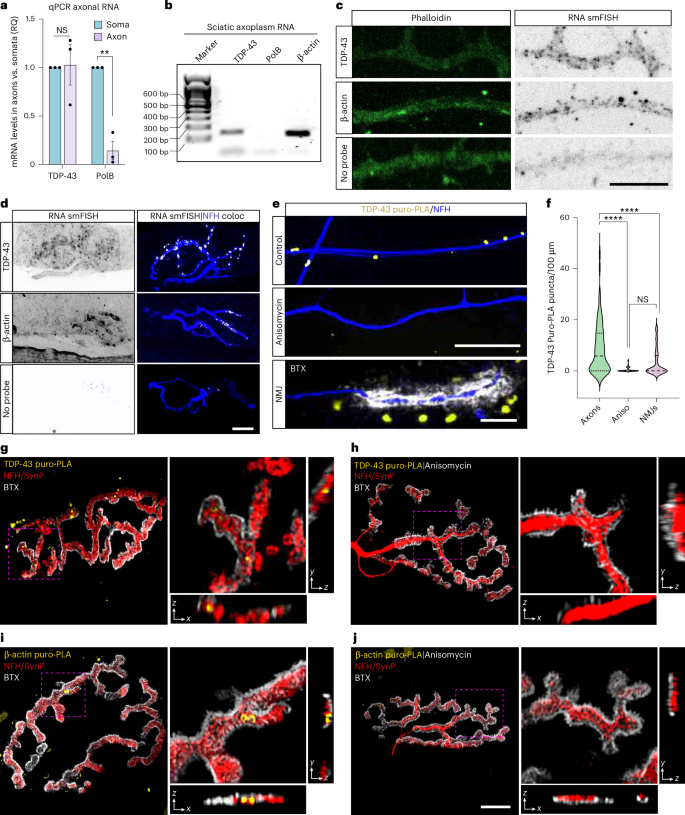
a, Quantitative RT–PCR analysis of the relative mRNA levels of TDP-43 and PolB in RNA preparations from soma or axonal compartments of radial MFCs. n = 3 neuronal cultures; each repeat represents a pool of several radial chambers. RQ, relative quantification. NS = 0.9814, **P = 0.0015. b, Representative image of an agarose gel with cDNA amplicons of TDP-43, PolB and β-actin amplified from sciatic nerve axoplasm RNA. n = 5 mice. c, Representative images of smFISH for mRNA of TDP-43 and β-actin in primary MN axons compared to no probe control. Scale bar, 5 µm. d, Representative images of smFISH for mRNAs of TDP-43 and β-actin in EDL muscle NMJs compared to no probe control. White indicates smFISH–NFH three-dimensional co-localization result. Scale bar, 10 µm. e,f, Representative images and quantification of TDP-43 puro-PLA in axons in the presence or absence of anisomycin (40 µM) and in in vitro NMJs (lowest panel). Scale bars, 20 µm and 5 µm. n = 97, 91, 62 axons and NMJs, respectively. NS = 0.0525, ****P = 3 × 10⁻¹⁵ (Aniso), P = 1.31 × 10⁻⁶ (NMJ). g,h, Representative images and orthogonal slices of TDP-43 puro-PLA in EDL NMJs treated with puromycin (g) or with anisomycin + puromycin (h) muscles. i,j, Representative images and orthogonal slices of β-actin puro-PLA labeling in EDL NMJs treated with puromycin (i) or with anisomycin + puromycin (j) muscles. SynP, synaptophysin labeling. Scale bar, 10 µm. For a, data are shown as the mean ± s.e.m., two-way ANOVA with multiple comparisons. For c, representative experiment repeated in three neuronal cultures. For d, representative experiment repeated in three ex vivo muscle preparations. For f, data are shown in violin density plots with markings of first, median and third quartiles, one-way ANOVA with Holm–Sidak correction for multiple comparisons, repeated in three neuronal cultures. Aniso, anisomycin; coloc, co-localization; NS, not significant.
To test whether TDP-43 mRNA is locally translated in axons and NMJs, we used a puromycin proximity ligation assay (puro-PLA)28. Quantitative analysis of TDP-43 puro-PLA in primary MNs grown in compartmental MFCs indicated that TDP-43 is synthesized in axons (Fig. 2e,f). This was further validated by ablation of axonal TDP-43 followed by TDP-43 small interfering RNA (siRNA) treatment (Extended Data Fig. 5c,d). Next, we repeated the TDP-43 puro-PLA in a compartmental neuromuscular co-culture13,29,30. Unexpectedly, the number of TDP-43 puro-PLA puncta in presynaptic axons was markedly reduced, implying a role for muscles in controlling local protein synthesis (Fig. 2f and Extended Data Fig. 5e). We also visualized TDP-43 and β-actin local translation ex vivo, detecting presynaptic TDP-43 synthesis in a small fraction of NMJs (Fig. 2g–j and Supplementary Fig. 2a). Lastly, examination of NMJs within EDL muscle of SOD1G37R mice suggests increase in local translation of TDP-43 (Supplementary Fig. 2b). Overall, these results indicate that TDP-43 mRNA is distributed into axons where it can be locally translated, a process that is limited in the NMJ but may increase in mice harboring SOD1 mutations.
Muscles communicate with presynaptic axons via miRNA-loaded EVs
Our results suggest that the presynaptic local synthesis of TDP-43 can be silenced by transcellular processes, such as by miRNA-loaded EVs31. Therefore, we hypothesized that the EV machinery is also present in the postsynaptic apparatus in NMJs. Using in vivo immunofluorescence, we found that several hallmark EV markers, such as CD63, CHMP2A and CD81, are enriched in postsynaptic regions in muscles (Fig. 3a–c and Extended Data Fig. 6a–d). To determine whether these represent functionally secreted EVs, we used compartmental neuromuscular co-cultures in which muscles were transfected with CD63-pHluorin (Fig. 3d)32. Live imaging of CD63-pHluorin in co-cultures shows a strong signal rising in synaptic regions (bungarotoxin (BTX) positive) compared to extrasynaptic regions in muscles, reinforcing our observation of EV enrichment in NMJs (Fig. 3e,f, Extended Data Fig. 6e and Supplementary Video 1). Similar experiments with CD63–GFP visualize the transmission of EVs from skeletal muscles and their uptake into axons (Supplementary Fig. 3a–f and Supplementary Videos 2 and 3). Using SYTO RNASelect to label total RNA in primary muscle cultures, we further observed the uptake and the intra-axonal shuttling of muscle-derived RNA (Supplementary Fig. 3g,h). To further characterize this process, we isolated muscle-derived EVs from the conditioned media of primary myocytes by ultracentrifugation33. Transmission electron microscopy (TEM) and nanoparticle tracking analysis (NTA) validated the predominant presence of bi-layer EVs with an average diameter of 100 nm, congruent with the size of exosomes (Fig. 3g,h). RNA-seq analysis of axonal RNA from axons treated with muscle-derived EVs identified transcriptional changes, implying that these EVs carry miRNAs, as suggested by the immediate reduction in the abundance of multiple transcripts (Supplementary Fig. 3i and Supplementary Table 1). Additionally, western blot characterization of EV preparations validated the presence of the hallmark exosome marker CD63 and the inclusion of the RNA-induced silencing complex (RISC) component Argonaut 2 (Ago2), as also previously reported34, suggesting the transmission of miRNAs and RISC machinery through muscle EVs (Fig. 3i and Supplementary Fig. 4a,b). Notably, we did not detect traces of TDP-43 in these preparations, suggesting that it is not primarily sorted into muscle EVs. Using an NMJ co-culture, we transfected primary muscle cells with Ago2–GFP and observed Ago2–GFP puncta in adjacent axons (Supplementary Fig. 5a,b and Supplementary Videos 4 and 5). Immunostaining confirmed Ago2 transfer from muscles to axons (Fig. 3j,k and Supplementary Fig. 5c). Additionally, miRNA sequencing of axons treated with muscle-derived EVs revealed an increase in muscle-specific miRNAs (myomiRs) and a decrease in axonal protein synthesis (Supplementary Fig. 4c–h and Supplementary Table 1). Together, these results suggest that RISC components are transferred from muscle to neuron via exosome-like EVs, regulating the RNA population at the NMJ.
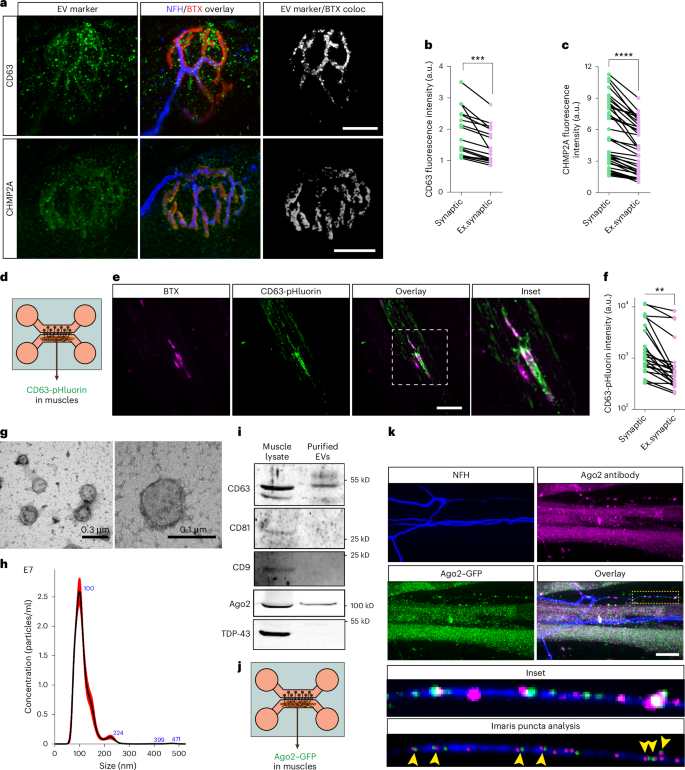
a–c, Representative images and quantitative analysis (b,c) of NMJ immunolabeling for CD63 (upper panel b) and CHMP2A (lower panel c). Gray indicates three-dimensional co-localization result of CD63/CHMP2A and BTX. Scale bar, 10 µm. n = 19 (b) and n = 39 (c) muscles. ***P = 0.00012 (b), ****P = 1.17 × 10⁻¹⁰ (c). d, Illustration of experimental setup in e and f. Primary skeletal muscles were transfected with CD63-pHluorin vector and co-cultured with primary MNs in compartmental MFCs. e,f, Representative images and quantification of CD63-pHluorin signal and localization in neuromuscular co-cultures. Scale bar, 20 µm. n = 24 muscles from three independent repeats. Two-tailed paired Student’s t-test, **P = 0.0015. g, Representative TEM images of muscle-derived EVs. Scale bars, 300 nm (left panel) and 100 nm (right panel). h, Representative NTA plot for muscle conditioned media. i, Representative images of western blots for CD63 (55 kD), CD81 (26 kD), CD9 (22 kD), Ago2 (87 kD) and TDP-43 (43 kD) in protein lysates of primary muscles and primary muscle-derived EVs. j, Illustration of experimental setup for j. Primary skeletal muscles were transfected with Ago2–GFP vector and co-cultured with primary MNs in compartmental MFCs. k, Upper panel: representative images of immunolabeling for Ago2 and GFP in neuromuscular co-cultures. Lower panel: inset and representative image of Imaris puncta analysis for Ago2 and GFP antibody labeling within axons. Yellow arrowheads indicate co-localized GFP and Ago2 signals in axons. Scale bar, 10 µm. For b,c,f, data are shown as pairs of signal intensity in synaptic versus extra-synaptic regions within the same muscle. For b,c, experiment was repeated in three mice. For f, experiment was repeated in three co-cultures. For b,c,f, two-tailed paired Student’s t-test. For g,h,I, representative for three biological repeats of muscle culture and EV preparation. For k, repeated once. Representative of 15 images. coloc, co-localization; Ex.synaptic, extra-synaptic.
EV-derived miR-126a-5p regulates TDP-43 turnover at NMJs
To elucidate the function of muscle-derived EVs in presynaptic axons, we performed small RNA-seq for muscle EVs and whole-cell lysates. This revealed a subpopulation of miRNAs that is compartmentalized into EVs (Fig. 4a and Supplementary Table 2). Of the most compartmentalized miRNAs in muscle-derived EVs, we identified miR-126a-5p, which we previously reported to be downregulated in SOD1G93A muscles and MNs35. This result was further validated by specific TaqMan RT–qPCR for muscle-derived miR-126a-5p (Fig. 4b). The compartmentalization of miR-126a-5p and other miRNAs implies a paracrine function rather than an autocrine function, such as was previously indicated for miR-206 (ref. 36) (which was not compartmentalized in muscle-derived EVs). Based on this assumption, we performed miRNA FISH for miR-126a-5p in EDL muscles and confirmed that its expression was almost exclusively confined to the NMJ region, strengthening our hypothesis that these miRNAs target mRNA transcripts in non-muscle neighboring cells such as presynaptic motor axons (Fig. 4c). Next, we used TargetScan miRNA target predictions to test whether any of the ALS-associated genes (Amyotrophic Lateral Sclerosis online Database (ALSoD)37) are predicted targets of miR-126a-5p. This revealed more than 50 out of the 154 genes, of which six are definitive ALS genes, including TDP-43 having the highest prediction score of all (TARDBP; Supplementary Table 3). Our verification revealed that the majority of both the mouse and human TARDBP mRNA transcript variants include at least one binding site for miR-126a-5p (miR-126-5p in humans).
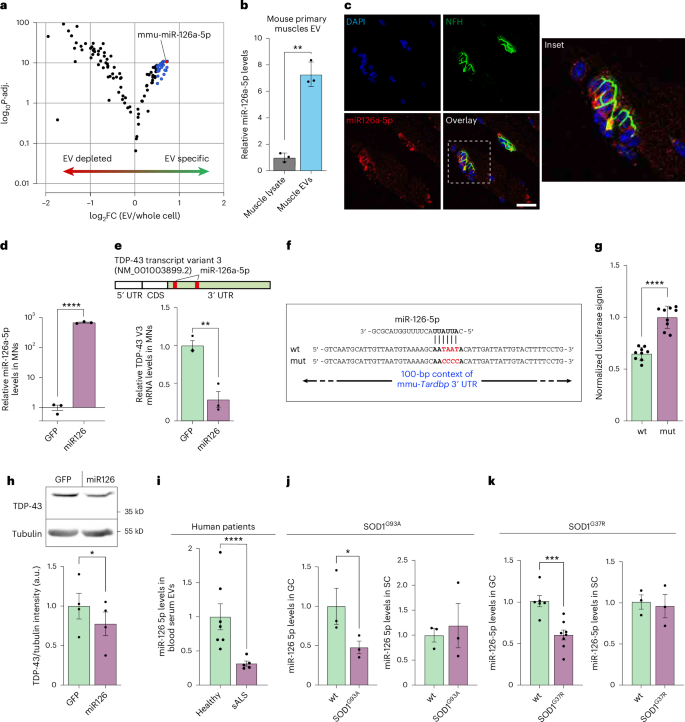
a, Volcano plot of small RNA-seq from muscle-derived EVs and whole-cell lysates of muscle cultures. Data are shown as log2FC of EV miRNAs over whole-cell lysates. Blue dots indicate miRNA with log2FC > 0.5 and −log10Padj > 2. n = 3 cultures/isolated EVs. Wald test with correction for multiple comparisons. b, Quantitative TaqMan RT–PCR for miR-126a-5p in whole-cell muscle lysates versus muscle-derived EVs. n = 3 cultures/isolated EVs. **P = 0.0073. c, Representative images of miR-126a-5p FISH in NMJs of EDL muscles. Scale bar, 10 µm. d, TaqMan RT–qPCR analysis of miR-126a-5p levels in GFP-infected and miR-126-infected primary MNs. U6 was used as loading control. n = 3 neuronal cultures. ****P = 0.000014. e, Top, scheme of TDP-43 transcript variant 3 mRNA with marking of the approximate location of two miR-126a-5p binding sites. Bottom, RT–qPCR for mmu-Tardbp transcript variant 3 in primary MNs infected with either empty GFP backbone or miR126–GFP vector. n = 3 neuronal cultures. **P = 0.0046. f,g, Scheme and quantitative analysis (g) of dual-luciferase assay for miR-126a-5p and mmu-Tardbp mRNA interaction. One hundred base pairs (bp) of the 3’ UTR of mmu-Tardbp mRNA, including one miR-126a-5p (wt) or a mutant miR-126a-5p (mut), were inserted into dual-luciferase reporter plasmid. n = 9 replicates from three repeats. ****P = 2.46 × 10⁻⁷. h, Representative images and quantification of western blots for TDP-43 (43 kD) in primary MNs infected with GFP or with miR126–GFP vector. Tubulin (55 kD) was used as loading control. n = 4 neuronal cultures. *P = 0.0258. i, TaqMan RT–qPCR analysis for miR-126-5p in serum-derived EVs of patients with sALS (n = 7) and healthy controls (n = 5). ****P = 0.000019. j,k, TaqMan RT–qPCR for miR-126-5p in P60 SOD1G93A GC muscles and P60 SOD1G93A SC (j) and P357 SOD1G37R GC muscles and P357 SOD1G37R SC (k). U6 was used as loading control. n = 3 (SC), n = 3 (j; GC) and n = 6–8 (k; GC) mice in each group. One-tailed (j; GC) or two-tailed (j,k) unpaired t-test, *P (j) < 0.0491, NS (j) = 0.6973, ***P (k) < 0.0004, NS (k) = 0.9591. For b,d,e,h–k, data are shown as the mean ± s.e.m. For g, data are shown as the mean ± s.d. For b, two-tailed paired Student’s t-test. For d,e,g,h,i,j (SC),k, two-tailed unpaired Student’s t-test. For j (GC), one-tailed unpaired Student’s t-test. For c, images represent eight repeats in mouse muscles. FC, fold change; CDS, coding sequence; GC, gastrocnemius; mut, mutant; NS, not significant; Padj, adjusted P value; SC, spinal cord; wt, wild-type.
The dominant axonal mouse variant of Tardbp mRNA is isoform 3 (Supplementary Table 4; NM_001003899.2), which contains two binding sites for miR-126a-5p in its 3’ untranslated region (UTR). We validated the ability of miR-126a-5p to silence Tardbp as well as several other predicted and MN-related transcripts after lentiviral delivery of miR-126 to primary MNs (Fig. 4d,e and Extended Data Fig. 7a,b). Notably, we validated that miR-126-5p regulation over TDP-43 mRNAs is conserved in humans (Extended Data Fig. 7c–f). Next, we confirmed the direct interaction between miR-126a-5p and TDP-43 mRNA using dual-luciferase reporter assay, which showed that the effect of miR-126-5p is abolished upon mutation of TDP-43 binding site (Fig. 4f,g). Furthermore, miR-126 overexpression in primary MNs led to a mild decrease in TDP-43 protein levels in whole-cell lysates, potentially due to the existence of additional TDP-43 mRNA isoforms in cell bodies with non-affinity or lower affinity to miR-126a-5p (Fig. 4h). Thus, our observations reveal a population of muscle-derived miRNAs with unique compartmentalization to NMJs, suggesting that at least part of these may participate in regulating presynaptic mRNA translation. Specifically, we identified the EV-localized and NMJ-localized miR-126a-5p as a potential suppressor of presynaptic TDP-43 translation.
Deregulation of miR-126 in patients with ALS and SOD1 models
Our data imply that miR-126a-5p is a potent muscle-derived repressor of TDP-43. Considering its unique NMJ compartmentalization, its enrichment in EVs and the observed effect of muscles over TDP-43 synthesis in NMJs, we sought to determine whether alterations in miR-126-5p levels could potentially increase the local synthesis of TDP-43 in NMJs of ALS models. Indeed, our previous studies revealed deregulation of miR-126a-5p in both SOD1G93A and TDP-43A315T models of ALS27,35.
We assessed the levels of miR-126-5p in ALS patient-derived serum EVs as an indication of its state in muscles, as also previously reported for other myomiRs38. We found an approximately threefold reduction in the relative abundance of miR-126-5p in patients with sALS compared to healthy donors (Fig. 4i). Due to the local accumulation of TDP-43 in peripheral nerves of SOD1 mice models (Fig. 1 and Extended Data Fig. 1), we examined the abundance of miR-126a-5p in the spinal cords and gastrocnemius muscles of SOD1G93A and SOD1G37R. In both mutant SOD1 models, the levels of miR-126a-5p were specifically reduced in the muscles of SOD1 mutants yet remained unaffected in their spinal cords (Fig. 4j,k and Extended Data Fig. 7g). Because we identified that miR-126a-5p is compartmentalized to NMJs, we further inspected if its low expression in mutant SOD1 muscles also reflects its presence in NMJs. Indeed, miR-126a-5p FISH in EDL NMJs of presymptomatic (postnatal day 60 (P60)) SOD1G93A mice and their littermates revealed a profound reduction, specifically in NMJs (Extended Data Fig. 7h,i). Overall, these data suggest a mechanism that local TDP-43 accumulation is suppressed by muscle-derived mir-126-5p, and this process is disrupted in SOD1 ALS.
Muscle EVs protect NMJs by limiting TDP-43 synthesis
To analyze the effect of muscle-derived EVs containing miR-126a-5p on NMJ integrity and functionality, we first adopted a previously described conditional knockdown (KD) method for Rab27a, a GTPase controlling the release of exosomes from cells39. We validated that Rab27a is expressed in skeletal muscles and is present in NMJs (Fig. 5a), and then we used compartmental microfluidic co-cultures to specifically knock down Rab27a in muscles using a doxycycline induction system (Fig. 5b). Western blot and NTA confirmed the induction and function of shRab27a in muscles (Fig. 5c–e). Co-culture analysis revealed an increase in newly synthesized TDP-43 at presynaptic axons upon Rab27a KD in muscles (Fig. 5f,g and Supplementary Fig. 6a,b). Given the central role of TDP-43 in local protein synthesis, we performed a similar experiment using OPP to label total protein synthesis in presynaptic axons and found an overall decrease in axonal protein synthesis (Fig. 5h,i and Supplementary Fig. 6c), resembling our observations in the TDP-43ΔNLS model13. Lastly, we assessed the impact of Rab27a KD on NMJ function and integrity. We detected impairment in NMJ function as measured by the percent of contracting innervated muscles (Fig. 5j). Additionally, co-cultures labeled for presynaptic and postsynaptic markers (NFH/BTX) revealed significant NMJ disruption and axon degeneration (Fig. 5k,l). These results were also replicated using the neutral sphingomyelinase inhibitor GW4869, known for its robustness in blocking exosome release40 (Fig. 5m–p and Supplementary Fig. 6d–f). Notably, GW4869 was demonstrated before to also block the clearance of pathological TDP-43 from cells via exosomes41. This, together with our attempt to overexpress TDP-43–eGFP in muscles in co-culture (Supplementary Fig. 7), and its absence in muscle EV fractions, confirms that the main source of axonal TDP-43 in the NMJ is local translation rather than its transmission from muscles. Hence, the inhibition of EV machinery in postsynaptic muscles reduces general presynaptic protein synthesis via increased local expression of axonal TDP-43. Furthermore, prolonged disruption of the EV machinery promoted NMJ dysfunction and degeneration, indicating a vital mode for muscle-derived EV secretion in NMJ maintenance.
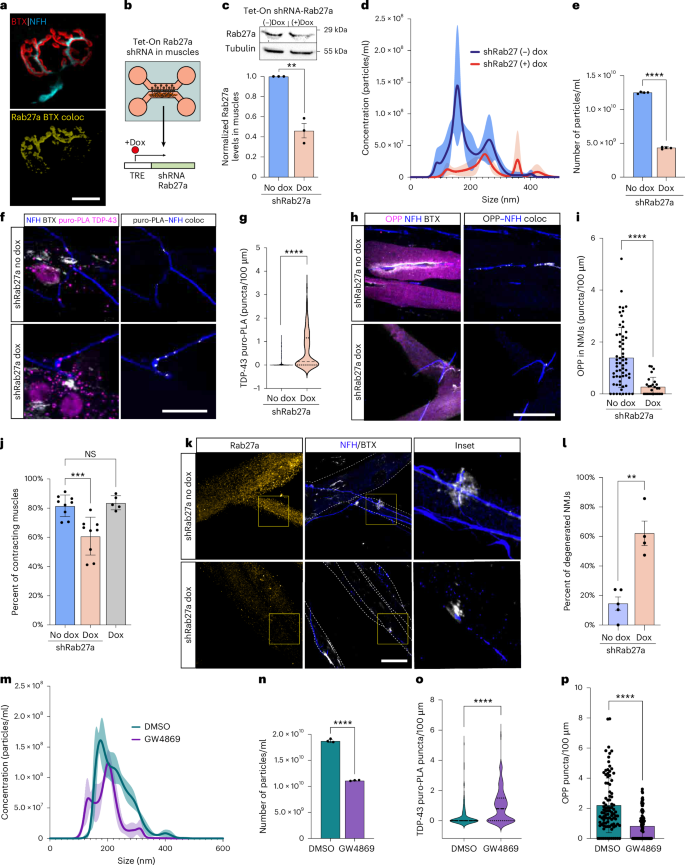
a, Representative images of Rab27a in NMJs. Top, NMJ markers; bottom, co-localization of Rab27a with BTX (yellow). Scale bar, 10 µm. b, Experimental setup in c and d. Tet-On shRNA-Rab27 vectors were transfected into primary muscles that were co-cultured in MFCs with primary MNs. At co-culture day 5, doxycycline was added to the muscle compartment. TRE, tetracycline responsive element. c, Representative western blot and quantificaton of Rab27a (29 kD) in primary muscles transfected with Tet-On shRNA-Rab27 +/− doxycycline. Tubulin was used as a loading control. n = 3 muscle cultures. **P < 0.0016. d, Representative NTA histograms comparing size distribution of EVs from Tet-On shRNA-Rab27a transfected primary muscles +/− doxycycline. e, NTA particle concentrations analysis in the EVs above. ****P = 2.43 × 10⁻⁷. n = 4 EV preparations from four muscle cultures. f,g, Representative images and quantification of TDP-43 puro-PLA in presynaptic axons in co-cultures with Tet-On shRNA-Rab27a-expressing muscles +/− doxycycline. TDP-43 puro-PLA–NFH co-localization is shown in gray (right). Scale bar, 10 µm. n = 151, 140 NMJs. ****P = 4.2 × 10⁻¹⁴. h,i, Representative images and quantification of OPP labeling in Tet-On shRNA-Rab27a co-cultures +/− doxycycline. OPP–NFH co-localization is shown in gray (right). Scale bar, 10 µm. n = 61, 25 NMJs ****P = 9.75 × 10⁻⁶. j, Percent of contracting innervated muscles in Tet-On shRNA-Rab27a co-cultures +/− doxycycline. n = 9, 9, 5 co-cultures. ***P = 0.0004, NS = 0.7059. k,l, Representative images and quantification of NMJ disruption in Tet-On shRNA-Rab27a co-cultures +/− doxycycline. Scale bar, 10 µm. n = 4 co-cultures. **P = 0.0010. m, Representative NTA histogram comparing size distribution of EVs from primary muscles cultured in the presence of 10 µM GW4869 or DMSO in the culture media. n, NTA particle concentration analysis in the EVs above. n = 3 EV preparations from three muscle cultures ****P = 1.28 × 10⁻⁶. o, Analysis of TDP-43 puro-PLA in presynaptic axons in DMSO-treated versus GW4860-treated (10 µM) co-cultures. n = 128, 131 NMJs ****P = 3.5 × 10⁻⁸. p, Analysis of OPP labeling in DMSO-treated versus GW4860-treated (10 µM) co-cultures. n = 94, 95 NMJs ****P = 4.3 × 10⁻¹⁰. For d,e,i,m,n,p, data are shown as the mean ± s.d., repeated in three independent repeats. For c,j,l, data are shown as the mean ± s.e.m., repeated in three independent repeats. For g,o data are shown in violin density plots with markings of first, median and third quartiles, repeated in three independent repeats. For b,c,e,g,i,l,n–p, two-tailed unpaired Student’s t-test. For j, one-way ANOVA with Holm–Sidak correction for multiple comparisons. coloc, co-localization; Dox, doxycycline; NS, not significant.
miR-126a-5p protects NMJs by repressing TDP-43 synthesis
To ensure that alteration in muscle-derived miR-126a-5p but not general EV secretion is vital for NMJ function, we repeated this set of experiments using an antisense oligonucleotide against miR-126a-5p (miR126i), which sequesters miR-126a-5p in stable heteroduplexes and effectively prevents its binding to endogenous targets42. First, the potency of miR126i was validated by transfecting it into primary muscles and performing RT–qPCR for TDP-43 mRNA after 5 days (Fig. 6a). Next, we introduced miR126i specifically to the neuromuscular compartments of co-culture (Fig. 6b; at 5 days in co-culture). Five days later, we found a marked increase in the density of TDP-43 in distal axons within the neuromuscular compartment (Fig. 6c,d). As in the shRab27a-treated and GW4869-treated co-cultures, miR126i led to a significant increase in newly synthesized TDP-43 in presynaptic axons (Fig. 6e,f and Supplementary Fig. 8a,b). This was associated with an increase in presynaptic pTDP-43 (Supplementary Fig. 8c,d), a decrease in overall presynaptic protein synthesis (Fig. 6g,h) and NMJ dysfunction and degeneration (Fig. 6i–k). Altogether, these observations indicate that muscle-derived EV-loaded miR-126a-5p maintains NMJ integrity and function. Because miR-126 may silence the translation of other presynaptic mRNAs, such as NRP1 (ref. 35), we aimed to investigate whether TDP-43 synthesis is essential for the NMJ disruption caused by miR-126-5p inhibition. To test this, we repeated the miR-126-5p inhibition experiment while simultaneously applying it with TDP-43 siRNAs, control siRNA or TDP-43 siRNAs alone. The inclusion of TDP-43 siRNAs in the axons completely prevented both the accumulation of axonal TDP-43 and the subsequent degeneration induced by miR-126 inhibition (Fig. 6l–o and Supplementary Fig. 8e), suggesting that, indeed, miR-126 acts upon TDP-43. Thus, the loss of miR-126-5p facilitates local translation and accumulation of TDP-43 in presynaptic axons, which is sufficient to drive axon degeneration.
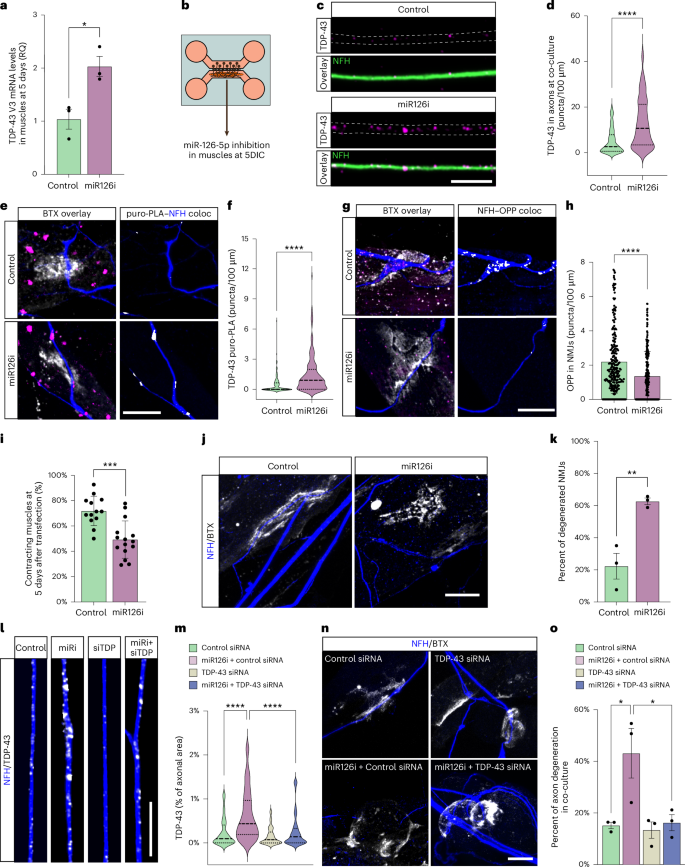
a, RT-qPCR for TDP-43 mRNA in primary muscles 5 days after miR126i treatment. GAPDH was used as loading control. RQ, relative quantification. n = 3 cultures *P = 0.0203. b, Illustration of experimental setup in c–k. Neuromuscular compartment in co-cultures was exclusively transfected at day 5 with miR126i. c,d, Representative images and analysis of TDP-43 density (puncta/100 µm) in axons within the neuromuscular compartment in control versus miR126i-treated co-cultures 5 days after transfection. Scale bar, 5 µm. n = 222, 216 axons. ****P < 1 × 10⁻¹⁵. e,f, Representative images and quantification of TDP-43 puro-PLA signal in presynaptic axons in control and miR126i-treated co-cultures. White indicates TDP-43 puro-PLA–NFH co-localization (right). Scale bar, 10 µm. n = 62, 80 NMJs. ****P = 3.39 × 10⁻¹³. g,h, Representative images and quantification of OPP labeling in control and miR126i-treated co-cultures. White indicates OPP–NFH co-localization (right). Scale bar, 10 µm. n = 259, 212 NMJs ****P = 1.12 × 10⁻⁷. i, Percent of contracting innervated muscles in control and miR126i-treated co-cultures. n = 13, 15 co-cultures. ***P = 0.00014. j,k, Representative image and quantification of NMJ disruption in control and miR126i-treated co-cultures. Scale bar, 10 µm. n = 13, 15 microfluidic co-cultures. **P = 0.0084. l,m, Representative images and quantification of axonal TDP-43 density in control-siRNA-treated or TDP-43-siRNA-treated co-cultures in presence/absence of miR126i. Scale bar, 10 µm. n = 96, 89, 70, 73 axons. Control siRNA versus miR126i+control siRNA: ****P = 4.15 × 10⁻¹⁰; miR126i+control siRNA versus miR126i+TDP-43 siRNA: ****P = 1.05 × 10⁻⁷. n, Representative images of NMJs in control-siRNA-treated or TDP-43-siRNA-treated co-cultures in presence/absence of miR126i. Scale bar, 10 µm. o, Percent of axon degeneration in co-cultures treated as described above. n = 3 co-cultures. Control siRNA versus miR126i+control siRNA: *P = 0.0296; miR126i+control siRNA versus miR126i+TDP-43 siRNA: *P = 0.0296. For h,I, data are shown as the mean ± s.d., repeated in three independent repeats. For a,k,o, data are shown as the mean ± s.e.m., repeated in three independent repeats. For d,f,m, data are shown in violin density plots with markings of first, median and third quartiles, repeated in three independent repeats. For a,d,f,h,i,k, two-tailed unpaired Student’s t-test. For m,o, one-way ANOVA with Holm–Sidak correction for multiple comparisons. In e–o, miR126i or siRNA was administered exclusively to the neuromuscular compartment. coloc, co-localization.
miR-126 protects motor function in SOD1G93A mice via TDP-43
Overexpression of miR-126 in SOD1G93A muscles can delay NMJ disruption and improve motor function in vivo35. miR-126a-5p levels decrease in axons of SOD1 and TDP-43 mutants27. Therefore, we used a lentivirus to overexpress miR-126 in primary MNs (Extended Data Fig. 8a–c) and in co-cultures of MNs expressing SOD1 (Fig. 7a and Extended Data Fig. 8d). Co-culture analysis of the percent of contracting muscles revealed NMJ dysfunction in this ALS model, which was prevented by the overexpression of miR-126 (Fig. 7b). To test the effect of mir-126a-5p in vivo, we introduced PHP.eB adeno-associated virus (AAV) particles expressing miR-126–GFP to the central nervous system via retro-orbital injections and to one gastrocnemius muscle at a single timepoint to presymptomatic (P60) SOD1G93A and littermate mice. As a control, we used GFP PHP.eB AAV particles (Fig. 7c and Extended Data Fig. 9a–c). CatWalk gait analysis performed at two timepoints of the disease—symptomatic and late symptomatic (P90 and P130, respectively)—revealed complete preservation of motor functions in the miR-126-injected SOD1G93A mice as indicated by their stand duration, run duration and the percent of base of support on four limbs (Fig. 7d and Extended Data Fig. 9d,e). Furthermore, visual assessment of the hindlimb splay reflex showed no defects in this ability in the miR-126-injected SOD1G93A mice versus the GFP-injected ones (Extended Data Fig. 9f,g). Notably, quantitative three-dimensional co-localization analysis in the NMJs of these mice at their endstage showed a marked reduction in pTDP-43 in presynaptic axons within the still intact NMJs (Fig. 7e,f). Notwithstanding these results, tracking the weight and survival of these mice for longer periods did not unveil a positive outcome over these parameters (Extended Data Fig. 9h,i). Analyzing the expression of miR-126a-5p in the injected gastrocnemius at the endstage of these mice revealed that the overexpression was not sufficient to overcome miR-126-5p deficiency (Fig. 7g). Altogether, these observations provide in vivo proof of concept that miR-126 targets TDP-43 accumulation in SOD1G93A axons and NMJs. However, achieving survival effect likely requires more consistent and robust infection.
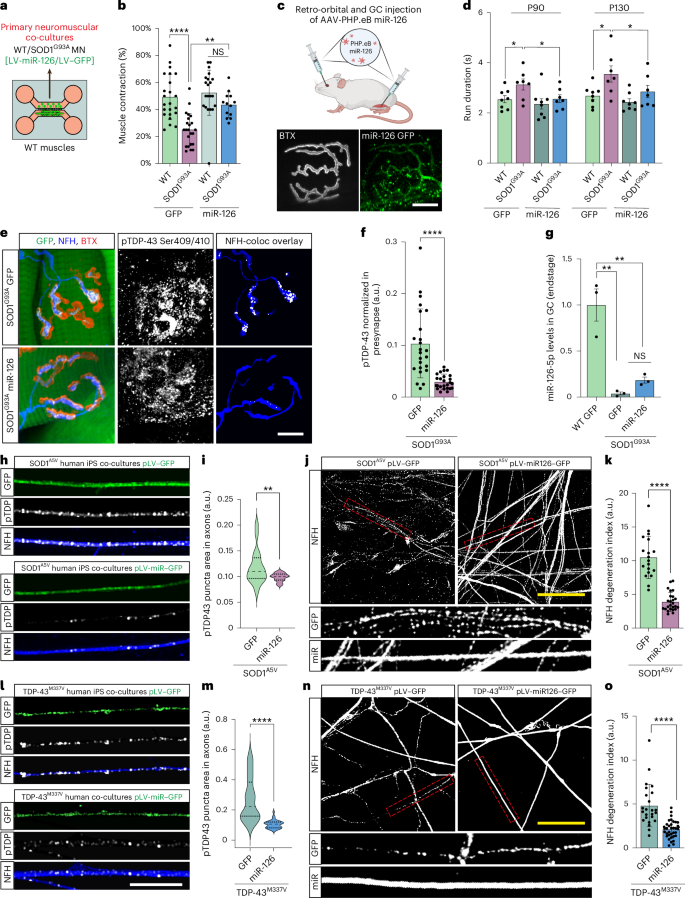
a, Illustration of experimental setup in b. GFP-infected or miR-126–GFP-infected primary MNs were co-cultured with primary skeletal muscles. b, Percent of contracting muscles at tenth day of co-culture. n = 23, 23, 21, 13 co-cultures, NS = 0.3070, **P = 0.0026, ****P = 1.54 × 10⁻⁶, NS = 0.307. c, Illustration of experimental setup for d–g. SOD1G93A and littermate mice (P60) were injected with PHP.eB miR126–GFP or GFP-only AAV retro-orbitally and to the right gastrocnemius muscle. Bottom, representative image of an NMJ in the left gastrocnemius muscle of littermate miR126–GFP-injected mouse. Scale bar, 10 µm. d, Run duration analysis for GFP-infected and miR126–GFP-infected WT and SOD1G93A mice at P90 and P130. n = 8 mice in each group. WT+GFP versus SOD1G93A+GFP *P = 0.0193, SOD1G93A+GFP versus SOD1G93A+miR126 *P = 0.0287; P130: WT+GFP versus SOD1G93A+GFP *P = 0.0172, SOD1G93A+GFP versus SOD1G93A+miR126 *P = 0.0359. e,f, Representative images and quantification of pTDP-43 in presynaptic axons in NMJs of GFP-infected and miR-126–GFP-infected SOD1G93A mice at disease endstage. White indicates pTDP-43–NFH three-dimensional co-localization (rightmost). Scale bar, 10 µm. n = 24, 31 NMJs. ****P = 2 × 10⁻⁶. g, miR-126a-5p RT–qPCR in right gastrocnemius muscles of GFP-treated and miR-126-treated SOD1G93A compared to littermate–GFP-treated muscles. **P = 0.0028, NS = 0.3570. h,i, Representative images and analysis of pTDP-43 density in distal axons of pLV-hSyn–GFP-infected or pLV-hSyn-miR126–GFP-infected SOD1A5V iPSC–MN co-cultures with SOD1A5V iPSC-muscles expressing similar plasmids under CMV promoter. Scale bar, 5 µm. n = 18, 24 images. **P = 0.0082. j,k, Representative images and analysis of axonal degeneration index in the neuromuscular compartment of SOD1A5V co-cultures expressing the above vectors. Scale bar, 20 µm. n = 19, 25 ****P = 6 × 10⁻¹². l,m, Representative images and analysis of pTDP-43 density in distal axons TDP-43M337V iPSC-derived MN-muscle co-cultures expressing the same vectors. Scale bar, 5 µm. n = 26, 36 images. ****P = 7.88 × 10⁻⁹. n,o, Representative images and analysis of axonal degeneration index within the distal compartment of above TDP-43M337V co-cultures. Scale bar, 20 µm. n = 24, 36 ****P = 1.16 × 10⁻⁷. For f,j,o, data are shown as the mean ± s.d., repeated in three mice per genotype or three independent repeats. For b,d,g, data are shown as the mean ± s.e.m., repeated in three mice per genotype. For i,m, data are shown in violin density plots with markings of first, median and third quartiles, repeated in three independent repeats. For d (P90), multiple unpaired one-tailed Student’s t-tests. For f,g,i,k,m,o, two-tailed unpaired Student’s t-test. For b,d (P130), one-way ANOVA with Holm–Sidak correction. LV, lentivirus; NS, not significant; s, seconds; WT, wild-type.
miR-126 prevents TDP-43 toxicity in human ALS models
Human iPSC-derived models might offer potential advantages over rodent models for ALS research, providing a more accurate representation of human disease mechanisms and phenotypes that are absent in mice. To better replicate the human neuromuscular environment, we used a human motor unit model of iPSC-derived neuromuscular co-cultures growing in a compartmental chamber. The effect of miR-126 on axonal TDP-43 accumulation and degeneration was tested on iPSC co-cultures carrying SOD1A5V and TDP-43M337V mutations that exhibit these pathologies (Extended Data Fig. 10a–c). iPSC-derived MNs and muscle cells were infected with lentiviral vectors expressing either GFP or miR-126–GFP (Extended Data Fig. 10d,e). Expression of miR-126 significantly reduced pTDP-43 accumulation along axons and protected against degeneration in the ALS mutant co-cultures (Fig. 7h–o). Together, these findings identify miR-126 as a suppressor of axonal TDP-43 accumulation also in human models and highlight its potential role for mitigating TDP-43 pathology and associated neurodegeneration in ALS.
In summary, our study identifies miR-126-5p as a key limiter of axonal TDP-43 accumulation and its toxic effects in ALS. We demonstrate that miR-126-5p controls local protein synthesis at NMJs, which is crucial for its maintenance. Disruption of this mechanism leads to NMJ degeneration in ALS. These findings highlight the role of muscle-derived EV-loaded miRNAs in NMJ function and suggest that modulating miR-126-5p expression could offer a potential therapeutic strategy to prevent NMJ degeneration in ALS.
Discussion
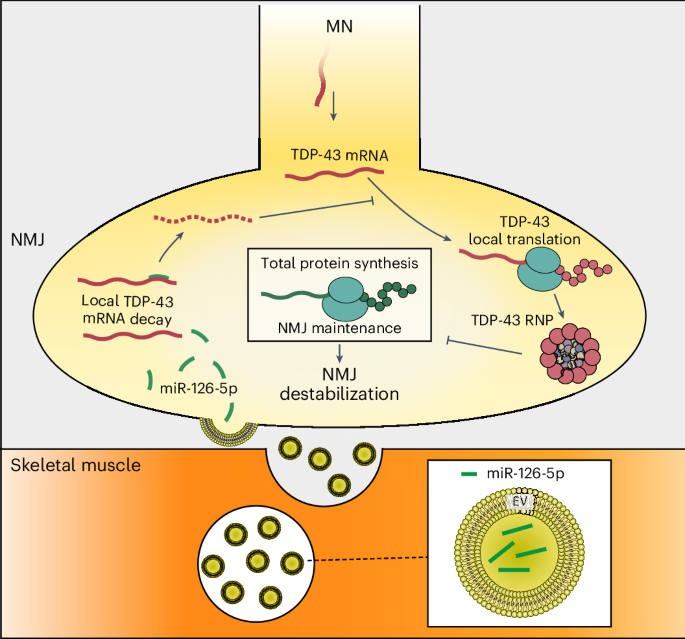
Despite the crucial role of TDP-43 in ALS pathology, the way it accumulates along axons and NMJs was unknown. Here we establish the basis for the presence of TDP-43 pathology in peripheral nerves and NMJs in ALS SOD1 mutants. We uncover a novel communication pathway between muscles and axons that governs the accumulation of presynaptic TDP-43 and regulates NMJ integrity. Intriguingly, we found that this accumulation is induced by the local synthesis of TDP-43 at NMJs, a process that is regularly restrained by miR-126a-5p EVs derived from muscles (Fig. 8). These observations align with our previous identification of a novel ALS mechanism, wherein TDP-43 accumulates within axons, sequesters RNA and inhibits local protein synthesis. This process triggers mitochondrial dysfunction, disrupts NMJs and leads to degeneration13.
Local protein synthesis in presynaptic motor axons is a key process essential for the function, maintenance and survival of NMJs. To function properly, local protein synthesis depends on mRNA availability, which is controlled by anterograde axonal transport and local ribonucleoproteins. We identified that muscle-derived miR-126a-5p is enriched in NMJs and regulates the translation of TDP-43 mRNA in presynaptic axons through EVs. Deregulation of muscle-derived miR-126a-5p releases the inhibition of TDP-43 mRNA, leading to its local translation and accumulation in the presynaptic axon, thereby facilitating NMJ disruption via TDP-43-mediated local translation arrest.
This newly discovered communication pathway profoundly influences NMJ stability at individual synapses, providing crucial insights into how an NMJ independently adjusts its protein profile in response to changing conditions. This supports the notion that TDP-43 condensates along axons can govern spatiotemporal signaling and metabolic processes43,44,45,46. Such regulation relies on precise control over local protein synthesis, enabling neurons to respond spatially restricted and time sensitive to environmental changes while maintaining axon and synapse homeostasis47,48. Anomalies within axonal TDP-43 condensates make neurons more susceptible to local stress, affecting their ability to regenerate, ultimately culminating in neurodegeneration. Hence, we propose this as a dynamic process regulated at the single-synapse level through the localized synthesis of TDP-43.
Our observations point to a local accumulation of TDP-43 in NMJs and peripheral nerves of SOD1 mice without apparent cytoplasmic mislocalization in spinal MNs. Indeed, we identified local deregulation of miR-126a-5p in SOD1 models in muscles and specifically in its NMJ localization, whereas its expression remains unchanged in the spinal cord.
Still, we detected reduced miR-126-5p levels in blood serum EVs of a small cohort of patients with sALS. Skeletal muscle-derived miRNAs were previously recorded in circulating exosomes38,49, suggesting that the observed reduction in serum miR-126-5p in patients reflects the expression of this miRNA in skeletal muscles. Notably, miR-126a-5p expression might mirror the condition of TDP-43 accumulation in tissues, thus suggesting the involvement of miR-126a-5p in the pathogenesis of additional non-SOD1 ALS cases. Future studies in larger patient groups will have to validate this finding and may serve as a basis for using miR-126a-5p as a biomarker.
Local synthesis of TDP-43 in motor axons and NMJs
In this study, we report, to our knowledge for the first time, that TDP-43 mRNA is distributed into axons where it can be locally translated. TDP-43 is a major regulator of the axonal transcriptome, primarily by binding and shuttling mRNAs, including its own mRNA10,11,12,50,51,52. We previously identified Elavl2 (also known as HuB) transcripts in MN axons, of which expression is altered upon SOD1G93A and TDP-43A315T overexpression27. Interestingly, Elavl2 mRNA is also a predicted target of miR-126a-5p. Recently, the RNA-binding protein (RBP) Khsrp was reported to locally translate in axons upon nerve injury and, thus, to regulate local RNA pools53. Additionally, the same report indicated that the levels of several other RBPs increase upon injury, suggesting that local translation is a common origin of several axonal RBPs. Moreover, transcriptome analysis of microdissected ventral roots highlighted the ribonucleoprotein complex mRNAs group as one of the axonal-enriched cellular components mRNA54. Hence, the discovery of TDP-43 local translation may mark only a drop within a larger pool of axonal RBPs and RNA regulators awaiting characterization.
Synaptic miRNA-loaded EVs as a new mode of local synthesis control
Previous studies, including ours, highlighted the crucial role of local protein synthesis in preserving synaptic function, integrity, plasticity and mitochondrial health13,55,56,57. This process relies on mRNA continuously moving into axons and synapses20,58,59,60. However, understanding of how specific transcripts are precisely translated or silenced at individual synapses with high spatiotemporal precision remains limited. Previous studies established glia–axon communication through miRNA-loaded and ribosome-loaded exosomes that promotes neuronal growth and response to injury61,62,63.
The synaptic transmission of miR-126a-5p, which limits the presynaptic synthesis of TDP-43, represents a new mode of local communication between postsynaptic muscles and presynaptic axons in the form of RNA-loaded EVs. However, several more miRNAs are potentially also compartmentalized in postsynaptic muscle EVs. Micro RNAs are master regulators of translation, having the potency to target and silence tens to hundreds of transcripts64. With respect to the axonal transcriptome and the existence of axonal-specific 3’ UTR variants65,66,67, our findings suggest that muscle-derived miRNAs can coordinate complex synaptic processes. Such a mode of local regulation would explain how MNs can respond precisely and timely to changes within each of its numerous presynaptic terminals while avoiding global transcriptome modifications. Indeed, miR-126-5p can silence several ALS-related genes associated with key metabolic and signaling pathways essential for spatiotemporal neuronal homeostasis (Extended Data Fig. 7b and Supplementary Table 3), whereas alterations in these genes can propagate neurodegeneration. Moreover, previous studies revealed that miR-126-5p regulates semaphorins, neuropilins35,68 and caspase-3 (ref. 69), which, in combination with our current observations, suggests that, like neurotrophins, miR-126-5p routine transmission is neuroprotective, whereas disruption in its transmission, whether controlled or pathological, may orchestrate synapse destabilization or elimination by alleviating transcript inhibition of several transcripts and controlling various synaptic processes (that is, TDP-43 mitochondria and energy homeostasis, neuropilin 1 cytoskeleton, etc.). Notwithstanding, blocking TDP-43 synthesis in axons using siRNA halts the neurodegeneration in co-cultures treated with miR-126-5p inhibitor, suggesting that accumulation of axonal TDP-43 alone is sufficient to drive NMJ disruption and axon degeneration. Future research will focus more in depth on the multilevel regulation of synaptic miR-126a-5p as well as establish the function of other miRNAs in NMJs.
Limitations and future directions
Several limitations must be acknowledged. First, the cohort size of patients with ALS, and specifically of mutant SOD1 biopsies, was limited in demonstrating both the decrease in miR-126a-5p exosomes and the accumulation of axonal TDP-43 pathology. Larger patient cohorts are needed to validate these findings and better understand the variability in miR-126 expression and its impact on NMJ integrity. Additionally, although we identified the pathological accumulation of TDP-43 at the presynapse, TDP-43 is accumulated at the NMJs and also in other neighboring cells, such as Schwann cells. This process remains unexplored. Future studies should investigate the biology and role of TDP-43 in these non-neuronal cells and their potential involvement in NMJ pathology. Another limitation lies in the mode of miR-126a-5p delivery used in our study. Although we demonstrated neuroprotective effects using overexpression strategies, developing clinically viable delivery methods for miR-126a-5p in vivo remains a challenge. Optimizing targeted delivery systems, such as modified exosomes or nanoparticle-based carriers, could enhance the translational potential of this therapeutic approach.
Altogether, we demonstrate the contribution of localized transcellular delivery from muscle to neuron of miR-126-5p to the accumulation of axonal and presynaptic TDP-43 in ALS. This discovery strengthens previous studies underlining the physiological and pathogenic role of early TDP-43 accumulation in peripheral nerves to the progression of ALS and opens new avenues for both understanding ALS disease etiology and therapy development. Our results implicate EV-loaded miRNAs as central players in the maintenance of NMJ integrity, laying the foundation for further exploration of exosome-mediated intercellular communication in human physiology.
Methods
This research complies with all relevant ethical regulations as detailed in the relevant sections below.
Human muscle biopsy for intramuscular nerve staining and human obturator nerve
Intramuscular nerve staining was performed on muscle biopsies from a patient with SOD1 ALS, a patient with sALS and a male non-ALS patient (Supplementary Table 5). Obturator nerve biopsies were obtained from a patient with SOD1 ALS, a patient with sALS and a non-ALS patient (Supplementary Table 5). The local ethics committee of the San Raffaele Hospital on human experimentation approved the study protocol (RF-2019-12369320); obturator nerves were collected and stored in our tissue bank, after informed consent, both for patients with ALS and for controls. All clinical and muscle biopsy materials used in this study were obtained with written informed consent during 2016–2020 for diagnostic purposes followed by research application, approved by the institutional review board. Biceps skeletal muscle samples were excised via open biopsies, and pathological analysis was performed at the Hacettepe University School of Medicine, Neuromuscular Diseases Research Laboratory, in Ankara, Turkey (Hacettepe University ethics committee approval no. GO20/177, 11/02/2020) and at the neuromuscular pathology laboratory at Sheba Medical Center in Ramat-Gan, Israel. All procedures involving human participants were approved by the Sheba Medical Center institutional review board, with approval numbers 0004871-18, 0001680-7 and 0001681-7, in accordance with the Declaration of Helsinki. Patients with ALS and non-ALS patients were all Caucasian males, aged 26–66 years (48.33 ± 13.12). Patients with ALS were diagnosed with clinically definite or probable ALS according to El Escorial criteria70. Non-ALS control muscles included a variation of findings, which were consistent with a diagnosis of normal muscle, severe, chronic ongoing denervation and reinnervation due to spinal stenosis.
Frozen muscle biopsies were cryosectioned to 10-µm-thick slices, mounted onto slides and air dried for 30 minutes at room temperature. Sections were washed in PBS, fixed in 4% paraformaldehyde (PFA) for 20 minutes, permeabilized with 0.1% Triton and blocked with 5% goat serum (The Jackson Laboratory) and 1 mg ml−1 BSA (Amresco). Sections were then incubated with appropriate antibodies overnight at 4 °C in blocking solution: rabbit anti-phosphorylated TDP-43 (1:1,000; Proteintech) and chicken anti-NFH (1:1,000; Abcam). Sections were washed again and incubated for 2 hours with secondary antibodies (1:1,000; The Jackson Laboratory and Thermo Fisher Scientific), washed and mounted with ProLong Gold (Life Technologies).
For obturator nerve biopsies, the anterior motor branch of the obturator nerve was sampled and processed in all patients according to our standardized protocols15,71
Experimental animals
SOD1G93A−ChAT::tdTomato and LMChAT::tdTomato embryos were obtained by mating ChAT::ROSAtdTomato females with SOD1G93A males. Embryos were genotyped to distinguish wild-type from SOD1G93A embryos. The colony was maintained by breeding males and females within the colony. HB9−GFP (The Jackson Laboratory, stock no. 005029) mice were originally obtained from The Jackson Laboratory. The colony was maintained by breeding with ICR mice (Institute of Animal Science, Harlan). B6SJL.SOD1G93A (The Jackson Laboratory, stock no, 002726) colonies were maintained by breeding with C57BL/6J mice. Genotyping was performed using PCR (Kapa Biosystems), and DNA samples were generated from ear or tail tissue biopsies. B6SJK.SOD1G93A and littermate males were used to characterize TDP-43 pathology. For the in vivo miR-126 and GFP PHP-eB AAV injections in B6SJK.SOD1G93A and littermates, four female and three male mice of B6SJK.SOD1G93A and five female and three male littermate mice were used. All animal experiments were approved and supervised by the Animal Ethics Committee of Tel Aviv University. Colonies of LoxSOD1G37R mice (The Jackson Laboratory, stock no. 016149) harboring a floxed transgene comprising human SOD1 gene bearing G37R mutation72,73 were maintained by breeding heterozygous loxSOD1G37R males with females with pure C57BL/6J background to eliminate confounding genetic influences. LoxSOD1G37R and littermates of both sexes were used to characterize TDP-43 pathology. B6.SOD1G93A (The Jackson Laboratory, stock no. 004435) colonies were maintained by breeding with female C57BL/6J mice. Mice were genotyped by PCR of DNA extracted from a tail biopsy. B6.SOD1G93A and littermate males were used to characterize TDP-43 pathology. All animal procedures were approved by the Institutional Animal Care and Use Committee of Ben-Gurion University of the Negev, in compliance with Israel’s Animal Welfare Act (1994) and the National Institutes of Health (NIH) Guide for the Care and Use of Laboratory Animals (National Research Council, 2011). The animal facility is approved by the US Office of Laboratory Animal Welfare (assurance no. A5060-01) and is fully accredited by the Association for Assessment and Accreditation of Laboratory Animal Care International.
Differentiation of iPSCs into functional MNs, myotubes and neuromuscular co-culture
SOD1A5V and TDP-43M337V iPSC lines used in this study were obtained from Michael Ward (NIH) and the iPSC Neurodegenerative Disease Initiative. The use of these lines was approved by the institutional ethics committee of Tel Aviv University (approval no. 0001160). All lines were derived with informed donor consent under NIH protocols and in accordance with the Declaration of Helsinki. iPSC colony maintenance and differentiation into MNs was performed as previously described13,74. In brief, MN transcription factor cassette including the transcription factors islet 1 (ISL1) and LIM homeobox 3 (LHX3) along with NGN2 were integrated into a safe harbor locus in iPSCs under a doxycycline-inducible promoter74.
Skeletal myotube differentiation was performed as follows. Direct myogenic conversion of human iPSCs was performed by transfection of iPSCs using a doxycycline-inducible MYOD1-shOct4 cassette as described, and this cassette was a gift from Michael Ward (Addgene plasmid no. 182309; http://n2t.net/addgene:182309; RRID: Addgene_182309). iPSC clones were cultured in six-well plates coated with Matrigel (Corning, 356234), grown in mTesr1 medium (STEMCELL Technologies, 85850) and passaged with mTesr1 medium containing 10 μM Rho-kinase inhibitor (RI) (Sigma-Aldrich, Y0503) for 1 day after passaging. Culture media were refreshed daily until colonies reached 80% confluence. For differentiation, 300,000 iPSCs were plated in a 35-mm dish coated with Matrigel (1:100) in mTesr1-RI medium. On the following day, media were replaced with induction medium supplement containing DMEM/F12 (Gibco, 31330038), 1× sodium pyruvate (Gibco, 11360070), 1% NEAA (Biological Industries, 01-340-1B) with 10 μM RI, 0.1 mM β-mercaptoethanol, 2 μg ml−1 doxycycline (Sigma-Aldrich, D9891) and 10 μg ml−1 recombinant human insulin (R&D Systems, 11376497001). This induction medium is replaced every day for two consecutive days, and then half-media volume is replaced for every alternate day until day 6. After the first 2 days of differentiation, RI is removed from the induction medium. On day 7, fresh induction medium containing 3 μM CHIR99021 is added for 48 hours along with induction medium. Followed by CHIR treatment, induction medium is replaced by maturation media containing the following: Neurobasal A medium (Gibco, 10888022), 1× B27 Plus supplement (Gibco, A3582801), 1% NEAA (Biological Industries, 01-340-1B), 1% Optimal-Culture-One supplement (Gibco, A3320201), 0.1 µg ml−1 Agrin (R&D Systems, 6624-AG-050), 0.05 µg ml−1 Sonic Hedgehog (PeproTech, 100-45), 2 μg ml−1 doxycycline, 0.01 µg ml−1 IGF1 (PeproTech, 100-11), 0.05 μg ml−1 Laminin and 200 µM ascorbic acid (Thomas Scientific, C988E92). This maturation medium is replaced every day for two consecutive days, and then half-media volume is replaced with fresh media every 2–3 days for 1 month.
Human MN–myotube co-culture in MFCs
Day 2 differentiated myotubes were cultured in the distal part of MFCs coated with ECM (1:100) and maintained with induction medium as mentioned above.
For MN cultures, iPSC clones were cultured in six-well plates coated with Matrigel (Corning, 356234), grown in mTesr1 medium (STEMCELL Technologies, 85850) and passaged with mTesr1 medium containing 10 μM RI (Sigma-Aldrich, Y0503) for 1 day after passaging. Culture media were refreshed daily until colonies reached 80% confluence. Doxycyline-induced differentiation into lower MNs was performed as previously described with minor modifications. In total, 300,000 iPSCs were plated in a 35-mm dish in mTesr1-RI medium. On the following day, media were replaced with induction medium supplement containing DMEM/F12 (Gibco, 31330038), 1% N-2 Supplement (Gibco, 17502048), 1% NEAA (Biological Industries, 01-340-1B) and 1% GlutaMAX (Gibco, 35050038) with 10 μM RI, 2 μg ml−1 doxycycline (Sigma-Aldrich, D9891) and 0.2 μM Compound E (Merck, 565790).
After day 9, day 2 differentiated MN cells (48 hours after doxycycline induction) were resuspended with Accutase (Sigma-Aldrich, SCR005) and re-plated in the proximal compartment of MFCs at a concentration of 50,000 MNs per MFC. Prior to plating, MFCs were coated overnight with 0.1 mg ml−1 PDL (Sigma-Aldrich, P6407) in PBS and 15 μg ml−1 Laminin (Sigma-Aldrich, L2020) for 4 hours on the following day. To prevent outgrowth of mitotically active cells, 40 μM BrdU (Sigma-Aldrich, B9285) was added to the medium during the first 24 hours after plating. At the fourth day, cells were treated with MM medium containing the following: Neurobasal medium (Gibco, 21103049), 1% B27 (Gibco, 17504044), 1% N-2, 1% NEAA, 1% Optimal-Culture-One supplement (Gibco, A3320201), 1 µg ml−1 Laminin, 20 ng ml−1 BDNF, 20 ng ml−1 GDNF and 10 ng ml−1 NT3 (Alomone Labs, N-260). Medium was refreshed every 3 days.
MN crossing into the myotube compartment was observed usually within 3–4 days after culturing. Throughout the co-culture condition, separate media components for MNs and myotubes were followed as aforementioned. For imaging, chambers were fixed using 4% PFA for 15 minutes and then processed for immunofluorescence protocol.
Automated image analyses using CellProfiler
Along with ImageJ, CellProfiler 4 was used to build an unbiased semi-automated image analysis to perform quantitation of percentage of degenerated neurons (neurofilament heavy chain (NFH) staining) and amount of axonal pTDP-43 in MN–myotube co-culture of isogenic and ALS lines. Deconvolution of z-stacked images is performed using ImageJ where each slice from each fluorescent channel is exported as a TIFF file. To begin quantification, the images to be quantified must first be loaded into the input panel. For both NFH degeneration and axonal pTDP-43 analysis, maximum intensity projections of NFH and pTDP-43 channel images were loaded into the pipeline module. Once an image has been loaded into the pipeline, the image will be converted into separate grayscale images representing each of the color channels using the ‘ColorToGray’ module. To enhance neurite particles within images, we use the ‘EnhanceOrSuppressFeatures’ module to apply filtering and opt to enhance the identification of neurites. To identify ‘intact NFH’, we use the ‘IdentifyPrimaryObjects’ module using the grayscale maximum intensity of NFH channel image as the input image. Within the ‘IdentifyPrimaryObjects’ module, we selected ‘Global Otsu Thresholding’ using two-class thresholding, set typical diameter of objects between 10 and 120 pixel units and used both ‘intensity’ and ‘shape’ features to differentiate clumped objects. To identify ‘degenerated NFH’ objects from the same NFH channel, we used the same method of ‘IdentifyPrimaryObjects’ module of same thresholding and set the typical diameter of objects between 3 and 8 pixel units. For axonal pTDP-43 quantification, a separate image analysis pipeline was generated with additional modules. In addition to the initial steps of ‘ColorToGray’ module and ‘IdentifyPrimaryObjects’ module to identify NFH and pTDP-43 from their image channels, additional modules such as ‘RelateObjects’ and ‘MaskObjects’ were used to identify axonal pTDP-43 co-localization. To identify the individual pTDP-43 particles within each NFH image, we used ‘NFH’ objects as the parent objects and ‘pTDP-43’ objects as the child objects within the module. Ultimately, this allows for the counting of ‘pTDP43 objects’ per ‘NFH objects’. Lastly, all the data collected were exported into separate spreadsheets using the ‘ExportToSpreadsheet’ module that is provided with counts of particles per image in .csv format. From this, the ratio of particle count of degenerated NFH to intact NFH is used to calculate the percent of degenerated axons in each co-culture, and the ratio of number of pTDP43 objects present in each NFH object is used to calculate the amount of axonal pTDP-43.
Immunofluorescent staining of cryosections
Sciatic nerve and spinal cord sections were prepared from fixating respective tissues in 4% PFA for 16 hours at 4 °C and then incubated with 20% sucrose for 16 hours at 4 °C and cryo-embedding in Tissue-Tek OCT compound (SciGen). Tissues were then cryosectioned to 10-µm-thick slices and washed with PBS, followed by permeabilization and blocking in solution containing 10% goat serum, 1 mg ml−1 BSA and 0.1% Triton in PBS for 1 hour. Later, the sections were incubated overnight at 4 °C with primary antibodies: rabbit anti-TDP-43 (1:2,000; Proteintech, 10782-2-AP), rabbit anti-pTDP-43 (1:2,000, Proteintech, 22309-1-AP), chicken anti-NFH (1:500; Abcam, ab72996) and mouse anti-S100 B (1:300; Sigma-Aldrich, S2532). This was followed by 2-hour incubation at room temperature with secondary antibodies: goat anti-chicken 405 (1:500; Abcam, ab175675), goat anti-chicken 594 (1:500; Thermo Fisher Scientific, A-11042), goat anti-mouse 488 (1:500; Abcam, ab150113) and goat anti-rabbit (1:500; Abcam, ab150083). Samples were washed with PBS and mounted with ProLong Gold (Life Technologies).
Immunofluorescent labeling of cell cultures
Cell cultures (either mass cultures or in MFCs) were performed as previously described. In brief, cultures were fixed for 15 minutes with 4% PFA at room temperature, followed by consecutive PBS washes. For co-cultures, labeling of postsynaptic AChRs was performed prior to permeabilization by incubation with either BTX-ATTO-633 or TMR-BTX (0.5–1 mg ml−1 in PBS) for 15 minutes at room temperature. After PBS wash, cultures were permeabilized for 30 minutes at room temperature with 0.1% Triton X-100 in PBS or with permeabilization/blocking solution (0.1% Triton X-100, 5% goat serum and 1 mg ml−1 BSA in PBS) for 30 minutes. After PBS rinse, cultures were incubated for 1 hour with blocking solution (5% goat serum and 1 mg ml−1 BSA in PBS), following overnight incubation at 4 °C with primary antibodies in blocking solution. After PBS rinse, cultures were incubated for 2 hours at room temperature with secondary antibodies in blocking solution, followed by several PBS washes.
Samples were mounted with ProLong Gold antifade reagent (±DAPI; Molecular Probes). In some experiments, samples were labeled with Phalloidin-FITC (1:250) after permeabilization (and other relevant labeling procedures) to mark axons instead of immunofluorescent labeling. Primary antibodies used included: rabbit anti-TDP-43 (1:2,000; Proteintech, 10782-2-AP), rabbit anti-pTDP-43 (1:2,000; Proteintech, 22309-1-AP), chicken anti-NFH (1:500; Abcam, ab72996), rabbit anti-NFH (1:1,000; Sigma-Aldrich, N4142), rabbit anti-Rab27a (1:200; Proteintech, 17817-1-AP), chicken anti-GFP (1:500; Abcam, ab13970), rabbit anti-Ago2 (1:500; Abcam, ab32381) and mouse anti-Titin (1:500; DSHB, 9D10). Secondary antibodies used included: goat anti-chicken 405 (1:1,000; Abcam, ab175675), goat anti-rabbit 405 (1:500; Abcam, ab175654), goat anti-chicken 488 (1:1,000; Abcam, ab150173), goat anti-rabbit 594 (1:1,000; The Jackson Laboratory, 111-585-144), goat anti-rabbit 488 (1:1,000; Invitrogen, A11034), goat anti-mouse 488 (1:500; Abcam, ab150113), goat anti-mouse 594 (1:1,000; Invitrogen, A11032) and goat anti-rabbit 647 (1:500; Abcam, ab150083).
Whole-mount NMJ staining
Gastrocnemius, tibialis anterior, EDL and soleus muscles were dissected from adult mice, cleared from connective tissue and kept in 4% PFA until use. Muscles were washed in PBS, dissected into small muscle bundles (approximately 200 fibers per bundle) and stained for postsynaptic AChR with αBTX-ATTO-633 (Alomone Labs) or αBTX-TMR-594 (Sigma-Aldrich) at 1 µg ml−1 for 20 minutes at room temperature while rocking. Next, muscles were permeabilized with ice-cold MeOH at −20 °C for 5 minutes, blocked and further permeabilized with 20 mg ml−1 BSA and 0.4% Triton for 1 hour. Muscle preparations were agitated overnight at room temperature with appropriate antibodies: rabbit anti-TDP-43 (1:2,000; Proteintech, 10782-2-AP), rabbit anti-pTDP-43 (1:2,000; Proteintech, 22309-1-AP), chicken anti-NFH (1:500; Abcam, ab72996), rabbit anti-Rab27a (1:200; Proteintech, 17817-1-AP), mouse anti-Synapsin I (1:500; Millipore, AB1543), guinea pig anti-Synaptophysin (1:300; SYSY, 101004), CD63 (1:200; Santa Cruz Biotechnology, H-193, sc-15363), rabbit anti-CD9 (1:100; Abcam, ab92726), mouse anti-CD81 (1:100; Abcam, ab79559), rabbit anti-CHMP2a (1:500; Proteintech, 10477-1-AP) and chicken anti-GFP (1:500; Abcam, ab13970). This was followed by 4-hour incubation at room temperature with secondary antibodies: goat anti-chicken 405 (1:500; Abcam, ab175675), goat anti-chicken 488 (1:500; Abcam, ab150173), goat anti-mouse 488 (1:500; Abcam, ab150113), goat anti-rabbit 647 (1:500; Abcam, ab150083) and goat anti-guinea pig-488 (1:500; Abcam, ab150185). In case required, DAPI was diluted within PBS used for the secondary washes, incubated with the samples for 5 minutes and then washed. Finally, muscle bundles were cut and spread into thinner layers and mounted with VECTASHIELD (Vector Laboratories). Cover slides were sealed with nail polish until use.
Dissociation of muscle fibers prior to their labeling was done by incubating freshly isolated gastrocnemius muscle in DMEM (4.5 g l−1 glucose) containing 2.5% penicillin–streptomycin–nystatin (PSN, v/v; Biological Industries) and Collagenase I (2 mg ml−1; Sigma-Aldrich, C-0130) for 3 hours at 37 °C and 5% CO2. Afterwards, muscles were transferred into a BSA-coated (5% w/v in ultrapure water) 100-mm dish with 15 ml of DMEM (4.5 g l−1 glucose) containing 2.5% PSN and left in the CO2 incubator for 30 minutes. Lastly, muscles were dissociated into single fibers by gradual trituration using a BSA-coated 1-ml tip (pre-cut to have a wider opening). Fibers were collected into a 1.7-ml Eppendorf tube using a fire-polished BSA-coated Pasteur pipette and briefly spun down, and medium was replaced with fresh 4% PFA. Dissociated muscle fibers were labeled similarly. To replace the various reagents during the staining procedure, fibers were gently spun down in each step for discarding maximal volume of the used solution.
miR-126-expressing viral particles
Genes of interest were cloned into a third-generation lentiviral pLL3.7 backbone with either cytomegalovirus (CMV) or hSynapsin promoters. HEK293T cells were transfected by employing the calcium phosphate method and a mixture consisting of the vector of interest and vesicular stomatitis virus glycoprotein, and group antigens–polymerase (reverse transcriptase) was used. The medium was replaced after 5–8 hours, and the supernatant was collected 48 hours later. Next, 50 mM HEPES was added before freezing to maintain a neutral pH for long-term storage at −80 °C. If necessary, the lentiviruses were concentrated using a PEG Virus Precipitation Kit (Abcam). Lastly, the lentiviruses were stored in Neurobasal medium (Gibco) at −80 °C. Lentiviruses were used to overexpress miR126-5p in muscle and MN primary cultures. Two hours after plating, the cells were infected with pLL-miR126-5p–GFP or with pLL–GFP (106 titer units). Custom-made single-stranded AAV vectors, serotype 9 variant PHP.eB expressing miR-126 or GFP, were designed and manufactured by the Viral Vector Facility of ETH Zurich. The titer of the viruses was verified by RT–qPCR in the facility and got virus concentration of approximately 3.2 × 10¹³ viral genomes per 1 ml.
AAV- PHP.eB miR-126 delivery to mice
The injection procedure was performed on presymptomatic approximately P60 mice. Mice were first anesthetized using a mixture of xylazin and ketamine. Then, double injection was performed: intramuscular injection to the right gastrocnemius and retro-orbital injection to the right eye. Each injection was of 25 µl of AAV.PHP.eB–GFP or AAV.PHP.eB miR126-5p–GFP (total of 50 µl per mouse, equal to 1.6 × 10¹² viral genomes) using a 25-µl Hamilton syringe and a 30-gauge Hamilton needle. All animal experimentations were approved by the Tel Aviv University Animal Ethics Committee.
Gait analysis and phenotypic characterization of live animals
Evaluation of the motor abilities in SOD1G93A and healthy mice delivered with AAV.PHP.eB particles was performed using the CatWalk XT gait analysis platform (Noldus Information Technology). The test was done at the ages of P90 (early symptoms) and P130 (late symptoms), 30 days and 70 days after injections, respectively. Moreover, mice weight and survival were monitored throughout the entire experiment duration. Experiment endpoint was set at the point of which mice had reached endstage disease condition at neuronal score 5 or at P200, after which tissues were isolated for further analyses, such as immunofluorescence and PCR.
RNA extraction and cDNA synthesis
MN axonal RNA was extracted from the outer compartment of radial MFCs at 14 days in vitro (DIV). Axonal RNA was extracted by removing the PBS (from prior wash) from the outer compartment and adding 100 µl of QIAzol lysis reagent (Qiagen). The inner well was filled with higher volume of PBS to disable the inward flow of lysis reagent toward the inner (soma) compartment and prevent soma contamination. Axons were washed off the plate by pipetting the QIAzol around the outer well for 30 seconds. RNA from somata in the inner compartment was extracted with 100 µl of QIAzol reagent, and lysate was collected in a similar manner. cDNA for axon and soma was prepared with High-Capacity Reverse Transcription Kit (Thermo Fisher Scientific, 4368814).
For sciatic nerve RNA extraction, sciatic axoplasm was obtained from two adult mice sciatic nerves in a tube containing 100 µl of RNase/DNase-free ultrapure PBS, cut into small pieces and gently squeezed on ice. The axoplasm was then centrifuged at 17,000g for 15 minutes at 4 °C. RNA was extracted using the RNAeasy Micro Kit (Qiagen) according to the manufacturer’s protocols, and RNA yield was quantified using a Qubit fluorometer (RNA Broad-Range Assay Kit; Thermo Fisher Scientific).
Exosomal RNA was extracted by dissolving the exosomal pellet in 700 µl of QIAzol.
RNA was extracted using the RNAeasy Micro Kit (Qiagen) according to the manufacturer’s protocols, and RNA yield was quantified using a Qubit fluorometer (RNA Broad-Range Assay Kit; Thermo Fisher Scientific). For standard whole-cell RNA preparations from MN/muscle cultures, cultures were lysed in 700 µl of TRI reagent, and RNA was isolated with ordinary chloroform, isopropanol precipitation protocol.
Small RNA next-generation sequencing
For small RNA next-generation sequencing, libraries were prepared from 10–15 ng of total RNA using the QIAseq miRNA Library Kit and the QIAseq miRNA NGS 48 Index IL (Qiagen), by an experimenter who was blinded to the identity of samples. Samples were randomly allocated to library preparation and sequencing in batches. Precise linear quantification of miRNA is achieved by using unique molecular identifiers (UMIs) of random 12 nucleotides after 3’ and 5’ adapter ligation, within the reverse transcription primers75. cDNA libraries were amplified by PCR for 19 cycles, with a 3’ primer that includes a six-nucleotide unique index, followed by on-bead size selection and cleaning. Library concentration was determined with a Qubit fluorometer (dsDNA High-Sensitivity Assay Kit; Thermo Fisher Scientific) and library size with TapeStation D1000 (Agilent). Libraries with different indices were multiplexed and sequenced on a NextSeq 500/550 version 2 flow cell or NovaSeq SP100 (Illumina), with 75-bp single read and 6-bp index read. FASTQ files were demultiplexed using the user-friendly transcriptome analysis pipeline (UTAP)76. Mouse miRNAs, as defined by miRBase77, were mapped using the Qiagen RNA-seq Analysis Portal 1.0 and 2.5.1, GeneGlobe pipeline (https://geneglobe.qiagen.com/us/analyze). We defined ‘true-positive’ miRNAs and reduced the likelihood of considering ‘false-positive’ miRNAs by including only miRNAs with an average UMI count >100 across all samples and with at least a single UMI across all samples, similar to our previous works78,79,80. Data were further normalized and average read counts compared between groups using the DESeq2 package81 under the assumption that miRNA counts followed negative binomial distribution. Significance was determined using the Wald test.
Axonal RNA-seq
RNA was extracted from primary MN axons grown in radial MFCs and purified as described above13. RNA yields were quantified using a Qubit fluorometer (RNA Broad-Range Assay Kit; Thermo Fisher Scientific). RNA integrity was assessed by TapeStation. cDNA libraries were prepared from 10 ng of axonal RNA by the genomic unit in the Weizmann Institute of Science using the MARS-seq pipeline82. MARS-seq libraries with different UMIs were multiplexed and sequenced on a NovaSeq SP100 flow cell (Illumina), with 75-bp single read and 15-bp UMI read. After demultiplexing, FASTQ files were mapped to mouse genome using the GenCode annotations (vM25, 2020) in the UTAP piepeline76. We defined ‘true-positive’ genes and reduced the likelihood of considering ‘false-positive’ genes by including only genes with an average UMI count >15 across all samples. Data were further normalized and average read counts compared between groups using the DESeq2 package81 under the assumption that gene counts followed negative binomial distribution. Significance was determined using the Wald test.
RT–qPCR analysis
SYBR Green-based assays (PerfeCTa SYBR Green FastMix; Quantabio) and StepOne Real-Time PCR system (Thermo Fisher Scientific) were used in RT–qPCR to quantify differential expression of mRNAs in MNs, MN axons and primary skeletal muscles. GAPDH mRNA was used as a reference RNA when calculating ∆CT. RT–qPCR primers and their sequences are listed in Supplementary Table 5.
Actb mRNA was used as a reference RNA when calculating ∆CT in Tardbp/Polb relative expression in axons and somata cDNA preparations.
PCR amplification and Southern blot
Reverse transcription was performed with the High-Capacity Reverse Transcription cDNA Kit using random primers (Thermo Fisher Scientific). Standard PCR was used to amplify sciatic axoplasm cDNA for detecting Tardbp, Polb and Actb mRNA using KAPA ReadyMix. Primer sequences are listed in Supplementary Table 5.
TaqMan miRNA RT–qPCR
TaqMan RT–qPCR was done to evaluate the levels of mature miR-126-5p. U6 gene was used as a reference gene when calculating ∆CT, as we aim to quantify relative miR-126-5p levels in various tissues and cells.
For the TaqMan experiment, cDNA was extracted from the purified RNA using dedicated primers that will amplify miR126-5p signal using the High-Capacity cDNA Reverse Transcription Kit (Applied Biosystems, 4368813). Later, we ran the samples in qPCR using the TaqMan method to quantify the alteration in miR-126-5p levels using miR126-5p and U6 advanced TaqMan primers (Thermo Fisher Scientific, 4427975). qPCR TaqMan reactions were performed with TaqMan Fast Advanced Master Mix for qPCR (Thermo Fisher Scientific) in a StepOne Real-Time PCR system (Thermo Fisher Scientific).
TDP-43 isoforms quantification
Illumina FASTQ files were uploaded for bioinformatics analysis to CLC Genomics Workbench version 24 (https://digitalinsights.qiagen.com/products-overview/discovery-insights-portfolio/analysis-and-visualization/qiagen-clc-genomics-workbench/) and the ‘RNA-seq analysis’ tool with default options. In brief, reads were trimmed from 5’ adapter sequence of GTTCAGAGTTCTACAGTCCGACGATC. After this, trimmed reads were aligned to the GRCm39/mm39 mouse genome (downloaded from https://www.gencodegenes.org/mouse/) with the following parameters: mismatch cost of 2, insertion cost of 3, deletion cost of 3, length fraction of 0.8 and similarity fraction of 0.8. Aligned reads were annotated to mRNA tracks to define splicing isoforms per gene. Finally, isoforms were quantified by the CLC Genomics Workbench ‘expectation–maximization’ estimation algorithm.
Dual-luciferase reporter assay
HEK293A cells were seeded a day before transfection in three 60-mm wells (2.5–3 × 10⁵ per well; Thermo Fisher Scientific, 140675) per sample. Cells were co-transfected with mirVec plasmid expressing the pre-microRNA-126 and dual-luciferase (Firefly and Renilla Luciferase) plasmid (a kind gift from the Shomron laboratory, Tel Aviv University). Dual-luciferase plasmid was cloned downstream to Renilla Luciferase with 100-bp context sequence of the 3’ UTR of mmu-TDP-43 mRNA containing either the wild-type miR-126a-5p binding site or a mutant one where four nucleotides within this site have been mutated. Transfection was performed by Lipofectamine 2000 (Invitrogen, 11668-027) for 72 hours, after which cells were washed once with PBS (Sigma-Aldrich, D8537; 500 ml) and harvested according to the manufacturer’s protocol.
Serum EV purification
Patient blood serum samples were collected from Caucasian patients with ALS aged 45–88 years (68.37 ± 14.49) and healthy controls aged 23–66 years (43.87 ± 16.81) from both sexes (Supplementary Table 5), with collaboration of Amir Dori from Sheba Hospital. From each sample, 1 ml was used to purify EVs in order to evaluate the levels of mature miR-126-5p. Using the exoRNeasy kit (Qiagen, 76064), we isolated EVs from the serum samples and purified total RNA. The levels were normalized to the same volume and process for all the samples and conditions.
Protein extraction
Gastrocnemius muscles were extracted from adult mice and homogenized in ice-cold PBS lysis buffer containing 0.1% Triton X-100, protease and phosphatase inhibitors (Roche). Sciatic axoplasm was obtained from both sciatic nerves from every mouse. Sciatic nerves were sectioned, and axoplasm was extracted into 100 µl of PBS with protease and phosphate inhibitors by gentle pressing the sections. Proteins from primary MNs and primary muscle cultures were extracted using PBS lysis buffer containing 0.1% Triton X-100, protease and phosphatase inhibitors.
Tissue/culture lysates were centrifuged at 10,000g for 15 minutes at 4 °C. Protein concentration was determined using Bradford (Bio-Rad) or BCA (Cyanogen) colorimetric assays.
Western blotting
Protein samples were mixed with SDS sample buffer and boiled at 95 °C for 10 minutes and then loaded to 10% acrylamide gels for SDS-PAGE. Proteins were transferred to nitrocellulose or PVDF membranes in buffer containing 20% MeOH. Membranes were blocked with 5% skim milk (BD Biosciences) or 5% BSA for 1 hour, followed by overnight incubation at 4 °C with primary antibodies: mouse anti-human-TDP-43 (1:2,000; Proteintech), rabbit anti-TDP-43 (1:2,000; Proteintech), rabbit anti-ERK1/2 (1:10,000; Sigma-Aldrich), mouse anti-α-tubulin (1:5,000; Abcam), rabbit anti-CD63 (1:100; Santa Cruz Biotechnology, H-193, sc-15363), rabbit anti-CD9 (1:100–1:1,000; Abcam, ab92726), mouse anti-CD81 (1:100–1:2,000; Abcam, ab79559), rabbit anti-Ago2 (1:500; Abcam, ab32381), rabbit anti-ALIX (1:250; Abcam, ab76608), mouse anti-SOD1 (1:500; Santa Cruz Biotechnology, FL-154), rabbit anti-Rab27a (1:200; Proteintech, 17817-1-AP) and GM130 (1:200; BD Biosciences, 610823), followed by species-specific HRP-conjugated secondary antibodies: rabbit 111-035-003 and mouse 715-035-151, both 1:10,000 (The Jackson Laboratory). Membranes were then washed with TBS with 0.05% Tween 20 (TBS-T) and incubated for 2 hours at room temperature with secondary HRP antibody (1:10,000; The Jackson Laboratoy), washed with TBS-T and visualized in an iBright 1500 ECL imager (Life Technologies) after 5-minute incubation with ECL reagents. Quantification was performed using FIJI ImageJ software version 2.3.0/1.53q.
MFC preparation
MFCs were prepared as previously described13,30,83. In brief, PDMS (Dow Corning) was cast into custom-made epoxy replica molds, left to cure overnight at 60 °C, punched (6-mm/7-mm/9-mm punches according to the type of MFC), cleaned and positioned in 35-mm and 50-mm glass plates (WPI) or over 22 × 22-mm microscope cover glasses (Mariendfeld). Radial MFCs were positioned on pre-adhered round 13-mm cover glasses within 24-well plates.
MN culture and MN–myocyte co-culture
Ventral spinal cords from embryonic day 12.5 (E12.5) embryos were dissected in HBSS prior to dissociation. For Rab27a shRNA experiments, co-cultures were performed with ventral spinal cord explants isolated as previously described29,30,83. In brief, ventral spinal cords were acquired transversely, sectioning spinal cords into small pieces after dissecting the dorsal horns and plating in MFC proximal compartment in Neurobasal (Gibco), 2% B27 (Thermo Fisher Scientific), 1% GlutaMAX (Gibco), 1% penicillin–streptomycin and 25 ng ml−1 BDNF (Alomone Labs).
Dissociated MN cultures were obtained by further trypsinization and trituration of explants. Supernatant was collected and centrifuged through BSA (Sigma-Aldrich) cushion. The pellet was then resuspended and centrifuged through an OptiPrep (Sigma-Aldrich) gradient (containing 10.4% OptiPrep, 10 mM tricine and 4% w/v glucose). MN-enriched fraction was collected from the interphase, resuspended and plated in the proximal MFC compartment at a concentration of 200,000 MNs per regular MFC and 250,000 per radial MFC. MNs were maintained in complete neurobasal medium containing Neurobasal, 4% B27, 2% horse serum (Biological Industries), 1% GlutaMAX, 1% penicillin–streptomycin, 25 µM β-mercaptoethanol, 25 ng ml−1 BDNF, 1 ng ml−1 GDNF (Alomone Labs) and 0.5 ng ml−1 CNTF (Alomone Labs). Glial cell proliferation was restricted by the addition of 1 µM cytosine arabinoside (Sigma-Aldrich) to culture medium in 1–3 DIV. At 3 DIV, BDNF concentration in proximal compartment was reduced (1 ng ml−1), whereas medium in distal compartment was enriched with GDNF and BDNF (25 ng ml−1) to direct axonal growth.
Myocyte culture was performed as previously described29. In brief, gastrocnemius muscles from a P60 adult C57BL/6J mouse were extracted into DMEM with 2.5% PSN (Biological Industries) with 2 mg ml−1 Collagenase I (Sigma-Aldrich) for 3 hours and then dissociated and incubated with BIOAMF-2 (Biological Industries) in Matrigel (BD Corning)-coated plates for 3 days. Myoblasts were purified by performing pre-plating for three consecutive days and then plated at a density of 75,000 per MFC. Remaining myocytes were cryopreserved in 95% FBS, 5% DMSO and were used according to need by rapid thawing at 37 °C and resuspension in pre-warmed BIOAMF-2 medium (without antibiotics), followed by 300g, 4-minute-long centrifugation. Pellet was resuspended in BIOAMF-2 medium (without antibiotics), and muscles were plated in Matrigel-precoated 24-well plates for overnight recovery (150,000 myoblasts per well). In case the experiment performed required transfection of plasmids (that is, Rab27a shRNA, CD63–GFP, CD63-pHluorin, PLKO.1), myocytes were transfected 8 hours after their plating in the 24-well plates (further details in the transfection method section).
Prior to their co-culturing with primary MNs, primary myocytes in 24-well plates were washed once with pre-warmed PBS and then detached with 100 -µl-per-well Trypsin C solution (Biological Industries) for 15 minutes and then collected in fresh pre-warmed BIOAMF-2 medium and processed through 300g, 4-minute-long centrifugation. Myocyte pellets were resuspended in BIOAMF-2 medium and plated in the neuromuscular compartment of an MFC 1 hour after primary MNs were plated in the neuronal compartment. To aid NMJ formation, media in all compartments were then replaced to poor neurobasal (PNB) medium, which contained only 1% penicillin–streptomycin and 1% GlutaMAX.
Vectors and primary muscle transfection
As detailed above, transfection of genetic vectors into muscles was performed at the myocyte stage of differentiation and prior to their culturing in MFCs. Myocytes were transfected using 1 µg of DNA and 3 µl of TurboFect transfection reagent (Thermo Fisher Scientific) in 300 µl of Opti-MEM medium (Gibco). Transfection mix was prepared according to the manufacturerʼs instructions. Transfection mix was discarded after 12 hours, and myocytes were washed once with pre-warmed optimum medium and then left to recover for an additional 4 hours with BIOAMF-2 medium (no antibiotics). Muscles were then re-plated in MFCs as described previously.
CD63-peGFP C2 (plasmid no. 62964), pCMV-lyso-pHluorin (CD63-pHluorin; plasmid no. 70113) and pLKO-Tet-On-shRab27a (plasmid no. 120930) were acquired from Addgene repositories.
pLL3.7-Ago2-eGFP was constructed in the Tel Aviv University lentiviral facility. pLL3.7-TDP-43-eGFP was constructed by cloning TDP-43-eGFP into PLL3.7 backbone (acquired from Addgene).
For shRab27a experiments, doxycycline was applied exclusively at the neuromuscular compartment at 5 days into co-culture, in a concentration of 1 µg ml−1.
Live imaging of CD63-pHluorin signals was performed using Tyrode’s solution (2 mM CaCl2, 2.5 mM KCl, 119 mM NaCl, 2 mM MgCl2, 20 mM glucose and 25 mM HEPES (pH 7.4)) in the presence or absence of 50 mM NH4Cl (instead of NaCl) to neutralize intracellular pH.
Tracking muscle-derived RNA in axons
Primary skeletal muscles were cultured and differentiated as mentioned above. Upon differentiation, SYTO RNASelect Green (5 µM; Invitrogen, S32703) was added to muscle growth media for 1 hour. Cultures were washed three consecutive times with PBS, and fresh collection media were added to cultures. Muscle conditioned media were collected for 3 hours and then centrifuged at 4,000g for 5 minutes and passed through a 0.45-µm filter. Medium was applied to the axons within the distal compartment of MFCs. Prior to conditioned media addition, neuronal RNA was labeled using SYTO64 (5 µM; Invitrogen, S11346) for 10 minutes and then washed away by consecutive PBS and medium washes.
GW4869 exosome/EV inhibitor
Muscle experiments were conducted using GW4869 inhibitor (Sigma-Aldrich, D1692) dissolved in DMSO creating a 5 mM stock solution. The inhibitor or the DMSO control was diluted to the culture media (BIOAMF-2) to a final concentration of 10 µM.
In vitro NMJ quantification
NMJ disruption was determined by high-magnification confocal imaging and quantification of the overlap of presynaptic and postsynaptic markers at the neuromuscular compartment in co-cultures. At the endpoint of the experiments (normally 10–14 days), co-cultures in MFCs were fixed with 4% PFA for 15 minutes at room temperature. αBTX-ATTO Fluor-633 (1:200; Alomone Labs, B-100-FR) or TMR-αBTX (Sigma-Aldrich) was used to label the extracellular domain of postsynaptic nAchR prior to membrane permeabilization. The percentage of healthy NMJs was determined by dividing the number of intact co-localization events, with intact non-degenerated axons, by the total number of co-localization events identified in every MFC.
EV purification process
EVs were isolated from culture media using an ultracentrifuge protocol as previously described. In brief, the conditioned medium from differentiated primary muscle cultures (7 DIV) grown in 10-cm plates was collected in serum-free conditions for 16 hours. Conditioned medium was then centrifuged at 300g for 10 minutes at 4 °C, and supernatant was collected and transferred to a new tube centrifuged at 2,000g for 20 minutes at 4 °C. Supernatant was collected again and centrifuged at 10,000g for 30 minutes at 4 °C. Supernatant was then transferred into ultracentrifugation suitable tubes (Ultra-Clear centrifuge tubes; Beckman Coulter, 344059) and centrifuged at 100,000g for 70 minutes at 4 °C using the Optima-80 XPN ultracentrifuge (Beckman Coulter) with SW41 Ti rotor. Supernatant was discarded, and EV pellet was washed with ultrapure PBS 1× and centrifuged again at 100,000g for 60 minutes at 4 °C. The purified EVs were resuspended with 35 µl of 3.5× Laemmli sample buffer for western blot, 30 µl of PBS 1× for electron microscopy, 50 µl of PBS 1× for functional experiments or 700 µl of QIAzol for downstream RNA isolation.
In addition to the standard ultracentrifugation procedure, EVs for western blots and NTA in Supplementary Fig. 3a,b, Fig. 5d,e and Fig. 5m,n were isolated from primary muscle cultures grown in two 35-mm dishes per condition (total 4 ml) after 48 hours of medium collection in serum-free medium containing DMEM (4.5 g l−1 glucose), GlutaMAX (1%), B27 supplement (2%) and NEAA (1%) and in the presence or absence of the relevant treatment or control. EVs were purified using exoRNAeasy Midi exosome purification kit (Qiagen, 77144), following the manufacturerʼs protocol. For the NanoSight NTA, isolated EVs were further diluted 10× in PBS (0.1 µm filtered). Sample preparation for SDS-PAGE was done by lysing the isolated EVs in 10× RIPA buffer (Millipore) containing protease and phosphatase inhibitor mix. EV protein extracts were further concentrated using Amicon 0.5-ml centrifugal filters (10-kDa molecular weight cutoff). Whole-cell lysates were prepared by washing the culture once with 1× PBS and lysing the cultures with 1× RIPA buffer containing protease and phosphatase inhibitor mix. Protein concentrations were determined by BCA, and equal amounts of protein were loaded.
TEM imaging and negative staining
Samples were adsorbed on formvar/carbon-coated grids and stained with 2% aqueous uranyl acetate. Samples were examined using a JEM 1400Plus transmission electron microscope (Jeol). Images were captured using SIS Megaview III and the iTEM imaging platform (Olympus). Images were analyzed using FIJI software version 2.3.0/1.53q. Preparation and imaging of the samples in TEM were conducted by Vered Holdengreber at Tel Aviv University.
Fluorescence microscopy and image analysis
Confocal images were captured using a Nikon Ti microscope equipped with a Yokogawa CSU X-1 spinning disk and an Andor iXon897 EMCCD camera controlled by Andor IQ3 software version 3.0; an Andor BC-43 benchtop spinning disk confocal system controlled by Andor Fusion software version2.3a; or a 3i Marianas confocal system with a Zeiss Axio Observer 7 microscope, equipped with a Yokogawa CSU-W1 spinning disk and a Prime 95B Back-Illuminated Scientific CMOS camera controlled by SlideBook software version 6.0. Phase-contrast movies of muscle contraction were acquired using the same microscope. High-content imaging and analysis of phase neurite morphology was performed using Sartorius Incucyte S3, 2019A, including Neurotrack module (cat. no. 9600-0010). All live imaging experiments were performed with 5% CO2 and 37 °C humidified using an in situ microscope setup.
smFISH
TDP-43 mRNA single-molecule inexpensive FISH (smiFISH) was performed as previously described13,84. In brief, primary MNs were isolated and cultured for 7 days on cover glasses. Labeling procedures were performed in an RNase-free environment and using RNAse-free reagents. Cultures were fixed with 4% PFA and permeabilized overnight with 70% ethanol. Before hybridization, 40 pmol of 27 oligo-mix probes were pre-hybridized to 50 pmol of the FLAP probe in 10 μl of 100 mM NaCl, 50 mM Tris-HCl and 10 mM MgCl2 (pH 7.9). Pre-hybridization was performed on a thermocycler using the following program: 85 °C for 3 minutes, 65 °C for 3 minutes and 25 °C for 5 minutes. Samples were incubated with SSC (Sigma-Aldrich, S6639)-based 15% formamide (Thermo Fisher Scientific, 17899) buffer for 15 minutes. Samples were hybridized overnight at 37 °C with 27× FLAP-Y-Cy-3-tagged complementary oligonucleotide probes targeting regions in mouse Tardbp transcript variant 3 or with 23× FLAP-Y-Cy-3-tagged complementary probes targeting mouse Actb (Integrated DNA Technologies; Supplementary Table 5). The final hybridization mixture contained the probe duplexes (2 μl per 100 μl of final volume), 1× SSC, 0.34 mg ml−1 tRNA (Sigma-Aldrich, 1753), 15% formamide, 2 mM VRC (Sigma-Aldrich, R3380), 0.2 mg ml−1 RNAse-free BSA (Roche, 10711454001) and 10% dextran sulfate (Sigma-Aldrich, D8906). Samples were washed twice with warm 15% formamide and 1× SSC buffer (1 hour each), followed by 30 minutes with 1× SSC buffer and 30 minutes with 1× PBS supplemented with Phalloidin-FITC (1:250). Prior to mounting, samples were labeled with DAPI (0.2 µg ml−1). Samples were mounted with VECTASHIELD antifade reagent.
Labeling of TDP-43 mRNA in NMJs in vivo was performed in a similar way with the following modifications. Freshly isolated EDL muscles were dissected into smaller fiber bundles and fixed in 4% PFA for 1 hour while rocking. After PFA washout, tissues were permeabilized for 1 hour with 1% Triton X-100 in diethylpyrocarbonate (DEPC) water while rocking. Samples were washed with DEPC-PBS and then pre-hybridized as mentioned above. smiFISH hybridization steps were performed similarly to cultured cell yet with continuous agitation. After post-hybridization washes as detailed above, tissues were fixed again with 4% PFA for 10 minutes, after which we performed standard whole-mount immunolabeled with chicken anti-NFH (1:500) overnight at room temperature while rocking. After primary antibody washout, samples were incubated with secondary Alexa Fluor-405 anti-chicken antibodies at room temperature for 4 hours while rocking. After secondary antibody washout, samples were mounted with VECTASHIELD antifade reagent.
TDP-43 puro-PLA
Combined TDP-43 and puro-PLA was performed as previously described28 in order to evaluate the extent of TDP-43 protein synthesis in MN axons. In brief, primary MNs were grown in MFCs in the presence or absence of primary skeletal muscles in the neuromuscular compartment. Puromycin labeling was performed exclusively to the distal (axonal or neuromuscular compartment) for 30 minutes at a concentration of 10 µM, followed by two rapid cold PBS 1× washes and fixation in 4% PFA for 15 minutes. To validate the specificity of puro-PLA labeling, protein synthesis was exclusively inhibited in the distal/neuromuscular compartment by the addition of anisomycin (40 µM) for 30 minutes prior to and along with puromycin labeling. To reduce the background labeling in neuromuscular co-cultures and to expose the presynaptic PLA signals, primary muscles were transfected with empty backbone vector (PLKO.1) expressing the puromycin resistance gene puromycin acetyltransferase (PAC) prior to their co-culturing13. In co-cultures, postsynaptic AChRs were labeled before permeabilization with αBTX-ATTO-633 (Alomone Labs, B-100-FR) or TMR-αBTX (Sigma-Aldrich). PLA was performed on the following primary antibodies: rabbit anti-TDP-43 (recognizing N terminal of TDP-43; 1:2,000; Proteintech, 10782-2-AP) and mouse anti-puromycin 12D10 clone (1:1,000; Millipore, MABE343). PLA was performed according to manufacturer guidelines (Sigma-Aldrich, Duolink Proximity Ligation Assay Kit, and Navinci, NaveniFlex PLA Kit). After completion of the PLA protocol, samples were fixed with 4% sucrose, 4% PFA for 10 minutes, and then standard immunofluorescence labeling was performed to visualize axonal markers.
Ex vivo TDP-43 puro-PLA
Ex vivo puromycilation was performed by extracting EDL muscles into pre-heated (37 °C), pre-oxygenized (95% O2, 5% CO2) and 0.22-µm filtered DMEM labeling medium (+glucose 4.5 g l−1) containing 10% FBS, supplemented with puromycin (10 µM), anisomycin (40 µM) or none of those. Labeling media were infused into the EDL muscles at several locations using a 30-gauge insulin syringe (50–100 µl per injection site). Muscles were incubated in a 60-mm dish containing the labeling media for 40 minutes at 37 °C and 5% CO2 and after which were rinsed for three times with rapid (2-minute) ice-cold PBS injections in a 60-mm dish with cold PBS prior to their fixation with cold 4% PFA in a similar injection fashion. Anisomycin-treated samples were further injected and incubated for 40 minutes with labeling media containing both anisomycin and puromycin. Muscle samples were kept for at least 2 hours in PFA fixation (but no longer than 16 hours) before proceeding with the protocol. EDL muscles were further cleared of connective tissues and dissected into smaller muscle fiber bundles (approximately 200 fibers per bundle) using a scalpel. BTX labeling was performed as described above using TMR-αBTX (Sigma-Aldrich) diluted in TBS buffer (20 mM Tris base and 150 mM NaCl (pH 7.6)) while rocking. After washing, samples were permeabilized with TBS containing 0.4% Triton X-100 for 30 minutes at room temperature while rocking, washed once and further permeabilized with ice-cold MeOH for 5 minutes. The ex vivo PLA reaction was performed using the NaveniFlex Tissue MR ATTO647N kit (Navici, NT.MR.100.Atto647N) following the manufacturer’s instructions with slight volume modifications. Blocking and primary antibody incubations were performed using reagents supplied within the NaveniFlex kit. We used mouse anti-puromycin 12D10 clone (1:1,000; Millipore, MABE343), rabbit anti-TDP-43 (recognizing N terminal of TDP-43; 1:1,500; Proteintech, 10782-2-AP) or rabbit anti-β-actin (1:500; Abcam, ab8227) that were incubated with samples overnight at 4 °C while rocking. After washes according to protocol, samples were incubated with secondary NaveniFlex antibodies for 2 hours at 37 °C, rather than 1 hour as indicated by the manufacturer, for improving their penetration into the whole-mount muscle preparations. After completion of the PLA procedures, samples were postfixed with 4% PFA for 10 minutes, washed with TBS and labeled with chicken anti-NFH (1:500; Abcam, ab72996) and guinea pig anti-Synaptophysin (1:300; SYSY, 101004) in blocking solution (TBS, 5% goat serum, 1 mg ml−1 BSA and 0.1% Triton X-100) overnight at room temperature while rocking. After TBS-T washes, samples were incubated for 4 hours at room temperature while rocking with secondary antibodies: goat anti-chicken (1:500; Abcam, ab150173) and goat anti-guinea pig-488 (1:500; Abcam, ab150185). After TBS-T washes, samples were labeled with DAPI, washed and mounted using VECTASHIELD.
OPP labeling of axonal protein synthesis
The puromycin derivative OPP was used to label axonal and presynaptic protein synthesis in co-cultures and ex vivo in NMJs as previously described13. In brief, to reduce background labeling in muscles and to better visualize presynaptic protein synthesis, primary muscle cultures were transfected with a PAC-expressing vector prior to their co-culturing with primary MNs. At experimental timepoint, OPP (20 µM) was added exclusively to the neuromuscular compartment of MFCs for 30 minutes followed by two rapid cold PBS 1× washes and fixation in 4% PFA for 15 minutes. Postsynaptic AChRs were labeled before permeabilization with αBTX-ATTO-633 (Alomone Labs, B-100-FR) or TMR-αBTX (Sigma-Aldrich). OPP was labeled with Alexa Fluor-594 picolyl azide by click chemistry (Click-iT Plus OPP Kit; Molecular Probes, C10457) according to manufacturer instructions. After click reaction was washed, cultures were fixed once again with 4% sucrose, 4% PFA for 10 minutes before continuing with standard immunofluorescence labeling for visualizing axonal markers and additional proteins. Samples were mounted with ProLong Gold antifade reagent (Molecular Probes).
Ex vivo OPP labeling in EDL muscles was performed by bathing and infusing freshly isolated EDL or gastrocnemius muscles with 20 µM OPP in Ringerʼs solution or in DMEM medium (+glucose 4.5 g l−1 containing 10% FBS) (using a 30-gauge insulin syringe as described above in the ex vivo puro-PLA section) for 40 minutes at 37 °C, followed three rapid washes with cold PBS 1× and fixation with 4% PFA for 20 minutes. Postsynaptic AChRs were labeled as mentioned before permeabilization. Tissues were permeabilized in 100% MeOH at −20 °C for 5 minutes. Tissues were washed in PBS and then processed with the Click-iT protocol while rocking. After click reaction was washed, cultures were fixed once again with 4% sucrose, 4% PFA for 10 minutes before continuing with standard whole-mount immunofluorescence protocol. Samples were mounted with VECTASHIELD.
miR-126-5p inhibitor
miR-126-5p inhibitor (miR126i; Qiagen, miScript miRNA inhibitor) was transfected into the neuromuscular compartment at the fifth day of co-cultures at concentration of 100 nM. Transfection was performed using TurboFect transfection reagent (Thermo Fisher Scientific) at the following ratio: 0.75 µl of TurboFect per MFC (200 µl) with 1 µl of miR-126-5p inhibitor (20 µM stock) in BIOAMF-2 medium. Medium in transfected compartments was refreshed 3 days after transfection. NMJ function analysis was performed at the fourth day after transfection. Co-cultures underwent puromycin/OPP labeling and further fixation at the fifth day after transfection. Due to its discontinuation, the experiments in Fig. 7 done in combination with siRNAs for TDP-43 were performed with the new miRCURY LNA-miR-126-5p inhibitor (Qiagen, 339121) at a final concentration of 50 nM.
TDP-43 siRNA
To locally knock down TDP-43, we transfected axons and neuromuscular compartment in MFCs with two types of Silencer Select predesigned siRNAs for mmu-Tardbp or a negative control siRNA (s106687, s106688 and 4390843, respectively; Ambion; Supplementary Table 5). Lipofectamine 3000 was used to transfect a total of 80 nM siRNA mix or negative control into the distal compartment of MFCs either alone or in combination with 50 nM LNA-miR-126-5p inhibitor. Cultures were fixed and labeled 4 days after transfection to analyze axonal integrity and the TDP-43 distribution in axons.
miR-126a-5p FISH
miR-126a-5p FISH was performed on whole-mount EDL muscle tissues as previously described85. In brief, to visualize miR-126a-5p in mouse tissues, we adapted an LNA probe-based tyramide signal amplification protocol. EDL muscles were isolated, physically cleared of connective tissues and fixed in 4% PFA for 1 hour while rocking, followed by three PBS washes. Tissues were then permeabilized in 1% Triton X-100 in DEPC-PBS for 10 minutes while rocking. Samples were further acetylated for 5 minutes in acetylation buffer (60 nM HCl, 1.3% v/v TEA and 6% v/v acetic anhydride in DEPC water), followed by three PBS 1× washes. Samples were pre-hybridized in hybridization mix for 30 minutes at 60 °C while rocking (5× SSC, 50% formamide, 5% tRNA, 9.25 mM citric acid and 2% Denhardt’s solution). Next, samples were hybridized with miR-126-5p miRCURY LNA detection probes (Qiagen, YD00612156-BCE) in hybridization solution for 1 hour at 60 °C while rocking, followed by three 10-minute washes with 0.1% SSC at 65 °C and an additional wash with 2× SSC at room temperature for 5 minutes. Samples were exposed to 3% hydrogen peroxide for 10 minutes at room temperature, followed a single 5-minute wash with TN buffer. Samples were blocked for 30 minutes at room temperature in blocking buffer and then incubated for 1 hour with anti-DIG antibody (1:400) at room temperature while rocking, followed by three 5-minute washes with TNT buffer. Lastly, signal was amplified by incubation in amplification buffer containing Tyramide-647 for 10 minutes at room temperature, followed by three 5-minute washes with TNT buffer. Prior to continuing with standard whole-mount immunofluorescence protocol for labeling presynaptic axons, tissues were fixed once more with 4% sucrose, 4% PFA solution. Rabbit anti-NFH (1:500) and rabbit anti-Synapsin I (1:500) were incubated with samples overnight at room temperature while rocking, followed by three PBS washes and 4-hour incubation with secondary antibody Alexa Fluor-488-conjugated goat anti-rabbit (1:500). Samples were labeled with DAPI during secondary antibody washes and mounted in VECTASHIELD.
Statistics and reproducibility
Statistical parameters, tests used, sample sizes and number of repeats are noted in the figure legends. Assignment to experimental groups (in vivo and in vitro) was made random. Data collection was randomized. Data collection and analysis were performed blinded to the conditions of the experiments whenever possible, however not for all experiments. Exclusion of data points was performed based on standard GraphPad Prism outlier analysis (ROUT method, Q = 1%). Images are representative of all experimental repeats. Statistical significance was determined using Student’s t-test or Wald test when comparing between two groups and multiple comparisons ANOVA test when comparing more than two groups. In specific cases where samples did appear to not have a normal distribution, a normality test was performed, and the subsequent significance test was determined accordingly. Kruskal–Wallis test was used to assess significance in non-parametric datasets with more than two groups. In some instances, multiple t-test analysis was performed instead of two-way ANOVA, where groups on the same graph were not subject to comparison. Multiple comparisons were corrected using Holm–Sidak correction. Representative images of patient obturator nerve cross-section and muscle biopsy cross-section (showing intramuscular nerves) are from a single patient per genotype. Non-ALS and ALS samples, excluding SOD1 mutants, in both types of biopsies were previously validated by us and others as positive of phospho-TDP43 using the same antibodies and labeling and image acquisition techniques13,15. No statistical methods were used to predetermine sample sizes, but our sample sizes are similar to those reported in previous publications35,86,87,88,89. Threshold for determining statistical significance was P < 0.05. All statistical analyses were performed with GraphPad Prism 10.
Reporting summary
Further information on research design is available in the Nature Portfolio Reporting Summary linked to this article.
Data availability
The RNA and miRNA sequencing FASTQ files with raw sequencing data, text files with raw read counts and Excel files with processed read counts are available in the Gene Expression Omnibus (GEO) via accession number GSE286913. GRCm39/mm39 genome was accessed at https://www.gencodegenes.org/mouse/. All data generated in this study are provided in the Supplementary Information and Source Data files. Source data are provided with this paper.
Code availability
R codes that were developed within this study and used for RNA-seq analysis are available in the GEO via accession number GSE286913.
References
Peters, O. M., Ghasemi, M. & Brown, R. H. Emerging mechanisms of molecular pathology in ALS. J. Clin. Invest. 125, 1767–1779 (2015).
Fischer, L. R. et al. Amyotrophic lateral sclerosis is a distal axonopathy: evidence in mice and man. Exp. Neurol. 185, 232–240 (2004).
Frey, D. et al. Early and selective loss of neuromuscular synapse subtypes with low sprouting competence in motoneuron diseases. J. Neurosci. 20, 2534–2542 (2000).
Moloney, E. B., de Winter, F. & Verhaagen, J. ALS as a distal axonopathy: molecular mechanisms affecting neuromuscular junction stability in the presymptomatic stages of the disease. Front. Neurosci. 8, 252 (2014).
Taylor, J. P., Brown, R. H. & Cleveland, D. W. Decoding ALS: from genes to mechanism. Nature 539, 197–206 (2016).
Neumann, M. et al. Ubiquitinated TDP-43 in frontotemporal lobar degeneration and amyotrophic lateral sclerosis. Science 314, 130–133 (2006).
Neumann, M. et al. Phosphorylation of S409/410 of TDP-43 is a consistent feature in all sporadic and familial forms of TDP-43 proteinopathies. Acta Neuropathol. 117, 137–149 (2009).
Buratti, E. & Baralle, F. E. The molecular links between TDP-43 dysfunction and neurodegeneration. Adv. Genet. 66, 1–34 (2009).
Lagier-Tourenne, C. & Cleveland, D. W. Rethinking ALS: the FUS about TDP-43. Cell 136, 1001–1004 (2009).
Alami, N. H. et al. Axonal transport of TDP-43 mRNA granules is impaired by ALS-causing mutations. Neuron 81, 536–543 (2014).
Fallini, C., Bassell, G. J. & Rossoll, W. The ALS disease protein TDP-43 is actively transported in motor neuron axons and regulates axon outgrowth. Hum. Mol. Genet. 21, 3703–3718 (2012).
Coyne, A. N. et al. FUTSCH/MAP1B mRNA is a translational target of TDP-43 and is neuroprotective in a Drosophila model of amyotrophic lateral sclerosis. J. Neurosci. 34, 15962–15974 (2014).
Altman, T. et al. Axonal TDP-43 condensates drive neuromuscular junction disruption through inhibition of local synthesis of nuclear encoded mitochondrial proteins. Nat. Commun. 12, 6914 (2021).
Kurashige, T. et al. TDP-43 accumulation within intramuscular nerve bundles of patients with amyotrophic lateral sclerosis. JAMA Neurol. 79, 693–701 (2022).
Riva, N. et al. Phosphorylated TDP-43 aggregates in peripheral motor nerves of patients with amyotrophic lateral sclerosis. Brain 145, 276–284 (2022).
Perry, R. B. & Fainzilber, M. Local translation in neuronal processes–in vivo tests of a ‘heretical hypothesis’. Dev. Neurobiol. 74, 210–217 (2014).
Larance, M. & Lamond, A. I. Multidimensional proteomics for cell biology. Nat. Rev. Mol. Cell Biol. 16, 269–280 (2015).
Jung, H., Yoon, B. C. & Holt, C. E. Axonal mRNA localization and local protein synthesis in nervous system assembly, maintenance and repair. Nat. Rev. Neurosci. 13, 308–324 (2012).
Fellows, A. D., Rhymes, E. R., Gibbs, K. L., Greensmith, L. & Schiavo, G. IGF 1R regulates retrograde axonal transport of signalling endosomes in motor neurons. EMBO Rep. 21, e49129 (2020).
Shigeoka, T. et al. Dynamic axonal translation in developing and mature visual circuits. Cell 166, 181–192 (2016).
Holt, C. E., Martin, K. C. & Schuman, E. M. Local translation in neurons: visualization and function. Nat. Struct. Mol. Biol. 26, 557–566 (2019).
Gershoni-Emek, N., Chein, M., Gluska, S. & Perlson, E. Amyotrophic lateral sclerosis as a spatiotemporal mislocalization disease: location, location, location. Int. Rev. Cell Mol. Biol. 315, 23–71 (2015).
Barmada, S. J. Linking RNA dysfunction and neurodegeneration in amyotrophic lateral sclerosis. Neurotherapeutics 12, 340–351 (2015).
Fratta, P., Birsa, N., Tosolini, A. P. & Schiavo, G. Travelling together: a unifying pathomechanism for ALS. Trends Neurosci. 43, 1–2 (2020).
López-Erauskin, J. et al. ALS/FTD-linked mutation in FUS suppresses intra-axonal protein synthesis and drives disease without nuclear loss-of-function of FUS. Neuron 100, 816–830 (2018).
Lai, A., Valdez-Sinon, A. N. & Bassell, G. J. Regulation of RNA granules by FMRP and implications for neurological diseases. Traffic 21, 454–462 (2020).
Rotem, N. et al. ALS along the axons – expression of coding and noncoding RNA differs in axons of ALS models. Sci. Rep. 7, 44500 (2017).
Tom Dieck, S. et al. Direct visualization of identified and newly synthesized proteins in situ. Nat. Methods 12, 411–414 (2015).
Ionescu, A., Zahavi, E. E., Gradus, T., Ben-Yaakov, K. & Perlson, E. Compartmental microfluidic system for studying muscle-neuron communication and neuromuscular junction maintenance. Eur. J. Cell Biol. 95, 69–88 (2016).
Ionescu, A. & Perlson, E. Microfluidic neuromuscular co-culture system for tracking cell-to-cell transfer and axonal transport of labeled proteins. Methods Mol. Biol. 2431, 145–161 (2022).
Valadi, H. et al. Exosome-mediated transfer of mRNAs and microRNAs is a novel mechanism of genetic exchange between cells. Nat. Cell Biol. 9, 654–659 (2007).
Verweij, F. J. et al. Quantifying exosome secretion from single cells reveals a modulatory role for GPCR signaling. J. Cell Biol. 17, 1129–1142 (2018).
Forterre, A. et al. Myotube-derived exosomal miRNAs downregulate Sirtuin1 in myoblasts during muscle cell differentiation. Cell Cycle 13, 78–89 (2014).
McKenzie, A. J. et al. KRAS-MEK signaling controls Ago2 sorting into exosomes. Cell Rep. 15, 978–987 (2016).
Maimon, R. et al. Mir126-5p downregulation facilitates axon degeneration and NMJ disruption via a non–cell-autonomous mechanism in ALS. J. Neurosci. 38, 5478–5494 (2018).
Hak, K. K., Yong, S. L., Sivaprasad, U., Malhotra, A. & Dutta, A. Muscle-specific microRNA miR-206 promotes muscle differentiation. J. Cell Biol. 174, 677–687 (2006).
Abel, O., Powell, J. F., Andersen, P. M. & Al-Chalabi, A. ALSoD: a user-friendly online bioinformatics tool for amyotrophic lateral sclerosis genetics. Hum. Mutat. 33, 1345–1351 (2012).
Mytidou, C. et al. Muscle-derived exosomes encapsulate myomiRs and are involved in local skeletal muscle tissue communication. FASEB J. 35, e21279 (2021).
Ostrowski, M. et al. Rab27a and Rab27b control different steps of the exosome secretion pathway. Nat. Cell Biol. 12, 19–30 (2010).
Trajkovic, K. et al. Ceramide triggers budding of exosome vesicles into multivesicular endosomes. Science 319, 1244–1247 (2008).
Iguchi, Y. et al. Exosome secretion is a key pathway for clearance of pathological TDP-43. Brain 139(Pt12), 3187–3201 (2016).
Davis, S., Lollo, B., Freier, S. & Esau, C. Improved targeting of miRNA with antisense oligonucleotides. Nucleic Acids Res. 34, 2294–2304 (2006).
Sidibé, H. et al. TDP-43 stabilizes G3BP1 mRNA: relevance to amyotrophic lateral sclerosis/frontotemporal dementia. Brain 144, 3461–3476 (2021).
Koehler, L. C. et al. TDP-43 oligomerization and phase separation properties are necessary for autoregulation. Front. Neurosci. 16, 818655 (2022).
Piol, D., Robberechts, T. & Da Cruz, S. Lost in local translation: TDP-43 and FUS in axonal/neuromuscular junction maintenance and dysregulation in amyotrophic lateral sclerosis. Neuron 111, 1355–1380 (2023).
Ionescu, A., Altman, T. & Perlson, E. Looking for answers far away from the soma—the (un)known axonal functions of TDP-43, and their contribution to early NMJ disruption in ALS. Mol. Neurodegener. 18, 35 (2023).
Fernandopulle, M. S., Lippincott-Schwartz, J. & Ward, M. E. RNA transport and local translation in neurodevelopmental and neurodegenerative disease. Nat. Neurosci. 24, 622–632 (2021).
Dalla Costa, I. et al. The functional organization of axonal mRNA transport and translation. Nat. Rev. Neurosci. 22, 77–91 (2021).
Aoi, W. & Tanimura, Y. Roles of skeletal muscle-derived exosomes in organ metabolic and immunological communication. Front. Endocrinol. (Lausanne) 12, 697204 (2021).
Briese, M. et al. Loss of Tdp-43 disrupts the axonal transcriptome of motoneurons accompanied by impaired axonal translation and mitochondria function. Acta Neuropathol. Commun. 8, 116 (2020).
Nagano, S. et al. TDP-43 transports ribosomal protein mRNA to regulate axonal local translation in neuronal axons. Acta Neuropathol. 140, 695−713 (2020).
Gopal, P. P., Nirschl, J. J., Klinman, E. & Holzbaurb, E. L. F. Amyotrophic lateral sclerosis-linked mutations increase the viscosity of liquid-like TDP-43 RNP granules in neurons. Proc. Natl Acad. Sci. USA 114, E2466–E2475 (2017).
Patel, P. et al. Intra-axonal translation of Khsrp mRNA slows axon regeneration by destabilizing localized mRNAs. Nucleic Acids Res. 50, 5772–5792 (2022).
Farias, J., Holt, C. E., Sotelo, J. R. & Sotelo-Silveira, J. R. Axon microdissection and transcriptome profiling reveals the in vivo RNA content of fully differentiated myelinated motor axons. RNA 26, 595–612 (2020).
Sun, C. et al. The prevalence and specificity of local protein synthesis during neuronal synaptic plasticity. Sci. Adv. 7, eabj0790 (2021).
Wong, H. H.-W., Watt, A. J. & Sjöström, P. J. Synapse-specific burst coding sustained by local axonal translation. Neuron 112, 264–276 (2023).
Kuzniewska, B. et al. Mitochondrial protein biogenesis in the synapse is supported by local translation. EMBO Rep. 21, e48882 (2020).
Glock, C. et al. The translatome of neuronal cell bodies, dendrites, and axons. Proc. Natl Acad. Sci. USA 118, e2113929118 (2021).
Maciel, R. et al. The human motor neuron axonal transcriptome is enriched for transcripts related to mitochondrial function and microtubule-based axonal transport. Exp. Neurol. 307, 155–163 (2018).
Sahoo, P. K., Smith, D. S., Perrone-Bizzozero, N. & Twiss, J. L. Axonal mRNA transport and translation at a glance. J. Cell Sci. 131, jcs196808 (2018).
Lopez-Leal, R. & Court, F. A. Schwann cell exosomes mediate neuron–glia communication and enhance axonal regeneration. Cell. Mol. Neurobiol. 36, 429–436 (2016).
Court, F. A., Hendriks, W. T. J. J., MacGillavry, H. D., Alvarez, J. & Van Minnen, J. Schwann cell to axon transfer of ribosomes: toward a novel understanding of the role of glia in the nervous system. J. Neurosci. 28, 11024–11029 (2008).
López-Leal, R. et al. Schwann cell reprogramming into repair cells increases miRNA-21 expression in exosomes promoting axonal growth. J. Cell Sci. 133, jcs239004 (2020).
Bartel, D. P. Metazoan microRNAs. Cell 173, 20–51 (2018).
Farberov, L. et al. Multiple copies of microRNA binding sites in long 3′UTR variants regulate axonal translation. Cells 12, 233 (2023).
Mattioli, C. C. et al. Alternative 3′ UTRs direct localization of functionally diverse protein isoforms in neuronal compartments. Nucleic Acids Res. 47, 2560–2573 (2019).
Tushev, G. et al. Alternative 3′ UTRs modify the localization, regulatory potential, stability, and plasticity of mRNAs in neuronal compartments. Neuron 98, 495–511 (2018).
Villain, G. et al. miR-126-5p promotes retinal endothelial cell survival through setD5 regulation in neurons. Development 145, dev156232 (2018).
Santovito, D. et al. Noncanonical inhibition of caspase-3 by a nuclear microRNA confers endothelial protection by autophagy in atherosclerosis. Sci. Transl. Med. 12, eaaz2294 (2020).
Brooks, B. R. El escorial world federation of neurology criteria for the diagnosis of amyotrophic lateral sclerosis. J. Neurol. Sci. 124, 96–107 (1994).
Riva, N. et al. Motor nerve biopsy: clinical usefulness and histopathological criteria. Ann. Neurol. 69, 197–201 (2011).
Boillée, S. et al. Onset and progression in inherited ALS determined by motor neurons and microglia. Science 312, 1389–1392 (2006).
Gurney, M. E. et al. Motor neuron degeneration in mice that express a human Cu,Zn superoxide dismutase mutation. Science 264, 1772–1775 (1994).
Fernandopulle, M. S. et al. Transcription factor–mediated differentiation of human iPSCs into neurons. Curr. Protoc. Cell Biol. 79, e51 (2018).
Coenen-Stass, A. M. L. et al. Evaluation of methodologies for microRNA biomarker detection by next generation sequencing. RNA Biol. 15, 1145–1145 (2018).
Kohen, R. et al. UTAP: user-friendly transcriptome analysis pipeline. BMC Bioinformatics 20, 154 (2019).
Kozomara, A. & Griffiths-Jones, S. MiRBase: annotating high confidence microRNAs using deep sequencing data. Nucleic Acids Res. 42, D68–D73 (2014).
Magen, I. et al. microRNA-based predictor for diagnosis of frontotemporal dementia. Neuropathol. Appl. Neurobiol. 49, e12916 (2023).
Magen, I. et al. Circulating miR-181 is a prognostic biomarker for amyotrophic lateral sclerosis. Nat. Neurosci. 24, 1534–1541 (2021).
Magen, I. et al. Muscle microRNAs in the cerebrospinal fluid predict clinical response to nusinersen therapy in type II and type III spinal muscular atrophy patients. Eur. J. Neurol. 29, 2420–2430 (2022).
Love, M. I., Huber, W. & Anders, S. Moderated estimation of fold change and dispersion for RNA-seq data with DESeq2. Genome Biol. 15, 550 (2014).
Keren-Shaul, H. et al. MARS-seq2.0: an experimental and analytical pipeline for indexed sorting combined with single-cell RNA sequencing. Nat. Protoc. 14, 1841–1862 (2019).
Altman, T., Maimon, R., Ionescu, A., Pery, T. G. & Perlson, E. Axonal transport of organelles in motor neuron cultures using microfluidic chambers system. J. Vis. Exp. 2020, 60993 (2020).
Tsanov, N. et al. smiFISH and FISH-quant – a flexible single RNA detection approach with super-resolution capability. Nucleic Acids Res. 44, 1841–1862 (2016).
Silahtaroglu, A. N. et al. Detection of micrornas in frozen tissue sections by fluorescence in situ hybridization using locked nucleic acid probes and tyramide signal amplification. Nat. Protoc. 2, 2520–2528 (2007).
Ionescu, A. et al. Targeting the Sigma-1 receptor via pridopidine ameliorates central features of ALS pathology in a SOD1G93A model. Cell Death Dis. 10, 210 (2019).
Mead, R. J. et al. Optimised and rapid pre-clinical screening in the SOD1G93A transgenic mouse model of amyotrophic lateral sclerosis (ALS). PLoS ONE 6, e23244 (2011).
Sahoo, P. K. et al. Axonal G3BP1 stress granule protein limits axonal mRNA translation and nerve regeneration. Nat. Commun. 9, 3358 (2018).
Corradi, E. et al. Axonal precursor miRNAs hitchhike on endosomes and locally regulate the development of neural circuits. EMBO J. 39, e102513 (2020).
Acknowledgements
The Perlson laboratory is supported by the Human Frontiers Science Program, the Ministry of Health, State of Israel—JPND program, three grants from the Israel Science Foundation and the Muscular Dystrophy Association (grant numbers RGP0026/2020-102, 3-17160, 735/19, 3497/21, 794/24, 1063948, respectively) and by the Radala Foundation for ALS Research, the Sagol Center for Regenerative Medicine 2023–2024 award and the Ministry of Science and Technology, State of Israel (67982). Additionally, we would like to express our gratitude to L. Bikovski from the Myers Neuro-behavioral core facility at the Interdepartmental core facility, Faculty of Medicine, Tel Aviv University, for helping in the behavioral motor assays and to B. Barak, G. Levy and O. Ophir from the School of Psychological Sciences, Faculty of Social Sciences, Tel Aviv University, for helping with virus injection.
E.H. is the Mondry Family Professorial Chair and Head of the Andrea L. and Lawrence A. Wolfe Family Center for Research on Neuroimmunology and Neuromodulation. The Hornstein laboratory is funded by the Robert Packard Center for ALS Research at Johns Hopkins University; the Weizmann–Brazil Center for Research on Neurodegeneration at the Weizmann Institute of Science; the Israel Science Foundation (135/16, 3497/21, 424/22, 425/22 and 494/24); Target ALS; the United States–Israel Binational Science Foundation (2 021 181); Dr. Sydney Brenner and friends; Edward and Janie Moravitz; Yeda-Sela; Yeda-CEO; the Nella and Leon Benoziyo Center for Neurological Diseases; the Kekst Family Institute for Medical Genetics; the David and Fela Shapell Family Center for Genetic Disorders Research; the Vener New Scientist Fund; the Julius and Ray Charlestein Foundation; the Goldhirsh-Yellin Foundation; the Redhill Foundation; the Rothberg Charitable Trust; the Dr. Dvora and Haim Teitelbaum Endowment Fund; and the Anita James Rosen Foundation.
Ethics declarations
Competing interests
The authors declare no competing interests.
Peer review
Peer review information
Nature Neuroscience thanks Thomas Lloyd, Giampietro Schiavo and Benjamin Wolozin for their contribution to the peer review of this work.
Additional information
Publisher’s note Springer Nature remains neutral with regard to jurisdictional claims in published maps and institutional affiliations.
Extended data
Extended Data Fig. 1 TDP-43 peripheral pathology in SOD1 patients and SOD1 mouse models.
a) Immunofluorescent staining for pTDP-43 in intramuscular nerves within muscle biopsies of non-ALS (spinal stenosis), SOD1 (c.26 T > A), and sALS patients. Blue indicates NFH, Gray indicates pTDP-43 and colocalized pTDP-43 within NFH positive nerves (in the respective panel). Scale bar: 5 µm. b) Representative immunofluorescent images of TDP-43 in sciatic nerve longitudinal sections of SOD1G93A mice and their littermates (LM). Gray indicates TDP-43 and NFH-masked TDP-43 (in the respective panel), blue indicates NFH. Scale bar: 10 µm. c) Representative images of TDP-43 immunolabeling in sciatic nerve cross sections of p290 SOD1G37R mice and their littermates. Gray indicates TDP-43 and NFH-masked TDP-43 (in the respective panel), blue indicates NFH, yellow indicates S100β. Scale bar: 10 µm. d) Quantitative analysis of TDP-43 intensity within S100β region in sciatic nerve sections of p290 SOD1G37R mice and their littermates. Data is shown as the mean TDP-43 intensity in S100β mask ± SD. n = 26; 29 images from 3 mice in each condition. Two-tailed unpaired student’s t-test. ****p = 2.11×10⁻⁶. e) Representative images of pTDP-43 immunolabeling in sciatic nerve cross sections of p290 SOD1G37R mice and their littermates. Gray indicates pTDP-43 and NFH-masked pTDP-43 (in the respective panel), blue indicates NFH, yellow indicates S100β. Scale bar: 10 µm. f) Quantitative analysis of pTDP-43 intensity within S100β region in sciatic nerve sections of p290 SOD1G37R mice and their littermates. Data is shown as the mean pTDP-43 intensity in S100β mask ± SD. n = 27; 29 images from 3 mice in each condition. Two-tailed unpaired student’s t-test. **p = 0.0018. For a, immunofluorescent labeling for pTDP-43 in SOD1 patient repeated once for 1 patient. Labeling on non-ALS and ALS patients was repeated for 6 patients and 6 healthy controls. For b, representative images of experiment repeated in 3 mice per genotype.
Extended Data Fig. 2 TDP-43 Peripheral pathology in SOD1 mouse models.
a) Western blots of sciatic nerve axoplasms from 3 p120 B6SJL.SOD1G93A and 3 littermates for TDP-43 (43kD), pTDP-43 (43kD) and hSOD1 (17kD). Tubulin (55kD) was used as a loading control. A distinct 25kD additional band was observed in the TDP-43 blot of SOD1G93A samples, suggested to be C-terminal fragments, as previously reported10. b) Quantitative analysis of the pTDP-43/tubulin intensities within blots from sciatic nerve axoplasms of p120 B6SJL.SOD1G93A and littermates. n = 3 mice in each condition. Two-tailed unpaired student’s t-test, p = 0.5146. c) Representative western blot image and quantitative analysis of the TDP-43/tubulin intensities within blots from sciatic nerve axoplasms of p110 B6.SOD1G93A and littermates. n = 3 mice in each condition. TDP-43 (43kD), Tubulin (55kD). Two-tailed unpaired student’s t-test. n = 0.0582. d) Western blots of sciatic nerve axoplasms from 3 p357 SOD1G37R and 3 littermates for TDP-43 (43kD), pTDP-43 (43kD) and hSOD1 (17kD). Tubulin (55kD) was used as a loading control. A distinct 25kD additional band was observed in the TDP-43 blot of SOD1G37R samples, suggested to be C-terminal fragments as previously reported. e, f) Quantitative analysis of TDP-43/tubulin (e) and pTDP-43/tubulin (f) in sciatic nerve axoplasms of p357 SOD1G37R and littermates. n = 3 mice in each condition. Two-tailed unpaired student’s t-test, **p = 0.0081, *p < 0.0118. g) Western blots of gastrocnemius muscle lysates from 3 p120 B6SJL.SOD1G93A and 3 littermates for TDP-43 (43kD), pTDP-43 (43kD) and hSOD1 (17kD). Tubulin (55kD) was used as a loading control. h, i) Quantitative analysis of TDP-43/tubulin (h) and pTDP-43/tubulin (i) background subtracted thus the negative values in gastrocnemius muscles of B6SJL.SOD1G93A and littermates. n = 3 mice in each condition. Two-tailed unpaired student’s t-test, p = 0.1348(h), *p = 0.0355(i). j, k) Representative images and quantitative analyses of TDP-43/tubulin in gastrocnemius muscle lysates from p290 SOD1G37R (j) and P110 B6.SOD1G93A (k) mice versus their littermates. TDP-43 (43kD), Tubulin (55kD). n = 4 mice per condition (j); n = 3 mice per condition (k). Two-tailed, unpaired student’s t-test. **p = 0.0038(j), p = 0.7216(k).
Extended Data Fig. 3 TDP-43 pathology is non apparent in spinal cords of SOD1 mouse models.
a) Representative images and quantitative analysis of TDP-43/tubulin in spinal cord lysates from p110 B6.SOD1G93A mice and their littermates. TDP-43 (43kD), Tubulin (55kD). n = 4 mice per condition. Two-tailed, unpaired student’s t-test. p = 0.7451 b, c) Representative images (b) and quantitative analysis (c) for the percent of ventral motor neurons with nuclear pTDP-43 in spinal cords of p120 B6SJL.SOD1G93A mice and their littermates. Data are shown as the mean percent of ventral motor neurons with nuclear pTDP-43 ± SEM. n = 3 mice in each condition. Yellow indicates pTDP-43, blue indicates nuclei (DAPI), red indicates NeuN. Scale bars: 10 µm. d) Representative images and quantitative analysis of TDP-43/tubulin in spinal cord lysates from p290 SOD1G37R mice and their littermates. TDP-43 (43kD), Tubulin (55kD). n = 3 mice per condition. Two-tailed, unpaired student’s t-test. p = 0.2462 e, f) Representative images (e) and quantitative analysis (f) for the percent of ventral motor neurons with nuclear pTDP-43 in spinal cords of p290 SOD1G37R mice and their littermates. Data are shown as the mean percent of ventral motor neurons with nuclear pTDP-43 ± SEM. n = 3 mice in each condition. Yellow indicates pTDP-43, blue indicates nuclei (DAPI), red indicates NeuN. Scale bars: 10 µm. g–i) Representative images (g) and quantitative analysis (h-i) for the percent of ventral motor neurons with cytoplasmic (h) or nuclear (i) pTDP-43 in spinal cords of induced (-Dox; 2 weeks) TDP43∆NLS mice and non-induced controls (+Dox). Data are shown as the mean percent of ventral motor neurons with cytoplasmic/nuclear pTDP-43 ± SEM. n = 3 mice in each condition. Two-tailed student’s t-test, ***p = 0.0004(h), *p = 0.0293(i). Yellow indicates pTDP-43, blue indicates nuclei (DAPI), red indicates NeuN. Scale bars: 10 µm. j) Quantitative distribution analysis for the percent of ventral motor neurons with either nuclear TDP-43, cytoplasmic TDP-43 or equally distributed TDP-43 in spinal cords of p290 SOD1G37R mice and their littermates. Data are shown as the mean percent of TDP-43 positive neurons in the respective subcellular region ± SEM. Multiple unpaired t-test. p = 0.8013(mainly nuclear), p = 0.802(equally distributed) n = 3 mice from each condition.
Extended Data Fig. 4 Comparison of TDP-43 and pTDP-43 accumulation in NMJs of fast versus slow muscle fibers in SOD1 mouse models.
a) Representative immunofluorescent images of TDP-43 localization in NMJs from gastrocnemius muscle of induced TDP43∆NLS (-Dox; 2-weeks) and non-induced control (+Dox). Gray indicates TDP-43 and TDP-43:NFH 3D colocalization result (in the respective panel), blue indicates NFH, red indicates BTX. Scale bar: 10 µm. experiment repeated in 5 mice per genotype. b) Representative immunofluorescent images of pTDP-43 localization in NMJs from EDL muscle of p60 B6SJL.SOD1G93A and littermate control mice. Gray indicates pTDP-43 and pTDP-43:NFH 3D colocalization result (in the respective panel), blue indicates NFH, red indicates BTX. Scale bar: 10 µm. experiment repeated in 3 mice per genotype. c) Representative immunofluorescent images of pTDP-43 localization in NMJs from EDL muscle of p290 SOD1G37R and littermate control mice. Gray indicates pTDP-43 and pTDP-43:NFH 3D colocalization result (in the respective panel), blue indicates NFH, red indicates BTX. Scale bar: 10 µm. experiment repeated in 3 mice per genotype. d, e) Representative immunofluorescent images (d) and quantitative analysis (e) of TDP-43 in NMJs from EDL muscle of p290 SOD1G37R and littermate control mice. Gray indicates TDP-43 and TDP-43:NFH 3D colocalization result (in the respective panel), blue indicates NFH, red indicates BTX. Scale bar: 10 µm. Data are shown in violin density plots with markings of first, median and third quartiles of mean TDP-43 intensity to NFH/Synaptophysin intensity in NMJs. Two-tail unpaired student’s t-test. ****p = 2.57×10⁻⁵. n = 38 NMJs from 3 mice per condition. f) Quantitative analysis of the percent of pTDP-43 colocalization area in presynapses at NMJs of P60 B6SJL.SOD1G93A. Two-tail unpaired student’s t-test. **p = 0.0071. n = 33;21 NMJs from 3 mice per condition. g, h) Representative immunofluorescent images (g) and quantitative analysis (h) of pTDP-43 in NMJs from EDL muscle of p90 B6SJL.SOD1G93A and littermate control mice. Gray indicates pTDP-43 and pTDP-43:NFH 3D colocalization result (in the respective panel), blue indicates NFH, red indicates BTX. Scale bar: 10 µm. Data are shown in violin density plots with markings of first, median and third quartiles of mean pTDP-43 intensity to NFH intensity (left panel) or percent of pTDP-43 colocalization area in presynapses at NMJs. Two-tail unpaired student’s t-test. **p = 0.0021(pTDP-43 intensity), ****p = 4.8×10⁻⁹ (pTDP-43 area). n = 39;36 NMJs from 3 mice per condition. i, j) Representative immunofluorescent images of TDP-43 (i) and pTDP-43 (j) localization in NMJs from soleus muscles of p290 SOD1G37R and littermate control mice. Gray indicates TDP-43 and TDP-43:NFH 3D colocalization result (in the respective panel), blue indicates NFH, red indicates BTX. Scale bar: 10 µm. k) Quantitative analysis for the percent of NMJs with apparent TDP-43/pTDP-43 patch in soleus muscles from p290 SOD1G37R and littermate controls. Data are shown as the mean percent of NMJs with TDP-43 (left panel) or pTDP-43 (right panel) patch ± SEM. n = 3 mice per group. Two-tailed, unpaired t-test. p = 0.0746(TDP-43), p = 0.0636(pTDP-43). l) Quantitative analysis of TDP-43 (left panel) and pTDP-43 (right panel) intensity in NMJs from soleus muscle of p290 SOD1G37R and littermate control mice. Data are shown in violin density plots with markings of first, median and third quartiles of mean TDP-43 (left) or pTDP-43 (right) intensity to NFH/Synaptophysin intensity in NMJs. Two-tail unpaired student’s t-test. n = 44;41 (TDP-43), n = 82,52 (pTDP-43) NMJs from 3 mice per condition. ****p = 5.295×10⁻⁵ (TDP-43), p = 0.0899(pTDP-43).
Extended Data Fig. 5 TDP-43 mRNA localization and local translation in motor neuron axons.
a) Relative mRNA transcript levels in axons versus cell-bodies (soma) of Tardbp, Elavl1, Stau1, and Actb. Data are shown as fold change (F.C) of normalized counts in axons over soma for each mRNA transcript. Raw data reanalysis of axonal and soma RNA-seq from primary motor neurons (Rotem et al., 2017). b) Representative images of smFISH for β-actin and TDP-43 mRNAs compared with no probe control in primary motor neuron cell bodies. Gray indicates RNA FISH, green indicates phalloidin/HB9:GFP, blue indicates nuclei (DAPI). Red dashed line marks proximal axon shown in magnified insets. Scale bar: 15 µm. Experiment performed in 3 neuronal cultures. c-d) Representative images (c) and quantitative analysis (d) of TDP-43 immunolabeling of distal axons in MFC 4 days after localized transfection with TDP-43 siRNA mix or with control siRNA. Magenta indicates TDP-43, green indicates NFH. Scale bar: 10 µm. Data are shown in violin density plots with markings of first, median and third quartiles of mean number of TDP-43 puncta in 100 µm axons. Two-tailed unpaired student’s t-test. ****p < 1 × 10⁻¹⁴. n = 94;87 axons from 3 independently grown co-cultures. e) Representative immunofluorescent images of TDP-43 puro-PLA in a growth cone at a premature NMJ, and in a mature NMJ in healthy co-cultures. Blue indicates NFH, gray indicates BTX, yellow indicates TDP-43 puro-PLA, white dashed line indicates skeletal muscle margins (in NMJ panel, the entire region is over a skeletal muscle) Scale bar: 5 µm. Experiment repeated in 3 neuromuscular co-cultures.
Extended Data Fig. 6 Enrichment of extracellular vesicle machinery in post-synaptic apparatus of NMJs.
a) Representative images for the localization of CD63 (upper panel), CD81 (mid panel) and CHMP2A (lower panel) in healthy GC muscle NMJs. Blue indicates NFH, red indicates BTX, Dynamic blue-green-yellow indicates CD63/CD81/CHMP2A according to raw fluorescent intensity (blue=low; yellow=high). Scale bar: 10 µm. Experiment repeated 3 times (CD63, CD81) and 6 times for CHMP2A. b) Representative images for the localization of CD63 (upper panel), CD81 (lower panel) in NMJs within dissociated muscle fibers following enzymatic digestion of surrounding cells and connective tissues. Red indicates BTX, Dynamic blue-green-yellow indicates CD63/CD81 according to raw fluorescent intensity (blue=low; yellow=high). Scale bar: 10 µm. Experiment repeated 3 times. c) Quantitative analysis of CD81 raw fluorescent signal in synaptic versus extrasynaptic regions within the same muscle fiber. Two-tail paired student’s t-test. ****p = 7.68 × 10⁻⁵. n = 20 muscle fibers from 3 mice d) Representative images and 3D Imaris puncta colocalization analysis of extracellular vesicle machinery in postsynaptic apparatus of enzymatically denervated EDL muscle. White indicates BTX, yellow indicates CD-63, magenta indicates CD-81. Imaris puncta analysis was performed on BTX colocalization channels with CD-63 and CD-81. Scale bar: 10 µm. Experiment performed once. e) Representative max intensity projected (MIP) low magnification images (upper panel) and high magnification images of BTX-positive region (lower panel) of CD63-pHluorin signal in cultured primary muscle before (pre) and immediately after application of ammonium chloride (NH4Cl). Dynamic magenta-orange-white indicates CD63-pHluorin intensity in low magnification images. Lower panel: magenta indicates BTX, green indicates CD63-pHluorin signal. Scale bars: 50 µm; 10 µm in upper and lower panels respectively. Experiment repeated in 2 neuromuscular co-cultures.
Extended Data Fig. 7 miR-126a-5p regulates the mRNA of several predicted targets including the mouse and human mRNA of TDP-43, and is dysregulated in SOD1 NMJs.
a) Representative images of a 6DIV primary motor neuron culture infected with lentiviral (pLV) miR-126 GFP. Green indicates GFP. Scale bar: 100 µm. Repeated in 3 neuronal cultures. b) Quantitative RT-PCR for multiple predicted and non-predicted mouse mRNA targets of miR-126a-5p in primary motor neurons expressing LV-GFP versus LV-miR126-GFP. Data are shown as the mean relative expression of each target in LV-miR126-GFP over LV-GFP ± SEM. Two-way ANOVA with Holm-Sidak correction for multiple comparisons. n = 3 neuronal cultures per condition. p = 0.0003(TDP-43), p = 0.0286(C9orf72), p = 8.78 × 10⁻⁵(Caspase-3), p = 0.012(NRP1), p = 0.0003(DLK1), p = 0.0016(JNK3), p = 0.7869(FUS1), p = 0.0017(CRMP4), p = 0.999(SOD1), p = 0.999(G3BP1), p = 0.9346(Sema3A), p = 0.999(COX4), p = 0.992(COX7). c) Graphical illustrations of the human TDP-43 mRNA and two more predicted isoforms. Green indicates 3’UTRs, red marks the putative miR-126-5p target sites. d) Representative low magnification image of healthy IPSC-derived motor neurons (IPSC-MN; KOLF) infected with pLV-hSyn-miR126. Red indicates GFP in infected neurons. Scale bar: 150 µm. image e) Quantitative Taqman RT-PCR for miR-126-5p in human IPSC-MN (KOLF) expressing either pLV-Syn-miR126-GFP or pLV-Syn-GFP. Data are shown as the mean relative miR-126-5p expression ± SEM in miR-126 infected IPSC-derived motor neurons versus GFP infected ones. Two-tailed unpaired student’s t-test. n = 3 seperatly grown cultures. *p = 0.0162. f) Quantitative RT-PCR for human TDP-43 mRNA with primers targeting the coding sequence (CDS) in IPSC-derived motor neurons following 7 days of pLV-Syn-miR126 or pLV-Syn-GFP infection. Data are shown as the mean relative mRNA levels of human TDP-43 mRNA ± SEM. Two-tailed unpaired student’s t-test. n = 3 separately grown cultures. **p < 0.0042. g) Quantitative TaqMan RT-PCR for miR-126-5p in p290 SOD1G37R GC muscles versus p290 SOD1G37R SC. Data are shown as the mean relative level of miR-126-5p ± SEM. U6 was used as endogenous loading control. Two-tailed unpaired t-test. n = 5 mice in each group. *p = 0.0263(GC), p = 0.888(SC). h-i) Representative images (h) and quantification (i) of miR-126a-5p FISH in NMJs of p60 B6SJL.SOD1G93A EDL muscles versus littermate controls. Blue indicates nuclei (DAPI), green indicates NFH, magenta indicates miR-126a-5p FISH. Scale bar: 10 µm. Data are shown in violin distribution plots of the miR-126a-5p puncta per NMJ with markings of first, median and third quartiles. Two-tailed unpaired student’s t-test. n = 15; 33 NMJs from 3 mice in each condition. ****p = 3.689 × 10⁻⁷.
Extended Data Fig. 8 miR-126-5p enhances neuronal growth of SOD1G93A primary motor neurons.
a–c) Representative phase images with axonal marking (a) and quantification of neurite length (b) and cell-body cluster area (c) in WT, SOD1G93A or miR-126-GFP infected-SOD1G93A primary motor neurons at 3DIV. Blue, red and green segmented lines indicate the neurite tracing. Scale bar: 100 µm. Data are shown as the mean neurite length/cell body cluster area (mm/mm2) ± SEM (c), or cell body cluster area (area/mm2) ± SEM (d). n = 10; 15; 15 wells (over 6,000 neurons analyzed in every condition). One-way ANOVA with Holm-Sidak correction, **p = 0.00942(b), ****p = 0.00002(b), p = 0.1065(b), ****p = 5.41×10⁻⁸(c), *p = 0.0467. d) Representative image of pLV-miR-126 GFP infected primary motor neurons cultured in the proximal compartment of microfluidic chambers. Green indicates GFP. Scale bar: 100 µm.
Extended Data Fig. 9 miR-126a-5p overexpression in vivo.
a-b) Representative images of sciatic nerve cross section (a) and phrenic nerve in the diaphragm (b) of control animals injected with AAV PhP.Eb miR-126 viral particles. Green indicates GFP, red indicates NFH. Scale bars: 200 µm. c) Quantitative Taqman RT-PCR analysis of miR-126a-5p expression in SC, GC and brains of GFP-infected versus miR126-infected healthy mice. Data are shown as the mean relative miR-126a-5p level ± SEM. n = 3 mice in each condition. Two-tailed unpaired student’s t-test, *p = 0.0135(SC), 0.026(GC), 0.0363(Brain). d-e) Catwalk gait analysis of WT and SOD1G93A mice infected with either GFP or miR126, at symptomatic (p90) and late symptomatic (p130) stages. Data are shown as the mean stand duration (d; seconds) and % base of support on 4 limbs (e). n = 8 mice in each group. One-way ANOVA with Holm-Sidak correction. *p = 0.0277(d; p90; WT-GFP vs. SOD-GFP, and SOD1-GFP vs. SOD1-miR), p = 0.2587(d; p130; WT-GFP vs. SOD-GFP, and SOD1-GFP vs. SOD1-miR), **p = 0.0091(e; p90; WT-GFP vs. SOD-GFP, and SOD1-GFP vs. SOD1-miR), *p = 0.0143(e; p130; WT-GFP vs. SOD-GFP, and SOD1-GFP vs. SOD1-miR). f, g) Representative images (f) and quantification (g) of the hindlimb splay reflex in SOD1G93A mice and their littermates infected with either AAV PhP.Eb GFP, or with AAV PhP.Eb miR-126-GFP. Data are shown as the percent of mice who presented normal splay reflex ± SEM. n = 8; 8; 7; 7 mice in each group. Non-parametric Kruskal-Wallis test, *p < 0.02(WT-GFP vs. SOD1-GFP), *p = 0.0258(SOD1-GFP vs. SOD1-miR). h, i) In vivo longitudinal tracking of mouse weight (h) and survival (i) in all experimental groups. In (h), data are shown as the mean weight gain/loss at every timepoint compared with weight on injection day ± SEM. In (i), data are shown in a Kaplan-Maier survival curve starting at p150 (age of mice). n = (8,8;WT),(7,7;SOD1G93A) mice in each group. For a,b – images are representative for 3 similarly injected mice.
Extended Data Fig. 10 IPSC-derived co-culture differentiation and NMJ formation.
a) Representative images from the distal (NMJ) compartment IPSCC-derived co-culture of healthy (KOLF) motor neurons and skeletal muscles. Blue indicates NFH, gray indicates BTX, magenta indicates Titin. White dashed line indicates NMJ region shown in inset. Scale bar: 20 µm. b-c) Quantitative analysis of axonal pTDP-43 fraction (b) and axonal degeneration index (c) in iPSC-derived co-cultures of SOD1A5V, TDP-43M337V, and their isogenic control (KOLF). Data in (b) are shown in violin density plots of pTDP-43 puncta area out of NFH area of axons at the NMJ compartment with marking of first, median, and third quartiles. n = 21; 26, 18 imaging fields from 3 independently grown neuromuscular co-cultures. One-way ANOVA with Holm-Sidak correction. **p = 0.0064, ****p = 4.4 × 10⁻¹⁰. Data in (c) are shown as the mean NFH degeneration index of axons in the NMJ compartment ± SD. n = 28; 23; 18 imaging fields from 3 neuromuscular co-cultures. One-way ANOVA with Holm-Sidak correction. ****p = 4.66 × 10⁻⁵(SOD1A5V), 1.96 × 10⁻⁵(TDP43M337V). d) Representative image for lentivirus-infected IPSC-MN and IPSC-muscles in co-culture within MFC. Green in IPSC-MN (upper compartment) indicates pLV-hSyn-miR126-GFP, Green in IPSC-muscles (lower compartment) indicates pLV-CMV-miR126-GFP. Scale bar: 150 µm. e) Representative immunofluorescent images for pTDP-43 nuclear localization in SOD1A5V and TDP-43M337V IPSC-MN in the proximal MFC compartment of co-cultures infected with either pLV-hSyn-GFP or pLV-hSyn-miR126-GFP. Blue indicates NFH, gray indicates pTDP-43. White dashed square marks the IPSC-MN magnified in the inset. Scale bar: 20 µm. For a,d,e experiments repeated in 3 neuromuscular co-cultures.
Supplementary information
Supplementary Information
Supplementary Figs. 1–8 and legends and Supplementary Tables 1–5.
Supplementary Tables 1–5
Supplementary Table 1 – Axonal mRNA and miRNA sequencing after muscle EV administration. Tables contain complete lists of mRNA and miRNA sequenced from cultured neuronal axons treated with muscle-derived EVs compared to untreated cultures. Data are shown as log2 fold change of EV-treated/untreated, base mean, P value and adjusted P value. Wald test with correction for multiple comparisons. Supplementary Table 2 – Small RNA-seq of muscle-derived EVs and their culture lysates. Table contains the complete list of miRNA identified in extracellular vesicles and in whole muscle-cell lysate samples. Data are shown as log2 fold change of EV/whole-cell lysate, base mean, P value and adjusted P value. Wald test with correction for multiple comparisons. Supplementary Table 3 – miR-126-5p-predicted ALS mRNAs. Table contains a list of ALS-associated genes taken from the ALSoD website, which was further integrated with the respective hsa-miR-126-5p TargetScan data for each gene, including number and type of miR-126-5p targeting sites, predicted strength of interaction and a category defining the gene association to ALS defined by three sources. Supplementary Table 4 – Table including all mmu-Tardbp mRNA isoforms, their RPKM values in axonal RNA deep sequencing by Rotem et al.27 and the number of predicted miR-126a-5p sites for each. Supplementary Table 5 – Methods tables. File includes several sheets with tables belonging to the methods section—for example, patient information and primer/probe sequences.
Supplementary Video 1
Muscle-EV release enriched in postsynaptic compartments. Representative live imaging video of a postsynaptic compartment of a primary skeletal muscle expressing CD63-pHluorin in coculture with primary motor neurons. Video depicts a skeletal muscle-expressed CD63-pHluorin signal is enriched in postsynaptic BTX-positive regions. Green indicates CD63-GFP, magenta indicates BTX. Insets focus on a BTX positive patch in the muscle. Scale bar: 10 µm.
Supplementary Video 2
Muscle-EV uptake by a presynaptic motor axon. Representative live imaging video of a primary skeletal muscle expressing CD63-GFP in contact with a primary motor neuron axon. Video depicts a skeletal muscle-derived CD63-GFP tethered and taken by an axonal growth-cone. Magenta indicates CD63-GFP, green indicates cholera toxin subunit B-conjugated Alexa-647 in motor axons. Arrowhead indicates muscle-derived EVs. Scale bar: 10 µm.
Supplementary Video 3
Muscle derived CD-63 colocalizes and co-transports with axonal lysosomes. Representative live imaging video of muscle-derived CD63-GFP and lysotracker co-transport in axons within a co-culture with CD63-GFP expressing primary skeletal muscles. Magenta indicates lysotracker, green indicates CD63-GFP. Yellow arrowheads indicate co-transported CD-63 and lysotracker. Scale bar: 5 µm.
Supplementary Video 4
Muscle-derived Ago2-GFP transported in axons. Representative live imaging video of Ago2-GFP transporting in axons within a co-culture of Ago2-GFP expressing primary skeletal muscles. Axon morphology in the phase layer, orange indicates Ago2-GFP.
Supplementary Video 5
Muscle-derived Ago2-GFP transported in axons. Representative live imaging video of Ago2-GFP transporting in axons within a co-culture of Ago2-GFP expressing primary skeletal muscles. Axon morphology in the phase layer, orange indicates Ago2-GFP.
Supplementary Figures Source Data
Supplementary Data – Source data for supplementary figures.
Rights and permissions
Open Access This article is licensed under a Creative Commons Attribution-NonCommercial-NoDerivatives 4.0 International License, which permits any non-commercial use, sharing, distribution and reproduction in any medium or format, as long as you give appropriate credit to the original author(s) and the source, provide a link to the Creative Commons licence, and indicate if you modified the licensed material. You do not have permission under this licence to share adapted material derived from this article or parts of it. The images or other third party material in this article are included in the article’s Creative Commons licence, unless indicated otherwise in a credit line to the material. If material is not included in the article’s Creative Commons licence and your intended use is not permitted by statutory regulation or exceeds the permitted use, you will need to obtain permission directly from the copyright holder. To view a copy of this licence, visit http://creativecommons.org/licenses/by-nc-nd/4.0/.
About this article
Cite this article
Ionescu, A., Ankol, L., Ganapathy Subramaniam, A. et al. Muscle-derived miR-126 regulates TDP-43 axonal local synthesis and NMJ integrity in ALS models. Nat Neurosci 28, 2201–2216 (2025). https://doi.org/10.1038/s41593-025-02062-6
Received: 14 December 2023
Accepted: 18 August 2025
Published: 03 October 2025
Version of record: 03 October 2025
Issue date: November 2025
DOI: https://doi.org/10.1038/s41593-025-02062-6