.png)

Main
Autism spectrum disorder (ASD) is often explained as a manifestation of the atypical integration of diverse neural information1,2,3. Motivated by this concept, many studies searched for the biological etiology of ASD in global brain dynamics4,5,6,7,8,9, which are closely linked with neural information processing10,11,12,13,14,15. Our previous study also reported that, in both adults and children with ASD, the strength of their core autistic traits was correlated with the rigidity of global neural dynamics, which was quantified as an atypically reduced frequency of a specific brain-state transition16,17.
Nevertheless, we do not know whether such rigidity of global brain dynamics has causal links with autistic traits. Furthermore, the brain mechanisms by which neural rigidity would induce heterogeneous autistic behaviors remain unclear.
Here, to answer these questions, we investigated whether modification of neural rigidity changed ASD-related behaviors using transcranial magnetic stimulation (TMS). Moreover, by tracking TMS-induced neural and behavioral alterations, we probed the brain process by which the noninvasive neural intervention induced diverse behavioral effects.
To evaluate behavioral effects, this study focused on cognitive inflexibility8,18,19, perceptual overstability18,20,21,22 and atypical nonverbal information processing23,24,25,26 in autistic individuals. We chose these three traits because they represent both the social and nonsocial core characteristics of ASD along with its sensory traits20,21 and have been linked to neural rigidity seen in autism16,17,18,23,27,28. First, cognitive inflexibility is associated with repetitive restricted behaviors (RRBs) in ASD17,18, which has been correlated with neural rigidity in autism16. In addition, perceptual overstability shares its neuroanatomical basis with cognitive inflexibility18; thus, we hypothesized that perceptual overstability in autism should also correlate with neural rigidity in ASD. Regarding the atypical nonverbal information processing in ASD, this social trait is known to closely correlate with the clinical score of autistic sociocommunicational traits23,27,28, which are often explained by neural rigidity in autism16,17. Given these findings, this study focused on these three autistic behaviors and hypothesized that mitigating neural rigidity might reduce them.
These three behaviors were measured in the following three different tests: a spontaneous task-switching test for cognitive inflexibility (Fig. 1a)18,29,30, a test of bistable visual perception for perceptual overstability (Fig. 1b)18,20,21,22 and a friend-or-foe test for atypical nonverbal information processing (Fig. 1c)27,28.

We used three tests to measure three different autistic behaviors. a, In a spontaneous task-switching test, the participants conducted one of two choice tasks and were allowed to switch between them freely. The task repetition length was used as a metric for cognitive inflexibility. b, In a test of bistable visual perception, we presented participants with a structure-from-motion stimulus and measured perceptual overstability by calculating the median of the percept duration. c, In a friend-or-foe test, participants were asked to judge whether an actor was friendly or hostile to themselves after hearing the actor speak a positive/negative word with incongruent facial and vocal expressions. The decisions based on facial and voice expressions were classified into NVJ, the proportion of which was used as a metric to assess the skill of nonverbal social information processing; VJ, verbal information-based judgement. d, To measure neural rigidity in autism, we put network-wise rsfMRI signals into an energy landscape analysis, which can depict brain dynamics as a ball moving on a hypothetical energy landscape; DAN, dorsal attention network; VAN, ventral attention network; CON, cingulo-opercular network; AN, auditory network. e, To control brain dynamics, we used BDNS, which consists of offline fMRI/EEG experiments and an online EEG/TMS experiment and can stimulate a focal brain area only when the whole-brain neural activity dwells in a specific brain state. In the offline part, we performed energy landscape analysis with rsfMRI and EEG data, separately. The offline EEG-based results were validated by comparing them to the rsfMRI-based results before they were used to prepare the information sheet for the following online brain-state classification. Using the information sheet, we conducted real-time brain-state classification and performed the brain-state-driven TMS in the online EEG/TMS experiment. f, Flow chart showing the overall study design. The notations 2w and 2mth represent 2-week and 2-month intervals, respectively; Exp, experiment.
We assessed the rigidity of global brain dynamics using energy landscape analysis16,31,32 because this analysis can depict collective neural dynamics, which are typically hidden in complex whole-brain time series datasets, as ball movements between different attractors (that is, brain states) on a hypothetical energy landscape (Fig. 1d). Such an illustration of global brain dynamics enables us to calculate frequencies of brain-state transitions and quantify neural rigidity. In fact, this approach identified atypical brain-state dynamics underlying various neuropsychiatric conditions, including depression33, Alzheimer’s disease34, schizophrenia35 and autism16,17.
To investigate the behavioral effects of the mitigation of neural rigidity in autism, we used a brain-state-driven neural stimulation (BDNS; Fig. 1e)36, which was developed by combining functional magnetic resonance imaging (fMRI), electroencephalogram (EEG), TMS and energy landscape analysis. This noninvasive neural stimulation system entails monitoring attractor-based brain dynamics in a real-time manner and then delivering a short pulse of TMS only when a participant’s brain stays at a specific attractor (that is, brain state). Thanks to this state-dependent approach, BDNS can efficiently control brain-state dynamics and enable us to identify dynamically changing brain–behavior causality36, which is often difficult to detect in conventional TMS protocols37.
Using these behavioral tests, data-driven analysis and brain-state-triggered TMS, we examined how mitigation of neural rigidity affects autistic behaviors.
This study reports on the outcome of six inter-related experiments and one numerical simulation (Fig. 1f). In Experiment 1 (Supplementary Fig. 1), we collected resting-state fMRI (rsfMRI) and EEG data from 50 participants with ASD and 50 sex-, age- and intelligence-matched typically developing (TD) individuals (Supplementary Tables 1 and 2) and calculated brain dynamics for each participant.
In a subsequent numerical simulation and Experiment 2 (Supplementary Fig. 2–4), we exploratorily searched for the BDNS protocol that would increase neural flexibility in autism. We adopted such a brute-force approach because previous studies linked autistic behaviors to many and various brain regions and networks, including of the frontoparietal network (FPN)38,39 and sensorimotor network (SMN)38,40.
Experiments 3 and 4 assessed the behavioral effects of BDNS (Supplementary Fig. 5 and 6), and Experiments 5 and 6 investigated the latent neural processes by which BDNS changed the atypical perceptual and social traits (Supplementary Fig. 7 and 8).
TD individuals participated only in Experiment 1, whereas the 50 adults with ASD were asked to participate in all six experiments. However, 10 of these participants dropped out of the study in Experiment 4; thus, we conducted Experiments 4, 5 and 6 with the remaining 40 adults with ASD.
Results
Experiment 1: neural rigidity in autism
First, using energy landscape analysis, we examined whether autistic participants showed neural rigidity as seen in our previous studies16,17.
After confirming that a pairwise maximum entropy model (MEM; a basis for energy landscape analysis) was well fitted to the rsfMRI data recorded from both the ASD and TD groups (fitting accuracy: 93.6–98.3% in ASD and 93.8–98.1% in TD), we found that, as seen in our prior work16,17, the energy landscapes for ASD and TD shared four similar brain states (similarity, r7 > 0.82, PBonferroni < 0.05; Fig. 2a). Based on this resemblance, we labeled the two most stable brain states as major states and the other two as minor states, as we did in previous studies16,17.

a, rsfMRI-based energy landscape analysis showed that individuals with ASD and TD individuals shared four similar brain states with the same four local minima. We classified the two largest brain states into major states and the other states into minor states; *r > 0.82; freq, frequency. b, Energy barriers from the major states to the minor states were higher in ASD, and the transition (trans) frequency from the major states to the minor states decreased in ASD (t98 > 6.5, P < 10–5 in a two-sample two-sided t-test); *PBonferroni < 0.05. c,d, Transitions between the two major states via either of the minor states (‘Indirect transitions’; c) were rare in ASD (d; t98 = 12.2, P < 10–5 in a two-sample two-sided t-test). e–h, Atypically reduced indirect transition frequency was correlated with ASD severity (e), task repetition length (f), percept duration (g) and proportion of NVJ (h; | r48 | > 0.39); *PBonferroni < 0.05. i, In ASD, task repetition length and percept duration were prolonged, whereas NVJ proportion was smaller (t98 > 9.5, P < 10–5 in two-sample two-sided t-tests). Error bars indicate s.e.m.; *PBonferroni < 0.05. j, Task repetition length was associated with scores for RRB (F2,27 = 9.4, PBonferroni < 0.05 in one-way analysis of variance). k, NVJ proportion was correlated with scores for sociocommunicational traits (r48 ≤ –0.41; *PBonferroni < 0.05); comm, communication. l–n, An offline EEG analysis qualitatively captured the same energy landscapes (l); *r > 0.80. Indirect transition frequency was reduced in ASD (m; t98 = 9.5, P < 10–5 in a two-sample two-sided t-test) and correlated with autistic behaviors (n; | r48 | > 0.36; *PBonferroni < 0.05). o,p, An online EEG analysis accurately predicted which of the four states appeared at each time point (o) and triggered TMS during the designated brain state (p, top) with short latency (p, bottom). Each dot represents a participant. Box plots in b, d and m represent the range between the first quartile (Q1) and third quartile (Q3) of the data with a median line. The bottom and top whiskers show Q1 – 1.5 × (Q3 – Q1) and Q3 + 1.5 × (Q3 – Q1).
Despite such similarity, energy barriers from either of the two major states to both minor states were higher in the ASD group than in the TD group (t98 = 12.1, P < 10–5, η2 = 0.60 in a two-sample t-test; Fig. 2b, top). These atypically tall energy barriers obstructed transitions from the major states to the minor states (t98 = 6.5, P < 10–5, η2 = 0.30; Fig. 2b, bottom), resulting in less frequent transitions between the two major states via one of the minor states (henceforth ‘indirect transition’; Fig. 2c,d; t98 = 12.2, P < 10–5, η2 = 0.60).
The frequency of indirect transitions was negatively correlated with the overall severity of ASD, as indicated by the total Autism Diagnostic Observation Schedule (ADOS) score (r48 = –0.59, 95% confidence interval (CI) = –0.75 to –0.37, PBonferroni < 0.05; Fig. 2e), cognitive inflexibility (r48 = –0.63, 95% CI = –0.77 to –0.43, PBonferroni < 0.05; Fig. 2f) and perceptual overstability (r48 = –0.46, 95% CI = –0.65 to –0.21, PBonferroni < 0.05; Fig. 2g), and was positively correlated with atypical nonverbal information processing (for which a lower score indicates more atypical processing; r48 = 0.39, 95% CI = 0.13 to 0.60, PBonferroni < 0.05; Fig. 2h). All three behavioral indices showed significant differences between the ASD and TD groups (t98 > 9.5, P < 10–5, η2 > 0.47; Fig. 2i).
Moreover, these autistic behaviors were associated with relevant clinical scores for ASD. Task repetition length (an index for cognitive inflexibility) was linked to the clinical score for repetitive restrictive behaviors (RRBs) in ASD (ADOS-2 RRB score, F2,27 = 9.4, PBonferroni < 0.05, η2 = 0.41 by one-way analysis of variance; Fig. 2j), whereas the nonverbal information-based judgments (NVJ) proportion (a metric for nonverbal information processing) correlated with scores for the social and communication traits of ASD (ADOS-2 social and communication, r48 ≤ –0.41, PBonferroni < 0.05; Fig. 2k).
These results show that the neural rigidity observed in previous studies in individuals with ASD16,17 is replicated in the current ASD cohort. In particular, the correlations between brain dynamics and the three behavioral metrics indicate the possibility that enhancing indirect transition may alter both social and nonsocial ASD-associated behaviors.
Comparison of fMRI- and EEG-based brain dynamics
The following BDNS experiments required accurate real-time brain-state monitoring using EEG data. To prepare for such brain monitoring, we first conducted offline energy landscape analysis of EEG data obtained from the same participants and examined whether the EEG-based brain dynamics were similar to those based on the rsfMRI data.
As in the rsfMRI-based analysis, the pairwise MEM was accurately fitted to the EEG data in all individuals (fitting accuracy: 82.4–95.8% in ASD and 83.1–96.9% in TD), and the ASD and TD groups shared a similar energy landscape structure as the same four local minima (Fig. 2l, left and middle) and four similar brain states (r7 > 0.80, PBonferroni < 0.05; Fig. 2l, right). Moreover, these EEG-based four local minima were the same as the rsfMRI-based ones (Fig. 2a), and the brain activity patterns for the four brain states were also similar to those observed in the rsfMRI data (r7 > 0.85, PBonferroni < 0.05). These similarities allowed us to define indirect transition in the same manner as in the rsfMRI analysis.
As seen in the rsfMRI-based brain dynamics, the indirect transition frequency based on the EEG data was significantly reduced in the ASD group (t98 = 9.5, P < 10–5, η2 = 0.48; Fig. 2m), and such neural rigidity showed the same associations with behavior (Fig. 2n). Indirect transition frequency was negatively correlated with the overall clinical severity of ASD (r48 = –0.36, 95% CI = –0.58 to –0.10, PBonferroni < 0.05), cognitive inflexibility (r48 = –0.41, 95% CI = –0.62 to –0.15, PBonferroni < 0.05) and perceptual overstability (r48 = –0.36, 95% CI = –0.58 to –0.10, PBonferroni < 0.05) and positively correlated with atypical nonverbal information processing (r48 = 0.39, 95% CI = 0.13 to 0.60, PBonferroni < 0.05).
These results show that the EEG-based energy landscape analysis qualitatively captured the same brain dynamics as the rsfMRI-based analysis.
Performance of real-time brain-state monitoring
Using the results of the offline EEG analysis, we then rehearsed online EEG analysis and examined the performance of real-time brain-state monitoring.
To this end, we first prepared an information sheet to classify binary EEG activity at each time point into one of the four brain states. Next, we preprocessed the same raw EEG data in the same manner that would be adopted in the online EEG analysis in the BDNS. Then, by comparing the preprocessed EEG signals to the information sheet, we converted the EEG data into a sequence of brain-state dynamics. Finally, for each participant, we compared this online EEG-based brain-state sequence with those revealed by the offline energy landscape analysis of the same EEG data and found sufficient similarity between them (similarity >74.0%; Fig. 2o). Moreover, we confirmed that this online brain-state monitoring system enabled us to trigger neural stimulation during a specific brain state (accuracy >84.0% and latency <0.68 ms; Fig. 2p).
These results suggest that the following BDNS could monitor brain-state dynamics in an near-real-time manner and trigger TMS during a designated brain state accurately.
Numerical analysis: target network and stimulation timing
Next, we searched for a BDNS protocol that would increase the frequency of indirect transitions in participants with ASD (Fig. 3a). First, we performed a numerical simulation for each participant and searched for which brain network should be stimulated/inhibited for the largest enhancement of indirect transition frequency. This brute-force search revealed that, in all autistic individuals, only excitatory stimulation of the FPN increased indirect transition frequency (Fig. 3b), which was confirmed at the group level (t49 = 18.4, PBonferroni < 0.05, η2 = 0.27).

a, Optimal BDNS should change the energy landscape structure and increase indirect transition frequency. b, A numerical simulation suggested that only excitatory stimulation of the FPN should enhance indirect transition frequency (t49 = 18.4, PBonferroni < 0.05 in a one-sample two-sided t-test). Error bars indicate s.e.m. PBonferroni < 0.05 in a one-sample two-sided t-test. c, The blue lines show the group-level energy landscape structure at baseline, whereas the red lines indicate ones that should appear when we increase FPN activity. d,e, At an individual level, FPN activation (FPN+) should reduce the energy barrier heights from major state 1 to the two minor states (d; t49 > 12.2, *PBonferroni < 0.05 in paired two-sided t-tests) and increase the transition frequencies from major state 1 to the two minor states (e; t49 > 9.4, *PBonferroni < 0.05 in paired two-sided t-tests). f, Mediation analysis showing that the lower energy barriers from major state 1 to the two minor states enhances the transitions from major state 1 to the two minor states, increasing the indirect transition frequency (R2 = 0.65, P < 10–5 for mediation effect); **P < 0.01 and ***P < 0.001. g,h, To examine which of the 25 FPN regions (g) should be activated to increase total FPN activity, we calculated within-network FC and identified three FPN regions whose within-network FC was larger than the average across the 25 FPN regions in ASD (that is, greater than mean + s.d.; data in h show data from Participant 1; circles represent the 50 individuals with ASD); Rt, right; ROI, region of interest. i, We then compared the BDNS-induced neural effects between the three FPN regions and found the largest increase in indirect transition frequency when the right SPL was activated (t31 > 3.5, *PBonferroni < 0.05 in two-sample two-sided t-tests). j, We also examined when to stimulate the right SPL and found that the increase in indirect transition frequency was maximized when TMS was administered while the participants’ brain activity patterns stayed in major state 1 (t23 > 6.8, PBonferroni < 0.05 in two-sample two-sided t-tests).
The results of this numerical simulation also suggested the mechanism by which FPN activation would change the energy landscape structure and facilitate indirect transition. As shown in a group-level analysis (Fig. 3c), FPN activation should lower the energy barriers from major state 1 to the two minor states (t49 > 12.2, PBonferroni < 0.05, η2 > 0.19; Fig. 3d), which would promote the transitions from major state 1 to the minor states (t49 > 9.4, PBonferroni < 0.05, η2 > 0.16; Fig. 3e). A mediation analysis indicated that these structural changes in the energy landscape would consequently increase the indirect transition frequency (R2 = 0.65, P < 10–5 for mediation effect; Fig. 3f).
Furthermore, this mechanism suggested when to activate the FPN. Given that the increase in the transition from major state 1 would be key for enhancing the indirect transition frequency, the FPN should be activated while the brain dwells in major state 1.
Numerical analysis: target FPN region
We then searched for an FPN region whose activation would lead to an increase in total FPN activity. To this end, we first calculated functional connectivity (FC) between all 25 FPN regions (Fig. 3g) and specified FPN regions with the largest within-network FC. Theoretically, the neural activity of the brain region exhibiting large within-network FCs should be highly correlated with those of the other areas in the network, and the external activation of such a hub region would increase the activity of the entire network.
We found that, in all autistic participants, the right superior parietal lobule (SPL), right inferior parietal lobule (IPL) and inferior frontal gyrus (IFG) showed substantially greater FC than the overall average of the within-network FC (threshold: mean + s.d.; see Fig. 3h for an FC matrix seen in Participant 1 with ASD).
Experiment 2: optimal BDNS protocol
We then narrowed down the three FPN regions to one by conducting a sham-controlled cross-over BDNS experiment (Experiment 2.1; Fig. 1e), in which 48 pseudorandomly selected individuals with ASD underwent BDNS or sham stimulation over one of the three target brain regions while their brain activity patterns dwelled in major state 1. In the BDNS condition, we administered a train of four monophasic TMS pulses (200 Hz) during the specific brain state because the TMS protocol is known to increase neural activity of the target area36,41,42.
As a result, this experiment found the largest increase in the indirect transition frequency when the right SPL was stimulated (t31 > 3.5, PBonferroni < 0.05, η2 > 0.28; Fig. 3i).
Moreover, in another experiment (Experiment 2.2), we confirmed that this BDNS over the right SPL yielded a significant neural effect only when we administered the excitatory TMS while the brain activity pattern dwelled in major state 1 (t23 > 6.8, PBonferroni < 0.05, η2 > 0.67; Fig. 3j).
As a comparison, we found that a conventional 30-min repetitive TMS (rTMS)41,43 over the same right SPL, which did not monitor brain-state dynamics, failed to modify indirect transition frequency (t49 = 1.3, P = 0.2, η2 = 0.04). Note that the BDNS effects were evaluated by comparing them to those seen under sham conditions and not to those observed under rTMS conditions.
These results indicate that the optimal BDNS protocol to increase the indirect transition frequency in autism should be an excitatory TMS over the right SPL while whole-brain neural activity patterns dwell in major state 1.
Experiment 3: single BDNS session
Next, we measured the behavioral effects of this BDNS protocol (Fig. 4a) and found that, compared to the sham condition, a single BDNS session reduced cognitive inflexibility (t49 = 10.3, P < 10–5, η2 = 0.17) but not the other two ASD-associated behaviors (t49 < 1.9, P > 0.24; Fig. 4b). This BDNS-induced change in cognitive inflexibility was correlated with changes in neural rigidity (r48 = 0.45, 95% CI = 0.20 to 0.65, P < 0.05; Fig. 4c). These neural and behavioral effects were moderately correlated with the accuracy of real-time brain-state monitoring (that is, the fitting accuracy of the pairwise MEM in the offline EEG analysis; | r48 | ≥ 0.27, P ≤ 0.05).

a, We first examined the behavioral effects of a single BDNS in a sham-controlled cross-over experiment using 50 individuals with ASD (Experiment 3). The effects of BDNS were defined as the behavioral differences induced by the BDNS session (∆ in BDNS) and those observed in the sham condition (∆ in Sham). The stimulation (stim) type was randomized across participants. b, Task repetition length showed a significant change in the BDNS session (t49 = 10.3, P < 10–5 in a paired two-sided t-test), whereas the other two behavioral indices did not. Box plots represent the range between the first quartile (Q1) and third quartile (Q3) of the data with a median line. The bottom and top whiskers show Q1 – 1.5 × (Q3 – Q1) and Q3 + 1.5 × (Q3 – Q1); *PBonferroni < 0.05. c, BDNS-induced change in task repetition length was correlated with that in indirect transition frequency (r48 = 0.45, P < 0.05). d, To examine the longitudinal effects of BDNS, we conducted a sham-controlled cross-over experiment (Experiment 4), in which we administered weekly BDNS to individuals with ASD over 12 weeks. rsfMRI data were collected weekly, whereas the behavioral data were recorded biweekly. Due to its length, ten participants did not complete this experiment. e–h, In the longitudinal experiment, BDNS-induced changes in indirect transition frequency were significantly larger than those observed under sham conditions throughout all 12 weeks (e). Task repetition length also showed significant changes throughout the experiment (f; t39 > 10.2, PBonferroni < 0.05 in paired two-sided t-tests). By contrast, percept duration started to show significant differences at week 7 (g; t39 > 5.2, PBonferroni < 0.05 in paired two-sided t-tests) and NVJ proportion at week 9 (h; t39 > 5.9, PBonferroni < 0.05 in paired two-sided t-tests); *PBonferroni < 0.05. i,j, BDNS-induced significant behavioral changes were significantly associated with BDNS-induced changes in indirect transition frequency (i; R2 ≥ 0.2, P < 0.004). Data in c and j show examples of the brain–behavior associations.
Experiment 4: weekly BDNS sessions
We then hypothesized that the perceptual overstability and atypical nonverbal information processing in autism might begin to change after multiple BDNS sessions. We assumed such cumulative effects because our previous BDNS study reported that it took from 4 to 8 weeks for weekly BDNS to start to induce significant changes in a certain perceptual trait in TD individuals36.
We tested this possibility in a longitudinal sham-controlled cross-over experiment in which participants with ASD underwent the same BDNS once a week for 12 consecutive weeks (Fig. 4d). No adverse effect was reported, but 10 of the 50 individuals did not complete the experiment ostensibly due to the relatively long experimental design.
During this experiment, BDNS reduced neural rigidity and all three ASD-associated behaviors (Figs. 4e–h); however, the speed and trajectories of the behavioral changes varied between the three autistic traits. Neural rigidity and cognitive inflexibility showed significant reductions at week 1 (t39 > 10.2, PBonferroni < 0.05, η2 = 0.21, ∆task repetition length < –10%; Fig. 4e,f), whereas perceptual overstability started to change at week 7 (t39 > 5.2, PBonferroni < 0.05, η2 > 0.11, ∆percept duration < –6.7%; Fig. 4g) as well as the atypical nonverbal information processing (NVJ) at week 9 (t39 > 5.9, PBonferroni < 0.05, η2 > 0.13, ∆NVJ proportion > 5.2%; Fig. 4h). These statistically significant behavioral changes were associated with the mitigation of neural rigidity (R2 ≥ 0.2, P < 0.004; Fig. 4c,i,j).
These results suggest that the neural rigidity associated with autism has causal effects on cognitive inflexibility, whereas the rigid brain dynamics in autism may not have such strong direct causal links with perceptual overstability and atypical nonverbal information processing.
Latent neural processes: hypothesis
Why did perceptual overstability and atypical nonverbal information processing respond to BDNS slowly? We assumed that this question could be answered by identifying the latent neural processes that filled the gap between neural rigidity and the two autistic behaviors (Fig. 5a). More precisely, we hypothesized that (1) FPN activation and resultant neural flexibility should stabilize specific brain states (in particular, the minor states), which (2) would enhance the coactivation between the FPN and some brain networks and (3) consequently lead to the two types of behavioral alleviation. This hypothesis is based on our previous finding that, in autism, the atypically decreased frequency of indirect transition was correlated with shortened dwelling time of the minor states, which were associated with the strength of functional coupling between specific brain networks16.
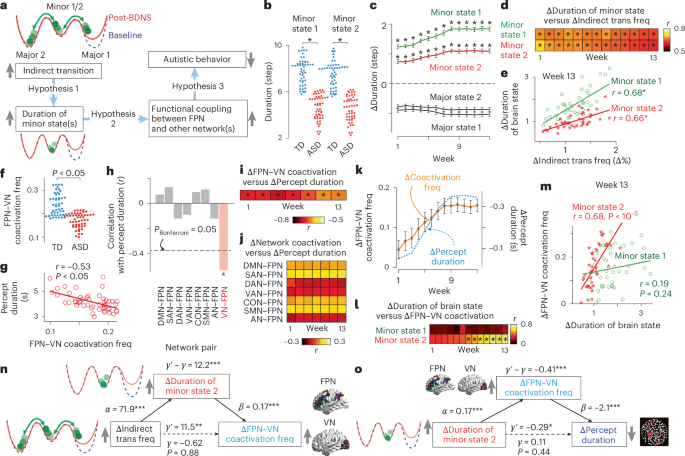
a, We hypothesized that frequent indirect transition stabilizes the two minor states (1), enhances functional couplings between the FPN and other brain networks (2) and changes behaviors (3). b, The ASD group had unstable minor states (t98 > 12.5, PBonferroni < 0.05 in two-sample two-sided t-tests); NASD = 50, NTD = 50. PBonferroni < 0.05 in a two-sample two-sided t-test. c, BDNS stabilized the minor states throughout Experiment 4 (t39 > 13.5, PBonferroni < 0.05 in paired two-sided t-tests); *PBonferroni < 0.05. Error bars indicate s.e.m. d,e, These BDNS-induced increases in minor state duration were correlated with those in indirect transition frequency (d; r38 ≥ 0.66, PBonferroni < 0.05). Such a correlation is observed in week 13 (e); *PBonferroni < 0.05. f–j, Coactivation frequency between the FPN and VN was reduced in ASD (f; t98 = 8.6, P < 10–5 in a two-sample two-sided t-test; NASD = 50, NTD = 50) and inversely correlated with perceptual overstability (g; r48 = –0.53, P = 0.00007; NASD = 50). This brain–behavior correlation was not observed in the other network pairs involving the FPN (h; | r48 | < 0.17, P > 0.3). In Experiment 4, BDNS-induced changes in FPN–VN coupling were correlated with those in perceptual overstability (i; r38 < –0.63, PBonferroni < 0.05), which were not seen in the other network pairs involving the FPN (j; | r38 | < 0.19, P > 0.24); *PBonferroni < 0.05. k, The longitudinal trajectory in FPN–VN coupling was similar to that in perceptual overstability. Error bars indicate s.e.m. l,m, When BDNS induced significant changes in perceptual overstability (week 7 to week 13), FPN–VN coupling was correlated with the duration of minor state 2; *PBonferroni < 0.05 (l; r38 > 0.47, PBonferroni < 0.05). Such a correlation is seen in week 13 (m); *PBonferroni < 0.05. n, Mediation analysis indicates that frequent indirect transition stabilizes minor state 2, enhancing FPN–VN coupling (PBonferroni < 0.05 for mediation effects between weeks 7 and 13); **P < 0.01 and ***P < 0.001. o, Another mediation analysis showed that stable minor state 2 enhanced FPN–VN coactivation, reducing percept duration (PBonferroni < 0.05 for mediation effects between week 7 and week 13); *P < 0.05 and ***P < 0.001. Data in n and o are based on week 13 data.
Prolonged minor brain states
To test hypothesis 1, we assessed how BDNS affected the stability of the four brain states. We found that the durations of the two minor states (both of which were originally unstable in the ASD group (t98 > 12.5, PBonferroni < 0.05, η2 > 0.61; Fig. 5b)) were prolonged throughout the repeated BDNS sessions (t39 > 13.5, PBonferroni < 0.05, η2 > 0.26; Fig. 5c), whereas those of the two major states were not. Moreover, the change in the duration of minor states correlated with the change in frequency of indirect transitions (r38 ≥ 0.66, PBonferroni < 0.05; Fig. 5d,e).
Perceptual overstability: FPN and visual network
We then examined whether this prolonged duration of the minor states induced by BDNS enhanced the functional coupling between the FPN and visual network (VN). We assessed this coupling because previous human fMRI studies identified multiple regions in the FPN and VN as key areas in bistable visual perception37,44 and demonstrated that individuals with more frequent FPN–VN coactivation were more likely to experience flexible visual perception36.
Selecting the VN was also supported by reanalysis of the current data.
First, the data obtained in Experiment 1 showed that FPN–VN coupling was significantly weaker in the ASD group than in the TD group (t98 = 8.6, P < 10–5, η2 = 0.49; Fig. 5f) and was inversely correlated with perceptual overstability in individuals with ASD (r48 = –0.53, 95% CI = –0.70 to –0.30, P = 0.00007; Fig. 5g). Except for the VN, no internetwork coupling with the FPN exhibited a significant association with perceptual overstability (| r48 | < 0.17, P > 0.3; Fig. 5h).
Second, the longitudinal data in Experiment 4 showed that the BDNS-induced changes in perceptual overstability were correlated with changes in FPN–VN coupling (r38 < –0.63, PBonferroni < 0.05; Fig. 5i) but not with changes in the other internetwork couplings with the FPN (| r38 | < 0.19, P > 0.24; Fig. 5j). Moreover, the BDNS-induced change in FPN–VN coupling strength exhibited a qualitatively similar trajectory as that of perceptual overstability (Fig. 5k).
Based on these observations, we focused on FPN–VN coupling and examined whether BDNS-induced prolonged duration of the minor states enhanced FPN–VN coactivation. We found that, in the weekly BDNS sessions (Experiment 4), FPN–VN coupling was correlated with only the duration of minor state 2 (r38 > 0.47, PBonferroni < 0.05; Fig. 5l,m). This correlation reached statistical significance only when BDNS mitigated perceptual overstability (that is, weeks 7–13; Fig. 4g).
Furthermore, by applying a mediation analysis to the data collected between weeks 7 and 13, we found that the BDNS-induced increase in indirect transition frequency stabilized minor state 2, which strengthened FPN–VN coupling (PBonferroni < 0.05 for mediation effects; see Fig. 5n for an example based on the week 13 data).
Experiment 5: FPN–VN coupling and perceptual overstability
Did this stronger FPN–VN coupling reduce perceptual overstability? To answer this question (that is, hypothesis 3 in Fig. 5a), we first applied a mediation analysis to the neural and behavioral data recorded in the weekly BDNS sessions (Experiment 4) and found that the prolonged duration of minor state 2 enhanced FPN–VN coupling, which lowered perceptual overstability (PBonferroni < 0.05 for mediation effects throughout weeks 7–13; see Fig. 5o for an example based on week 13 data).
Moreover, we directly examined such effects of FPN–VN coupling on perceptual overstability by conducting another multiweek BDNS experiment (Experiment 5). In a sham-controlled cross-over longitudinal experiment, the same 40 autistic adults underwent almost the same weekly BDNS over the same right SPL. However, instead of delivering the TMS during major state 1, we administered the TMS when the VN was active but the FPN was inactive, reasoning that this procedure would increase the FPN–VN coactivation frequency (Fig. 6a). We selected this TMS timing because, in Experiment 2, we already identified the effective BDNS protocol that increased FPN activity but did not find such a protocol to enhance VN activity.

a, To directly examine the link between FPN–VN coupling and percept duration, we performed a 6-week longitudinal experiment (Experiment 5; N = 40) and administered excitatory TMS over the same right SPL only when the VN was active and the FPN was inactive. b,c, Unlike Experiment 4 (N = 40), Experiment 5 showed a BDNS-induced increase in FPN–VN coupling even at week 0 (b; t39 > 4.9, PBonferroni < 0.05 in paired two-sided t-tests) and began to reduce autism-associated perceptual overstability at week 3 (c; t39 > 3.5, PBonferroni < 0.05 in paired two-sided t-tests); *PBonferroni < 0.05. Error bars indicate s.e.m. d,e, Mitigation of neural rigidity stabilized minor state 2, which enhanced FPN–VN coupling and lowered perceptual overstability in autism (d). This mechanism explains the temporal orders between the changes in neural dynamics and autistic behavior (e).
Compared to the original weekly BDNS protocol used in Experiment 4, this FPN–VN-focused protocol induced a smoother enhancement of FPN–VN coupling (t39 > 4.9, PBonferroni < 0.05, η2 > 0.11; Fig. 6b), leading to a more prompt reduction in perceptual overstability (t39 > 3.5, PBonferroni < 0.05, η2 > 0.08; Fig. 6c). This observation provides stronger support for the brain–behavior causality between FPN–VN coupling and perceptual overstability in autism.
Together, these findings suggest that the prolonged duration of minor state 2 and enhanced FPN–VN coupling are the latent neural processes that bridge the gap between mitigation of neural rigidity and alleviation of perceptual overstability (Fig. 6d). This mechanism readily explains the temporal order and differences between the increase in indirect transition frequency, prolongation of the duration of minor state 2, strengthening of FPN–VN coupling and alleviation of perceptual overstability in Experiment 4 (Fig. 6e).
Atypical nonverbal information processing
Using the same logic, we searched for the latent neural processes underlying the slow mitigation of atypical nonverbal information processing in autism.
Here, considering the previous literature27,45,46, we examined functional coupling between the FPN, default mode network (DMN) and salience network (SAN). We focused on the DMN and SAN because these networks contain the brain regions, such as the medial prefrontal cortex, anterior cingulate cortex and right anterior insula, that have crucial roles in understanding of nonverbal social information in the current friend-or-foe test46. This selection is also supported by other previous reports that showed that, in autistic individuals, atypically reduced activities of the DMN and SAN were correlated with the strength of atypical social behaviors23,27,45.
This network choice was also consistent with the current data. The neural data recorded in Experiment 1 showed that participants with ASD exhibited an atypical decrease in FPN–DMN–SAN coupling (t98 = 12.8, P < 0.05, η2 = 0.63; Fig. 7a), which indicated an atypical reduction in the strength of nonverbal information processing (NVJ proportion; r48 = 0.47, P < 0.05; Fig. 7b). No other pair or triad of brain networks, including the FPN, showed significant correlations with NVJ proportion (| r48 | < 0.25, P > 0.08; see Fig. 7c,d for network pairs and triads).

a, Data from Experiment 1 showed that, compared to the TD group, individuals with ASD exhibited fewer coactivations of the FPN, DMN and SAN (t98 = 12.8, P < 0.05 in a two-sample two-sided t-test); NASD = 50, NTD = 50. b–d, FPN–DMN–SAN coactivation frequency was correlated with NVJ proportion (b; r48 = 0.47, P = 0.0005; NASD = 50). Such a significant correlation was not seen in any pair of brain networks involving the FPN (c; | r48 | < 0.25, P > 0.08) nor in any triad of brain networks including the FPN (d); *PBonferroni < 0.05. e,f, BDNS-induced changes in FPN–DMN–SAN coactivation frequency were correlated with those in NVJ proportion throughout 12-week-long Experiment 4 (e; r38 > 0.45, *PBonferroni < 0.05). Also, FPN–DMN–SAN coupling and NVJ proportion showed similar trajectories (f). Error bars indicate s.e.m. g, Between weeks 9 and 13, BDNS-induced changes in FPN–DMN–SAN coupling were correlated with those in minor state 1 (r38 > 0.48, PBonferroni < 0.05) but not with those in minor state 2 (| r38 | < 0.15, PBonferroni > 0.05); *PBonferroni < 0.05. h–j, Two mediation analyses showed that the BDNS-induced increase in indirect transition frequency stabilized minor state 1, which enhanced both FPN–DMN and FPN–SAN coupling (h; PBonferroni < 0.05 for mediation effects). A mediation analysis with multiple mediators revealed that this enhancement of FPN–DMN and FPN–SAN coupling facilitated FPN–DMN–SAN coupling (i; PBonferroni < 0.05 for mediation effects). Two other mediation analyses showed that stronger FPN–DMN–SAN coupling increased NVJ proportion (j; PBonferroni < 0.05 for mediation effects). These associations were significant between weeks 9 and 13 in Experiment 4. Data in h–j show results based on the data recorded in week 13; *P < 0.05, **P < 0.01 and ***P < 0.001.
Moreover, in the longitudinal data obtained in Experiment 4, we found that the BDNS-induced change in FPN–DMN–SAN coupling was correlated with the change in NVJ proportion throughout the 12-week experiment (r38 > 0.45, PBonferroni < 0.05; Fig. 7e). In fact, the trajectory of the FPN–DMN–SAN coupling seen in Experiment 4 was similar to that of the NVJ proportion (Fig. 7f).
Given these findings, we hypothesized that FPN–DMN–SAN coupling should be key to understanding the neural mechanisms by which the mitigation of neural rigidity and subsequent stabilization of the minor states would enhance the nonverbal information processing that was originally reduced in autism.
Neural rigidity and triad network coupling
To examine this conjecture, we first assessed the associations between BDNS-induced changes in duration of the minor states and those of FPN–DMN–SAN coupling, which identified a significant correlation only for minor state 1 (r38 > 0.48, PBonferroni < 0.05) and not for minor state 2 (| r38 | <0.15, PBonferroni > 0.05; Fig. 7g). This significant correlation was observed between weeks 9 and 13, during which BDNS induced significant improvement in nonverbal information processing (Fig. 4h).
Next, using the data obtained between weeks 9 and 13, we performed three mediation analyses and found that the increase in indirect transition frequency prolonged the duration of minor state 1, which enhanced the FPN–DMN and FPN–SAN couplings separately (PBonferroni < 0.05 for mediation effects; see Fig. 7h for results based on data from week 13) and subsequently increased the triad FPN–DMN–SAN coupling (PBonferroni < 0.05 for mediation effects; see Fig. 7i for a result in week 13).
Also, two further mediation analyses showed that this stronger FPN–DMN–SAN coupling led to changes in atypical nonverbal information processing (PBonferroni < 0.05 for mediation effects; see Fig. 7j for results in week 13).
Experiment 6: atypical nonverbal communication
Finally, we examined this neural process by performing another 6-week BDNS experiment (Experiment 6), in which we administered the same excitatory TMS over the same right SPL, but now only when both the DMN and SAN were active and the FPN was inactive (Fig. 8a).

a, In Experiment 6 (N = 40), we directly examined the effects of FPN–DMN–SAN coupling on autistic nonverbal information processing. To this end, we investigated the neural and behavioral effects of another BDNS in which the same excitatory TMS was administered over the same right SPL only when the FPN was inactive and the DMN and SAN were active. b,c, Compared to Experiment 4 (N = 40), the BDNS in Experiment 6 enhanced FPN–DMN–SAN coactivation more quickly (b; from week 3, t39 > 4.3, *PBonferroni < 0.05 in paired two-sided t-tests) and altered the NVJ proportion more smoothly (c; from week 3, t39 > 3.4, *PBonferroni < 0.05 in paired two-sided t-tests). Error bars indicate s.e.m. d,e, Together, we found that mitigation of neural rigidity stabilized minor state 1, which enhanced both FPN–DMN and FPN–SAN couplings, strengthened FPN–DMN–SAN coupling and improved autism-associated nonverbal information processing (d). This neural process explains the temporal order between the neural and behavioral indices (e).
This protocol began to enhance FPN–DMN–SAN coupling more quickly (at week 3, t39 > 4.3, PBonferroni < 0.05, η2 > 0.1; Fig. 8b) than the original protocol (at week 9; Fig. 7f), resulting in a smoother improvement in atypical nonverbal information processing (from week 3, t39 > 3.4, PBonferroni < 0.05, η2 > 0.08; Fig. 8c) than the original protocol (from week 9; Fig. 4h). This observation provides direct empirical evidence for the causal effect of FPN–DMN–SAN coupling on nonverbal social information processing in autism.
Together, these findings show that reduced neural rigidity stabilizes minor state 1, which enhances FPN–DMN–SAN coupling and improves atypical nonverbal communication in autism (Fig. 8d). This multistage neural process accounts for the temporal order and fills gaps between BDNS-induced neural changes and atypical nonverbal communication style in ASD (Fig. 8e).
Additional experiments with active control conditions
The lack of an active control in the above main BDNS experiments left the possibility that the current observations could be contaminated with some placebo effects.
Regarding the neural effects, we could exclude this possibility. In Experiment 2.1, even after omitting the data in the original sham conditions (that is, ∆ in Sham) and focusing on those in the BDNS condition (that is, ∆ in BDNS), BDNS over the right SPL significantly increased the frequency of indirect transitions compared to BDNS over the right IFG and IPL (t31 > 3.0, PBonferroni < 0.05). In the same way, reanalysis of the data from Experiment 2.1 showed that BDNS during major state 1 induced a larger neural effect than BDNS during any of the other three brain states (t23 > 5.4, PBonferroni < 0.05).
However, the main behavioral longitudinal experiments did not include BDNS sessions that could be regarded as an active control condition. Thus, to examine the robustness of the main findings, we conducted three additional experiments (Additional Experiments 1–3) with new active control conditions (Supplementary Fig. 10a).
In the active control condition, we administered the same excitatory TMS over the same right SPL randomly, without considering the brain-state dynamics; this enabled the participants to experience almost the same number of TMS pulses with the same acoustic and somatosensory stimulations as in the original BDNS sessions. Indeed, the questionnaires at the end of each additional experiment revealed that the 40 participants with ASD could not distinguish the BDNS sessions from the active control sessions (classification accuracy = 45–55% for Additional Experiments 1–3; P > 0.12 in permutation tests).
In these additional experiments, BDNS induced qualitatively the same behavioral effects as seen in the main experiments.
In Additional Experiment 1, excitatory BDNS over the right SPL during major state 1 started to reduce cognitive inflexibility even at week 1 (t18 > 3.2, PBonferroni < 0.05; Supplementary Fig. 10b) but took a longer time to change perceptual overstability (week 7; t18 > 5.3, PBonferroni < 0.05; Supplementary Fig. 10c) and atypical nonverbal information processing (week 9; t18 = 4.0, PBonferroni < 0.05; Supplementary Fig. 10d). These behavioral changes were consistent with those seen in Experiment 4.
Additional Experiment 2 provided support for the observations in Experiment 5. Compared to random-timing TMS, BDNS during the ‘FPN-inactive but VN-active’ condition increased the FPN–VN coactivation frequency even at week 1 (t18 > 12.5, PBonferroni < 0.05; Supplementary Fig. 10e) and reduced perceptual overstability at week 3 (t18 = 14.4, PBonferroni < 0.05; Supplementary Fig. 10f). At week 3, this neural change was negatively correlated with behavioral effects (r8 = –0.74, P = 0.01; Supplementary Fig. 10g).
The results of Additional Experiment 3 corroborated the findings of Experiment 6. BDNS during the ‘FPN-inactive but DMN- and SAN-active’ condition enhanced FPN–DMN–SAN coupling (t18 = 15.4, PBonferroni < 0.05; Supplementary Fig. 10h) and increased the use of nonverbal social information in autistic individuals at week 3 (t18 = 11.1, PBonferroni < 0.05; Supplementary Fig. 10i). The BDNS-induced change in triad network coupling was correlated with the change in atypical nonverbal information processing (r8 = 0.76, P = 0.01; Supplementary Fig. 10j).
These results indicate the robustness of the behavioral findings obtained in the main longitudinal experiments.
Discussion
Here, we delivered TMS in relation to specific brain states to test whether such brain-state-driven neural stimulation influenced the fluidity of large-scale brain dynamics and whether this neural change had direct or indirect causal effects on diverse atypical behaviors in high-functioning adults with ASD. The outcome supported a clear relationship between reducing neural rigidity and cognitive inflexibility. By contrast, perceptual overstability and atypical nonverbal information processing were altered only after repetition of brain-state-dependent TMS. Perceptual overstability was reduced after BDNS-induced neural flexibility enhanced functional coupling between the FPN and VN, whereas atypical nonverbal information processing was decreased after functional coupling between the FPN, DMN and SAN was strengthened. These findings indicate causality between neural rigidity and multiple core behavioral traits of ASD.
The brain area over which we administered TMS (the right SPL) was close to the region that we previously reported to be related to autistic behaviors18. In the prior study, the gray matter volume of the right SPL was decreased in autistic adults and correlated with both cognitive inflexibility and perceptual overstability. Given the difference in analysis methods (that is, fMRI-based energy landscape analysis versus gray matter volume analysis) and cohorts (autistic adults recruited in Tokyo versus those recruited in London), the current result regarding the right SPL could be seen as further evidence that the parietal region would be among key neural areas for a comprehensive understanding of ASD47.
This study also indicates that enhancing FPN activity would be crucial for promoting cognitive flexibility in autism, which is conceptually consistent with previous findings that the network is involved with task switching and cognitive control in TD individuals4,8.
Here, we focused on the indirect transition frequency defined on the energy landscape, but future studies may identify more specific brain states that underpin different autistic cognitive traits. For example, by combining a finer brain parcellation system and multistage energy landscape analysis, we may be able to identify smaller brain states, and some of these microstates may be closely linked with specific autistic behaviors.
Methodologically, as seen in our previous BDNS study36, the energy landscape analysis qualitatively extracted the same brain dynamics from neural datasets with different temporal resolutions (that is, fMRI and EEG data). This robustness may be attributable to how brain-state dynamics are quantified. The energy landscape analysis did not assess the brain dynamics indices, such as transition frequency and dwelling time, by directly counting how many times the target events occurred in the actual neural data. Instead, it performed a sufficiently long random-walk simulation, in which brain dynamics were illustrated as ball movement on an individual energy landscape, and then counted how often the target events occurred in the hypothetical ball movements. Theoretically, such a numerical approach should be resilient against the confounding effects of different sampling rates.
Conversely, if we use a sufficiently large amount of neural data recorded at a high sampling rate, we may not have to perform such a random-walk simulation. Moreover, brain states may be determined in more direct manners, such as clustering based on dynamic FC matrices48 and phase matrices49,50. Such clustering and direct counting methods would be good alternatives to the current energy landscape analysis for data collected with higher temporal resolutions.
The current study adds evidence for the effectiveness of brain-state-dependent neural stimulation systems. As seen in our previous study using TD individuals36, a conventional 30-min rTMS over the same brain area did not induce as large neural effects as BDNS. Also, BDNS can control the functional coupling between different brain networks, which should be difficult in TMS protocols without real-time brain-state monitoring. Like invasive closed-loop neural stimulation systems51, this BDNS system would give us opportunities to identify more nuanced and dynamic brain–behavior causality.
Clinically, the current BDNS protocol might become a basis for future interventions for more severe forms of autism. However, there are at least three issues to address before clinical application. First, future studies have to examine the applicability of the current method in a more diverse ASD population, such as in autistic children and in individuals with both ASD and attention deficit hyperactivity disorder. Second, we would have to examine the current behavioral effects in larger cohorts with various clinical scoring systems. Third, the BDNS protocol should be more optimized. In the current protocol, the behavioral effects were washed out approximately 2 months after the final BDNS session (Extended Data Fig. 1). To achieve longer-lasting effects, we may have to increase the frequency of neural stimulation.
Although the current BDNS protocol changed autistic neural and behavioral traits, other TMS protocols may induce equivalent or larger effects. This study first narrowed down the nine brain networks to the FPN through numerical simulation, which implicitly assumed that BDNS could modify activity of only one brain network. Therefore, we did not examine some possibilities that, for example, BDNS over a certain brain area could stimulate multiple network activities simultaneously. Given this, future studies would need to comprehensively search for more efficient BDNS that could trigger larger neural and behavioral effects.
Future studies would also have to investigate other neural mechanisms underpinning the slow responses of perceptual overstability and atypical nonverbal information processing against the original BDNS protocol. We found some evidence for latent brain processes that can explain these relatively slow behavioral changes; but such evidence was found through analyses and experiments based on a specific hypothesis (Fig. 5a), and such slow behavioral effects may also be supported by other brain mechanisms.
Another limitation of this study is the lack of an active control in the main BDNS experiments. Although the additional experiments successfully reproduced the main findings, the lack of an active control in the main experiments may leave the possibility that the current observations could be contaminated with some placebo effects52,53.
Another methodological issue is about the method to assign EEG electrodes to one of the brain networks. This study performed the assignment simply based on the locations of the electrodes, which were measured by a stereoscopic neuronavigation system. Although the significant neural and behavioral changes seen in the current study appear to provide face validation of this seemingly coarse manner, future studies would have to adopt finer methods, such as utilization of an EEG–fMRI concurrent recording system, for this EEG allocation.
Finally, we have to mention the potential of an experimenter bias. In the current BDNS sessions, the participants were blinded to the experimental conditions, whereas the experimenters were aware. Generally, it is difficult to achieve complete double-blind designs for TMS experiments, but we have to be careful about this bias when interpreting the current findings.
Here, we have shown that mitigating neural rigidity seen in autism can alter different ASD-associated behaviors in different neural processes, which demonstrated the direct/indirect brain–behavior causal relationships between neural rigidity and diverse atypical behaviors in autism. These findings imply that brain-state-driven neural stimulation could be a foundation for a new noninvasive approach to influences some behaviours associated with ASD.
Methods
Inclusion and ethics
This study included local researchers throughout the research process and was achieved with collaboration with local clinical partners. The research design was approved by a local ethics committee at The University of Tokyo.
Participants and ethics
This study used 50 high-functioning right-handed adults with ASD and 50 age-, IQ-, sex- and laterality-matched TD individuals (Supplementary Table 1). This sample size was determined by power analysis using the data obtained in our previous studies (power = 0.8, α = 0.05; Supplementary Table 2 and Supplementary Methods). This study was approved by Institutional Ethics Committees at The University of Tokyo (20-132). All participants provided written informed consent before any experiment and were financially compensated for their participation.
Study design
This study consisted of six experiments and one numerical simulation study (Fig. 1f). In Experiment 1 (Supplementary Fig. 1), we collected rsfMRI and EEG data from the 50 individuals with ASD and 50 TD individuals. We then conducted a numerical simulation on the neural effects of BDNS and searched for the optimal BDNS protocol that would efficiently reduce autism-associated neural rigidity. For empirical validation of the numerical simulation, we conducted threefold Experiment 2. In Experiment 2.1 (Supplementary Fig. 2), we compared the neural effects between three BDNSs over three different target brain regions. In Experiment 2.2 (Supplementary Fig. 3), we compared the neural effects between four BDNSs during four different stimulation timings. In Experiment 2.3 (Supplementary Fig. 4), we performed a conventional 30-min rTMS41,43 as a control condition.
Based on the results of these experiments, we then conducted Experiments 3 and 4. In Experiment 3 (Supplementary Fig. 5), we assessed the neural and behavioral effects of a single BDNS. In Experiment 4 (Supplementary Fig. 6), we examined the longitudinal effects. In Experiments 5 and 6, we searched for the latent neural processes in which the BDNS-induced mitigation of neural rigidity transformed into mitigation of perceptual rigidity (Experiment 5; Supplementary Fig. 7) and atypical nonverbal communication (Experiment 6; Supplementary Fig. 8) in autism. The order of Experiments 5 and 6 was randomized across participants.
In Experiment 4, 10 of the 50 individuals with ASD dropped out due to the length of the experiment.
All main experiments using TMS were designed as sham-controlled cross-over tests. Data collection and analysis were not performed blind to the conditions of the experiments. By contrast, the participants were not informed about which condition (that is, TMS or control) they were about to undergo, and the order of the conditions was randomized across participants.
Behavioral tests
We used three psychological tests to evaluate three different autistic traits: a spontaneous task-switching test to evaluate cognitive inflexibility (Fig. 1a), a bistable perception test to assess perceptual rigidity (Fig. 1b) and a friend-or-foe test to quantify atypical nonverbal communication style in autism (Fig. 1c).
Spontaneous task-switching test
The spontaneous task-switching psychological test was built based on previous studies29,30, and its current setting was the same as those in our prior work18. We adopted this test to assess autistic cognitive inflexibility because multiple behavioral studies demonstrated that this test could reveal this ASD-specific behavioral tendency even when the participant had normal or above-normal intelligence18,29,30.
The participants were presented with visual stimuli that had four figures with different shapes and brightness. We then asked them to perform a ‘shape task’ or a ‘brightness task’.
In the shape task, the participants were asked to identify a specific shape (for example, a circle), whereas they were asked to identify the brightest (or darkest) figure in the brightness task. They were asked to press one of four buttons to indicate their choice for each task as accurately and quickly as possible. When the participants did not press any of the buttons in 3 s, the trial automatically ended, and the next trial started. The participants were informed that they could freely choose which task they would conduct for each trial.
Bistable perception test
Perceptual rigidity was assessed using the same bistable visual perception paradigm as that used in our previous studies18,31,36.
Bistable perception was induced by a structure-from-motion stimulus, a sphere consisting of 200 sinusoidally moving white dots in a black background (angular velocity, 120° per s) with a fixation cross (0.1° × 0.1°) at the center of the 68.5-cm LCD monitor (BenQ PD2710, resolution: 2,560 × 1,440). The stimulus presentation and response recording were conducted with PsychToolbox 3 in MATLAB (MathWorks).
Participants were presented with this stimulus for 90 s for each run with their chins on a chin rest. They were asked to press one of the three buttons according to their visual perception: one for upward rotation, one for downward rotation and one for unsure or mixed perception. After training, the participants repeated this run five times.
Friend-or-foe test
This test was developed in our previous studies to evaluate sociocommunicational traits seen in high-functioning autistic adults23,27,28. Here, we used the same stimuli and settings as in the prior works27,28 that successfully detected oxytocin’s beneficial effects on the core characteristic of ASD with this psychological test.
In this social cognition test, we presented the participants with 80 short monochrome videos (1.5 s). In each video, 1 of 20 professional actors spoke an emotional word (verbal information) with a specific emotional facial expression and voice prosody (nonverbal information). Note that the facial expression and voice prosody in one video indicated the same emotional direction.
We prepared four types of videos, two with congruent stimuli and two with incongruent stimuli. The 40 congruent stimuli consisted of 20 videos with ‘positive nonverbal and verbal information’ and 20 other videos with ‘negative nonverbal and verbal information’. The 40 incongruent stimuli comprised 20 videos with positive nonverbal information and negative verbal information, which are similar to jokes, and 20 other videos with negative nonverbal information and positive verbal information, which are similar to ironies.
In a 2-s period right after each video, the participants were asked to judge whether the actor appeared to be a friend or foe to them. After sufficient training sessions with different stimuli, the participants were pseudorandomly presented with these movies and made friend-or-foe judgments.
In our analysis, we focused on the responses to the incongruent stimuli because they highlight ASD-related social cognition. We classified the responses into ‘NVJ’ and ‘verbal information-based judgment (VJ)’. For example, if the participants regarded the actors who spoke a positive word in a negative facial expression and voice prosody as foes, such decisions were classified as NVJs; when the actors who spoke a negative word with positive facial and voice expressions were taken as foes, the decisions were classified as VJs.
Because high-functioning autistic adults are known to make significantly fewer NVJs than TD adults23, we examined BDNS-induced changes in the proportion of NVJs. Technically, the NVJ proportion was defined as (number of NVJs) / (number of NVJs + number of VJs), and a smaller NVJ proportion indicates more atypical nonverbal information processing.
MRI recording
We recorded structural and rsfMRI using a 3.0T MRI scanner (Trio, Siemens Medical Systems) with a 32-channel head coil at the International Research Center for Neurointelligence (WPI-IRCN) at The University of Tokyo. T1-weighted structure images were obtained at 1-mm-cubic resolution (TR = 2.25 s, TE = 4.52 ms, flip angle = 9°). Resting-state functional images were recorded using an echo planar imaging sequence (TR = 0.8 s, TE = 37 ms, flip angle = 52°, 72 slices, spatial resolution = 2 × 2 × 2 mm, multiband acceleration factor = 8). Phase images and magnitude images were also obtained for a fieldmap. During recording of the functional images, the participants were asked to open their eyes and watch a fixation cross at the center of the screen without thinking about specific issues.
Energy landscape analysis for fMRI data
We performed the energy landscape analysis in essentially the same manner as in our previous studies16,17,31,36. Note that this study basically performed the analysis at an individual level; we conducted the group-level analysis only when we needed to present the representative brain-state dynamics and energy landscape structure.
Also, the energy landscape analysis was performed based on network-wise rsfMRI signals rather than region-wise rsfMRI signals, mainly due to data limitation. To obtain accurate results from the energy landscape analysis of time series data recorded from N nodes, we had to collect data with more than 2N time points. Therefore, it was practically impossible to conduct the energy landscape analysis without summarizing neural signals recorded from the whole brain. For example, if we adopted a widely used brain parcellation system developed by Power et al.54, the whole brain was divided into approximately 250 regions. Thus, region-wise energy landscape analysis would require us to record rsfMRI data with more than 2250 (>1077) time points. To circumvent this technical difficulty, we summarized the ~250 regions into the nine brain networks, which only required 29 time points of rsfMRI data at least.
We then fitted a pairwise MEM to the data (Extended Data Fig. 2) and built an energy landscape for each participant before performing a random-walk simulation on the energy surface (see Supplementary Methods for details).
EEG recording
This study had two types of EEG signal processing: offline analysis for the preparation of BDNS and online analysis during BDNS, both of which were performed in practically the same manner as in our previous BDNS study36. We recorded EEG signals using an eego mylab system with 256 TMS-compatible Ag/AgCl ring electrodes (ANT Neuro).
For each participant, we located all EEG electrodes on individual structural MRI brain images using a stereoscopic neuronavigation system (Brainsight Neuronavigation, Rogue Research). This localization for all electrodes was conducted on the first day of Experiments 1, 3, 5 and 6. On the other days, we measured the locations of the five representative electrodes (Cz, Fpz, Pz, T7 and T8) with the neuronavigation system. On all experiment days, we adjusted the location of the EEG cap so that the locations of the five representative electrodes were practically the same as those measured on the first day of Experiment 1.
We then confirmed that all the electrodes had <5 kΩ of impedance and recorded the EEG signals. In a 256-channel amplifier (eego mylab system, ANT Neuro), the signals underwent low-pass filtering (cutoff frequency = 1.25 kHz) and were downsampled to 3 kHz almost simultaneously (latency < 5 ms).
Using these settings, we recorded EEG data in six 5-min runs, during which the participants were asked to stare at a fixation cross mark at the center of the monitor in front of them.
Offline energy landscape analysis for EEG data
We conducted offline conventional preprocessing36,40 of the EEG data with MATLAB (MathWorks) and EEGLAB55.
First, we referenced the EEG data to the average across all the electrodes, downsampled to 300 Hz and underwent a temporal filter (1–80 Hz). We then performed an independent component analysis, which was based on short-time Fourier transforms and a complex-valued version of FastICA with a robust measure of non-Gaussianity56, to reduce artifacts induced by cardio-ballistic movements, eye blinks, eye movements and muscle activity.
Next, epochs were marked when the mean global field power was overly large (>5 s.d. of mean power across the entire recording) and excluded in all the following main analyses. We then filtered the data to delta (1–4 Hz), theta (4-8 Hz), alpha (8–13 Hz), beta (13–30 Hz) and gamma (30–80 Hz) bands and estimated a Hilbert envelope amplitude for the gamma band signal36,40,57.
As in our previous BDNS work36, this study defined a neural signal for each electrode using the Hilbert envelope amplitude for the gamma band because gamma band signal dynamics are correlated with fMRI signals40,57. Finally, we removed autocorrelation and estimated a Hjorth signal for each electrode58.
Using this network-wise EEG dataset, we conducted the energy landscape analysis. For each participant, network-wise EEG signals were binarized using the temporal average of the signals as the thresholds36. After these operations, a neural activity pattern of the nine brain networks at time t was described, such as \({V}^{t}=[{\sigma }_{1}^{t},{\sigma }_{2}^{t},\ldots ,{\sigma }_{N}^{t}]\), where \({\sigma }_{i}^{t}\) represents binary activity of networki at time t (that is, \({\sigma }_{i}^{t}=+1\) or −1). N denotes the number of the network (here, N = 9). The rest of the energy landscape analysis was performed exactly the same as for the rsfMRI data.
We then classified the electrodes into one of the nine brain networks based on the localizations of the EEG electrodes on the cerebral cortex of each participant, which was conducted in Experiment 1 using a stereoscopic neuronavigation system (Brainsight Neuronavigation, Rogue Research). Technically, we first searched for the ROI in the brain parcellation system54 that was nearest to the EEG electrode coordinate. If the distance between the nearest ROI and EEG electrode was less than 4 mm, we assigned the EEG electrode to the network to which the ROI also belonged. Otherwise, we excluded the signal of the electrode in the following analysis.
Next, for each network, we calculated the mean network activity by averaging the Hjorth signals of the electrodes belonging to the network.
Using the results of this EEG-based energy landscape analysis, we compared the local minima and transition frequency between the EEG-based and rsfMRI-based energy landscape analyses.
Then, after confirming the similarity between the EEG-based and rsfMRI-based energy landscape analyses, we summarized the classification information that told us which brain state was assigned to each binary network activity vector. This information was used in the online EEG analysis (see Supplementary Methods and Extended Data Figs. 3 and 4 for the details of the online EEG analysis).
TMS setting for BDNS
The current study adopted almost the same settings for TMS as in our previous BDNS research36.
As stated in the main manuscript, the numerical simulation indicated an excitatory stimulation as the optimal stimulation. Therefore, we adopted a quadripulse TMS system in which we could deliver a train of four monophasic magnetic pulses (200 Hz) from the interconnected four magnetic stimulators (70-mm-diameter double coil, DuoMag MP, DeyMed Diagnostic). Therefore, on one occasion of the brain-state-driven trigger, we administered four 200-Hz TMS pulses in 15 ms. Note that four 20-Hz monophasic magnetic pulses were not adopted here because the TMS is considered to have inhibitory effects on the neural activity of the target brain region36,41,42.
To reduce unpredicted neural effects on nontarget sites, this BDNS did not use conventional quadripulse TMS protocols41,59,60,61, which often induce long-lasting aftereffects on brain areas that are remote from the stimulated site41,43. Instead, we administered only one set of four TMS pulses in one stimulation and put ≥9-s intervals between such stimulations. Moreover, we adopted a weaker TMS (70% of active motor threshold; AMT) than the conventional TMS (90% of AMT)41,43. We adopted the smaller-magnitude TMS because a previous study showed that, in EEG-triggered TMS systems, even such weak neural stimulation had sufficient neural effects62, and another study demonstrated that brain-state-dependent TMS at this weak magnitude could induce significant behavioral changes36.
The AMT was set as the lowest single-pulse TMS magnitude that could evoke a small response (>100 µV) in more than half of the ten consecutive trials when the participants slightly contracted the right first dorsal interosseous (FDI) muscle (~10% of the maximum voluntary contraction). We recorded the motor-evoked potentials (MEPs) of the right FDI with a pair of 9-mm-diameter Ag/AgCl surface cup electrodes, which were placed over the muscle belly and the metacarpophalangeal joint of the right index finger63. We applied a temporal filter (100 Hz–3 kHz) to the MEP signals and searched for the optimal place for stimulation of the right FDI muscle over which the single-pulse TMS induced the largest MEP. This temporal filter was overlapped with those used in a line of other previous TMS studies (for example, 100 Hz–3 kHz in refs. 41,43,63 and 150 Hz–3 kHz in ref. 64). MEP signals were recorded at a sampling rate of 20 kHz. The average AMT in the 50 individuals with ASD was 33.1% ± 9.2% (mean ± s.d.) of the maximum stimulator output.
Location of TMS target region
The location of the TMS target was determined using a stereoscopic neuronavigation system (Brainsight Neuronavigation, Rogue Research). In each TMS session, we confirmed that the coil did not move throughout the experiment by comparing the locations of the TMS coil between the beginning and end of the TMS session.
Timing and number of TMS administrations
Based on the online EEG analysis, we monitored brain-state dynamics and triggered TMS (Extended Data Fig. 5). In Experiment 3, we performed BDNS during major state 1. In this setting, we administered TMS 30.5 ± 4.1 (mean ± s.d) times in a 5-min run. In Experiment 4, TMS was triggered during major state 1, which was observed 29.5 ± 4.8 times in a 5-min run. In Experiment 5, we administered TMS when the FPN was inactive but the VN was inactive, whose frequency was 34.5 ± 5.3 times in a 5-min run. In Experiment 6, TMS was triggered when the FPN was inactive but both the DMN and SAN were active, whose frequency was 28.9 ± 4.2 times in a 5-min run.
Numerical simulation
To identify the optimal BDNS condition, we numerically examined how TMS affected the structures of the individual energy landscape and, resultantly, the brain-state dynamics on it. We performed this simulation in essentially the same manner as in our previous study36. Note that we performed all simulations based on the energy landscape built from the rsfMRI data collected in Experiment 1.
Numerical simulation for excitatory TMS
If networki (i = 1,…, 9) was the target site of the excitatory TMS, we removed all binary neural vectors, \({V}^{t}\), whose element i, \({\sigma }_{i}\), was set at –1 (that is, inactive) from the energy landscape. We then rebuilt the disconnectivity graph and estimated the structural properties of the energy landscape. When any local minimum representing any brain state was removed in the first place, we alternatively used the brain state that included the neighboring neural vector as the brain state. We repeated this simulation for all nine networks in all participants.
Numerical simulation for inhibitory TMS
The neural effects of the inhibitory TMS were simulated in almost the same procedure as those of the excitatory TMS. In this case, if networki was the target site of the inhibitory TMS, we removed all binary neural vectors, \({V}^{t}\), whose element i, \({\sigma }_{i}\), was set at 1 (that is, active) from the energy landscape. Afterward, we conducted the same calculation as stated above.
Statistics
For all t-tests, we confirmed the normality of the data based on a Shapiro–Wilk test (P > 0.32). None of the t-tests assumed the equality of variance.
Reporting summary
Further information on research design is available in the Nature Portfolio Reporting Summary linked to this article.
Code availability
The code for the energy landscape analysis was shared as supplementary material for one of our previous studies65 and an open-source software (sites.google.com/site/ezakitakahiro/software).
Other details regarding the methods can be found in Supplementary Methods.
References
Happé, F. & Frith, U. The weak coherence account: detail-focused cognitive style in autism spectrum disorders. J. Autism Dev. Disord. 36, 5–25 (2006).
Belmonte, M. K. et al. Autism as a disorder of neural information processing: directions for research and targets for therapy. Mol. Psychiatr. 9, 646–663 (2004).
Minshew, N. J., Goldstein, G. & Siegel, D. J. Neuropsychologic functioning in autism: profile of a complex information processing disorder. J. Int. Neuropsychol. Soc. 3, 303–316 (1997).
Dajani, D. R. & Uddin, L. Q. Demystifying cognitive flexibility: implications for clinical and developmental neuroscience. Trends Neurosci. 38, 571–578 (2015).
Rashid, B. et al. Connectivity dynamics in typical development and its relationship to autistic traits and autism spectrum disorder. Hum. Brain Mapp. 39, 3127–3142 (2018).
Mash, L. E. et al. Transient states of network connectivity are atypical in autism: a dynamic functional connectivity study. Hum. Brain Mapp. 40, 2377–2389 (2019).
Supekar, K., Ryali, S., Mistry, P. & Menon, V. Aberrant dynamics of cognitive control and motor circuits predict distinct restricted and repetitive behaviors in children with autism. Nat. Commun. 12, 3537 (2021).
Uddin, L. Q. Cognitive and behavioural flexibility: neural mechanisms and clinical considerations. Nat. Rev. Neurosci. 22, 167–179 (2021).
Uddin, L. Q. et al. Brain state differentiation and behavioral inflexibility in autism. Cereb. Cortex 25, 4740–4747 (2015).
Zalesky, A., Fornito, A., Cocchi, L., Gollo, L. L. & Breakspear, M. Time-resolved resting-state brain networks. Proc. Natl Acad. Sci. USA 111, 10341–10346 (2014).
de Pasquale, F. et al. A cortical core for dynamic integration of functional networks in the resting human brain. Neuron 74, 753–764 (2012).
Bassett, D. S. et al. Dynamic reconfiguration of human brain networks during learning. Proc. Natl Acad. Sci. USA 108, 7641–7646 (2011).
Deco, G., Tononi, G., Boly, M. & Kringelbach, M. L. Rethinking segregation and integration: contributions of whole-brain modelling. Nat. Rev. Neurosci. 16, 430–439 (2015).
Breakspear, M. Dynamic models of large-scale brain activity. Nat. Neurosci. 20, 340–352 (2017).
Shine, J. M. et al. Human cognition involves the dynamic integration of neural activity and neuromodulatory systems. Nat. Neurosci. 22, 289–296 (2019).
Watanabe, T. & Rees, G. Brain network dynamics in high-functioning individuals with autism. Nat. Commun. 8, 16048 (2017).
Watanabe, D. & Watanabe, T. Distinct frontoparietal brain dynamics underlying the co-occurrence of autism and ADHD. eNeuro 10, ENEURO.0146–23.2023 (2023).
Watanabe, T., Lawson, R. P., Walldén, Y. S. E. & Rees, G. A neuroanatomical substrate linking perceptual stability to cognitive rigidity in autism. J. Neurosci. 39, 6540–6554 (2019).
Uddin, L. Q. Brain mechanisms supporting flexible cognition and behavior in adolescents with autism spectrum disorder. Biol. Psychiatry 89, 172–183 (2021).
Robertson, C. E., Kravitz, D. J., Freyberg, J., Baron-Cohen, S. & Baker, C. I. Slower rate of binocular rivalry in autism. J. Neurosci. 33, 16983–16991 (2013).
Freyberg, J., Robertson, C. E. & Baron-Cohen, S. Reduced perceptual exclusivity during object and grating rivalry in autism. J. Vis. 15, 11 (2015).
Robertson, C. E., Ratai, E.-M. & Kanwisher, N. Reduced GABAergic action in the autistic brain. Curr. Biol. 26, 80–85 (2016).
Watanabe, T. et al. Diminished medial prefrontal activity behind autistic social judgments of incongruent information. PLoS ONE 7, e39561 (2012).
Wang, A. T., Lee, S. S., Sigman, M. & Dapretto, M. Neural basis of irony comprehension in children with autism: the role of prosody and context. Brain 129, 932–943 (2006).
Schwartz, C., Bente, G., Gawronski, A., Schilbach, L. & Vogeley, K. Responses to nonverbal behaviour of dynamic virtual characters in high-functioning autism. J. Autism Dev. Disord. 40, 100–111 (2010).
Pelphrey, K. A., Morris, J. P. & McCarthy, G. Neural basis of eye gaze processing deficits in autism. Brain 128, 1038–1048 (2005).
Watanabe, T. et al. Mitigation of sociocommunicational deficits of autism through oxytocin-induced recovery of medial prefrontal activity: a randomized trial. JAMA Psychiatry 71, 166–175 (2014).
Watanabe, T. et al. Clinical and neural effects of six-week administration of oxytocin on core symptoms of autism. Brain 138, 3400–3412 (2015).
Arrington, C. M. & Logan, G. D. The cost of a voluntary task switch. Psychol. Sci. 15, 610–615 (2003).
Poljac, E., Poljac, E. & Yeung, N. Cognitive control of intentions for voluntary actions in individuals with a high level of autistic traits. J. Autism Dev. Disord. 42, 2523–2533 (2012).
Watanabe, T., Masuda, N., Megumi, F., Kanai, R. & Rees, G. Energy landscape and dynamics of brain activity during human bistable perception. Nat. Commun. 5, 4765 (2014).
Kang, J., Jeong, S., Pae, C. & Park, H. Bayesian estimation of maximum entropy model for individualized energy landscape analysis of brain state dynamics. Hum. Brain Mapp. 42, 3411–3428 (2021).
Regonia, P. R. et al. Modeling heterogeneous brain dynamics of depression and melancholia using energy landscape analysis. Front. Psychiatry 12, 780997 (2021).
Klepl, D. et al. Characterising Alzheimers disease with EEG-based energy landscape analysis. IEEE J. Biomed. Health Inform. 26, 992–1000 (2021).
Kindler, J. et al. Aberrant brain dynamics in individuals with clinical high risk of psychosis. Schizophr. Bull. Open 5, sgae002 (2024).
Watanabe, T. Causal roles of prefrontal cortex during spontaneous perceptual switching are determined by brain state dynamics. eLife 10, e69079 (2021).
Brascamp, J., Sterzer, P., Blake, R. & Knapen, T. Multistable perception and the role of frontoparietal cortex in perceptual inference. Annu. Rev. Psychol. 69, 77–103 (2017).
Watanabe, T. & Rees, G. Anatomical imbalance between cortical networks in autism. Sci. Rep. 6, 31114 (2016).
Just, M. A., Keller, T. A., Malave, V. L., Kana, R. K. & Varma, S. Autism as a neural systems disorder: a theory of frontal–posterior underconnectivity. Neurosci. Biobehav. Rev. 36, 1292–1313 (2012).
Watanabe, T., Rees, G. & Masuda, N. Atypical intrinsic neural timescale in autism. eLife 8, e42256 (2019).
Watanabe, T. et al. Bidirectional effects on interhemispheric resting‐state functional connectivity induced by excitatory and inhibitory repetitive transcranial magnetic stimulation. Hum. Brain Mapp. 35, 1896–1905 (2014).
Hamada, M. et al. Quadro-pulse stimulation is more effective than paired-pulse stimulation for plasticity induction of the human motor cortex. Clin. Neurophysiol. 118, 2672–2682 (2007).
Watanabe, T. et al. Effects of rTMS of pre-supplementary motor area on fronto basal ganglia network activity during stop-signal task. J. Neurosci. 35, 4813–4823 (2015).
Brascamp, J., Blake, R. & Knapen, T. Negligible fronto-parietal BOLD activity accompanying unreportable switches in bistable perception. Nat. Neurosci. 18, 1672–1678 (2015).
Aoki, Y. et al. Oxytocin improves behavioural and neural deficits in inferring others’ social emotions in autism. Brain 137, 3073–3086 (2014).
Watanabe, T. et al. Network structure underlying resolution of conflicting non-verbal and verbal social information. Soc. Cogn. Affect. Neurosci. 9, 767–775 (2014).
Courchesne, E., Press, G. A. & Yeung-Courchesne, R. Parietal lobe abnormalities detected with MR in patients with infantile autism. Am. J. Roentgenol. 160, 387–393 (1993).
Barttfeld, P. et al. Signature of consciousness in the dynamics of resting-state brain activity. Proc. Natl Acad. Sci. USA 112, 887–892 (2015).
Demertzi, A. et al. Human consciousness is supported by dynamic complex patterns of brain signal coordination. Sci. Adv. 5, eaat7603 (2019).
Deco, G. et al. Awakening: predicting external stimulation to force transitions between different brain states. Proc. Natl Acad. Sci. USA 116, 18088–18097 (2019).
Scangos, K. W., Makhoul, G. S., Sugrue, L. P., Chang, E. F. & Krystal, A. D. State-dependent responses to intracranial brain stimulation in a patient with depression. Nat. Med. 27, 229–231 (2021).
Gordon, P. C. et al. Recording brain responses to TMS of primary motor cortex by EEG—utility of an optimized sham procedure. NeuroImage 245, 118708 (2021).
Duecker, F. & Sack, A. T. Rethinking the role of sham TMS. Front. Psychol. 6, 210 (2015).
Power, J. D. et al. Functional network organization of the human brain. Neuron 72, 665–678 (2011).
Delorme, A. & Makeig, S. EEGLAB: an open source toolbox for analysis of single-trial EEG dynamics including independent component analysis. J. Neurosci. Methods 134, 9–21 (2004).
Hyvärinen, A., Ramkumar, P., Parkkonen, L. & Hari, R. Independent component analysis of short-time Fourier transforms for spontaneous EEG/MEG analysis. NeuroImage 49, 257–271 (2010).
Deligianni, F., Centeno, M., Carmichael, D. W. & Clayden, J. D. Relating resting-state fMRI and EEG whole-brain connectomes across frequency bands. Front. Neurosci. 8, 258 (2014).
Hjorth, B. EEG analysis based on time domain properties. Electroencephalogr. Clin. Neurophysiol. 29, 306–310 (1970).
Hamada, M. et al. Primary motor cortical metaplasticity induced by priming over the supplementary motor area. J. Physiol. 587, 4845–4862 (2009).
Seeck, M. et al. The standardized EEG electrode array of the IFCN. Clin. Neurophysiol. 128, 2070–2077 (2017).
Shirota, Y. et al. Influence of short-interval intracortical inhibition on short-interval intracortical facilitation in human primary motor cortex. J. Neurophysiol. 104, 1382–1391 (2010).
Schaworonkow, N., Triesch, J., Ziemann, U. & Zrenner, C. EEG-triggered TMS reveals stronger brain state-dependent modulation of motor evoked potentials at weaker stimulation intensities. Brain Stimul. 12, 110–118 (2019).
Hanajima, R. et al. Interhemispheric facilitation of the hand motor area in humans. J. Physiol. 531, 849–859 (2001).
Osada, T. et al. An essential role of the intraparietal sulcus in response inhibition predicted by parcellation-based network. J. Neurosci. 39, 2509–2521 (2019).
Ezaki, T., Watanabe, T., Ohzeki, M. & Masuda, N. Energy landscape analysis of neuroimaging data. Philos. Trans. A Math. Phys. Eng Sci. 375, 20160287 (2017).
Acknowledgements
This work was supported by Grant-in-Aid for Research Activity from Japan Society for Promotion of Sciences (19H03535, 21H05679, 23H04217), The University of Tokyo Excellent Young Researcher Project, Showa University Medical Institute of Developmental Disabilities Research, JST Moonshot R&D Program (JPMJMS2021), JST FOREST Program (JPMJFR2321) and Institute of AI and Beyond of UTokyo, Cross-Ministerial Strategic Innovation Promotion Program on ‘Integrated Health Care System’ (JPJ012425). We also appreciate the constructive comments of J. N. Sanes at Brown University and the support of the WPI-IRCN Human MRI Core, The University of Tokyo Institutes for Advanced Studies.
Ethics declarations
Competing interests
The authors declare no competing interests.
Peer review
Peer review information
Nature Neuroscience thanks Lucina Uddin, Ulf Ziemann and the other, anonymous, reviewer(s) for their contribution to the peer review of this work.
Additional information
Publisher’s note Springer Nature remains neutral with regard to jurisdictional claims in published maps and institutional affiliations.
Extended data
Extended Data Fig. 1 Efficiency of washout period.
We examined whether the two-month period between the 12-week BDNS and sham conditions washed out the effects of the longitudinal BDNS administration. To this aim, we focused on the data recorded from the 21 participants who first completed the 12-week BDNS condition and then went through all the 12-week sham condition (panel a). Technically, in Experiment 4, we revisited the neural and behavioral data obtained right before the BDNS session (that is, pre-BDNS data) at Weeks 1 and 13 of the BDNS condition and those obtained right before the sham session at Week 1 of the sham condition. For all the neural and behavioural indices, the two-month period showed wash-out effects. The indirect transition frequency was increased after the repetition of the BDNS sessions (t20 = 18.2, PBonferroni < 0.05 in a paired t-test for Week 13 v Week 1 in BDNS in panel b); however, after the two-month period, the index for the neural flexibility was reduced (t20 = 11.0, PBonferroni < 0.05 in a paired t-test for Week 13 in BDNS v Week 1 in sham in panel b). In fact, the indirect transition frequency at Week 1 in the sham condition was not significantly different from that at Week 1 in the BDNS condition (t20 = 1.8, PBonferroni > 0.05 in a paired t-test for Week 1 in BDNS v Week 1 in sham in panel b). The cognitive inflexibility was reduced after the repeated BDNS sessions (t20 = 14.5, PBonferroni < 0.05 in a paired t-test for Week 13 v Week 1 in BDNS in panel c); however, after the two-month period, the task-repetition length was prolonged (t20 = 7.7, PBonferroni < 0.05 in a paired t-test for Week 13 in BDNS v Week 1 in sham in panel c). This prolonged task-repetition length did not differ from that at Week 1 in the BDNS condition (t20 = 1.3, PBonferroni > 0.05 in a paired t-test for Week 1 in BDNS v Week 1 in sham in panel c). The perceptual overstability was reduced after the longitudinal BDNS condition (t20 = 18.5, PBonferroni < 0.05 in a paired t-test for Week 13 v Week 1 in BDNS in panel d); but, after the two-month period, the percept duration was prolonged (t20 = 10.2, PBonferroni < 0.05 in a paired t-test for Week 13 in BDNS v Week 1 in sham in panel d), and the prolonged percept duration was not different from that at Week 1 in the BDNS condition (t20 = 1.9, PBonferroni > 0.05 in a paired t-test for Week 1 in BDNS v Week 1 in sham in panel d). The utilisation of nonverbal social information showed a similar pattern. The NVJ proportion increased after the repeated BDNS sessions (t20 = 8.9, PBonferroni < 0.05 in a paired t-test for Week 13 v Week 1 in BDNS in panel e) but decreased after the two-month period (t20 = 3.7, PBonferroni < 0.05 in a paired t-test for Week 13 in BDNS v Week 1 in sham in panel e). The reduced NVJ proportion was not different from that at Week 1 in the BDNS condition (t20 = 2.0, PBonferroni > 0.05 in a paired t-test for Week 1 in BDNS v Week 1 in sham in panel e). Taken together, these results indicate that the two-month period between the BDNS and sham conditions worked as a washout period. *, PBonferroni < 0.05.
Extended Data Fig. 2 Process of the fitting to the pairwise maximum entropy model (MEM).
We fitted the pairwise MEM to the neural data with a gradient ascent algorithm. This plot shows an example of such a fitting to an rsfMRI dataset obtained from Participant #1 in the ASD group in Experiment 1.
Extended Data Fig. 3 Online preprocessing of EEG signals.
In the online EEG preprocessing, we extracted a gamma-band Hjorth EEG signal and fitted Hilbert envelop function to it. Then, by applying Yule-Walker equation to the time-series data, we predicted the EEG signal.
Extended Data Fig. 4 Online EEG analysis.
Using all the predicted EEG signal, we calculated an average network activity for each of the nine brain systems. After binarising the network activities, we classified each time point to one of brain states. This classification was based on the information sheet that was obtained in the experiment 1.
Extended Data Fig. 5 Timing of TMS.
We started TMS at T = 25msec. We administered the TMS only when we predicted that the target brain state would emerge dominantly in the forthcoming period ( > 90% in the time window between T=25msec and T=175msec).
Supplementary information
Supplementary Information
Abbreviations, acronyms and other specific terms for this study, Supplementary Figs. 1–10, Tables 1 and 2, Methods and References.
Rights and permissions
Open Access This article is licensed under a Creative Commons Attribution-NonCommercial-NoDerivatives 4.0 International License, which permits any non-commercial use, sharing, distribution and reproduction in any medium or format, as long as you give appropriate credit to the original author(s) and the source, provide a link to the Creative Commons licence, and indicate if you modified the licensed material. You do not have permission under this licence to share adapted material derived from this article or parts of it. The images or other third party material in this article are included in the article’s Creative Commons licence, unless indicated otherwise in a credit line to the material. If material is not included in the article’s Creative Commons licence and your intended use is not permitted by statutory regulation or exceeds the permitted use, you will need to obtain permission directly from the copyright holder. To view a copy of this licence, visit http://creativecommons.org/licenses/by-nc-nd/4.0/.
About this article
Cite this article
Watanabe, T., Yamasue, H. Noninvasive reduction of neural rigidity alters autistic behaviors in humans. Nat Neurosci (2025). https://doi.org/10.1038/s41593-025-01961-y
Received: 23 June 2024
Accepted: 27 March 2025
Published: 06 June 2025
DOI: https://doi.org/10.1038/s41593-025-01961-y


