.png)


content, reviewed by leading industry experts and seasoned editors. Ad Disclosure
Bitcoin’s price dropped sharply over the weekend, briefly touching $98,000 before recovering to above the $100,000 mark. The sudden decline rattled investors and fueled speculation about a potential double top forming near the all-time high. While market sentiment has turned increasingly cautious, especially amid global geopolitical tensions, on-chain data suggests the correction may be more of a consolidation than a reversal.
According to CryptoQuant, there are no alarming signals from long-term holders, who remain largely inactive despite recent volatility. The 30-day moving average of Binary Coin Days Destroyed (CDD) shows that long-term holder behavior remains stable. Historically, a Binary CDD 30MA reading above 0.8 has preceded significant corrections, but the current cycle peaked closer to 0.6 and is now trending lower. This moderation implies that the market is not yet overheated and may be preparing for its next move.
Overall, Bitcoin appears to be in a quiet accumulation phase. If history repeats, this silent period could precede the next leg up. With price holding firmly above $100K and no significant selling pressure from long-term holders, the market may simply be resetting before a renewed push, rather than entering a broader downtrend.
Bitcoin Consolidates Amid Geopolitical Turmoil
Bitcoin is currently trading 10% below its all-time high, with bulls attempting to reclaim higher levels to confirm a potential bottom. Despite recent volatility triggered by escalating Middle East tensions, the broader structure still appears intact. Price is holding above the critical $100,000 zone, and although short-term sentiment remains cautious, on-chain data suggests Bitcoin may be in a healthy consolidation phase rather than entering a full-blown correction.
According to insights from CryptoQuant, long-term holders continue to show confidence. The 30-day moving average of Binary Coin Days Destroyed (CDD)—a metric used to measure the movement of older coins—has declined after peaking around 0.6. Historically, values above 0.8 have marked overheated market conditions that often precede larger corrections. The current moderation below this threshold implies a lower risk of long-term holder distribution, which typically signals market strength.
 Bitcoin price and volume | Source: CryptoQuant
This pattern aligns with previous consolidation phases in Bitcoin’s history, where periods of low volatility and bearish sentiment set the stage for powerful upward movements. While the market may still face further time-based or mild price corrections, the overall structure remains bullish over a longer horizon.
Importantly, the current pullback should not be mistaken for the end of the cycle. As seen in past bull markets, Bitcoin often climbs in a staircase-like pattern, alternating between consolidation and expansion. With fear dominating headlines and attention drifting, this phase of relative quiet could be setting the foundation for the next explosive rally. Caution is warranted, but as long as key supports hold and long-term holders remain steady, the broader trend remains favorable for the bulls.
Price Action Details: Holding above $100K
On the weekly chart, Bitcoin (BTC) continues to hold above the psychological $100,000 level, maintaining a strong macro uptrend despite recent volatility. After dipping as low as $98,000 during the weekend, BTC swiftly recovered and is now consolidating between the $103,600 and $109,300 resistance zones. These two yellow-highlighted levels mark a significant range that BTC must break through decisively to resume its upward momentum.
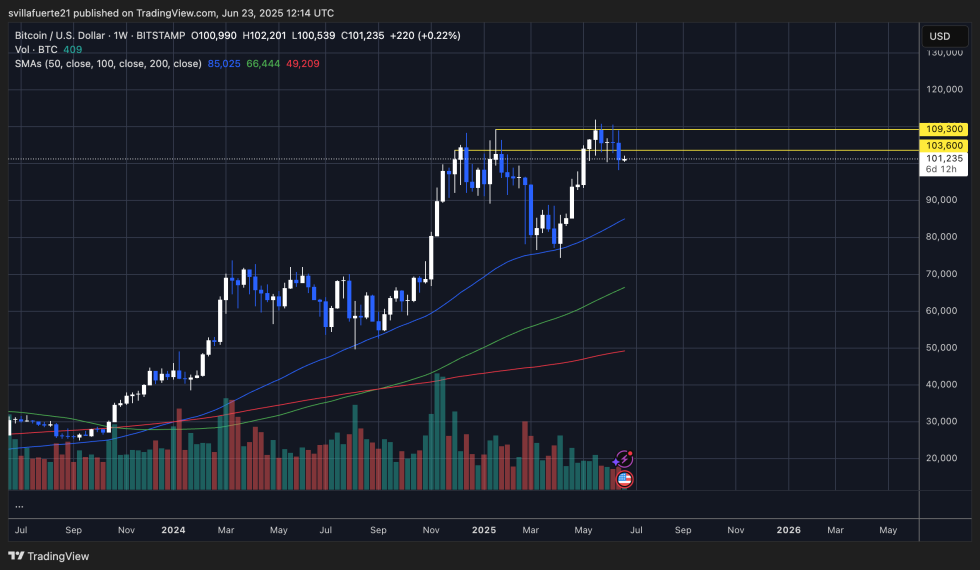 BTC holding above $100K | Source: BTCUSDT chart on TradingView
Currently, BTC trades around $101,200, just under the key weekly resistance at $103,600. A weekly close above this level would be bullish, potentially opening the door to retesting the $109,300 local high. However, continued rejection from this zone could lead to extended consolidation or even downside pressure if global risks—such as rising Treasury yields and geopolitical instability—intensify.
On the downside, BTC remains well above the 50-week simple moving average (SMA) at $85,025, which continues to act as long-term dynamic support. The structure of higher lows since early 2024 still holds, suggesting that the current price action may be part of a broader consolidation within the ongoing bull cycle.
Volume has remained moderate, with no extreme spikes to indicate capitulation or euphoria. Until a clear breakout occurs, BTC appears to be in a healthy mid-cycle consolidation, gathering strength for the next move.
Featured image from Dall-E, chart from TradingView
Editorial Process for bitcoinist is centered on delivering thoroughly researched, accurate, and unbiased content. We uphold strict sourcing standards, and each page undergoes diligent review by our team of top technology experts and seasoned editors. This process ensures the integrity, relevance, and value of our content for our readers.