.png)

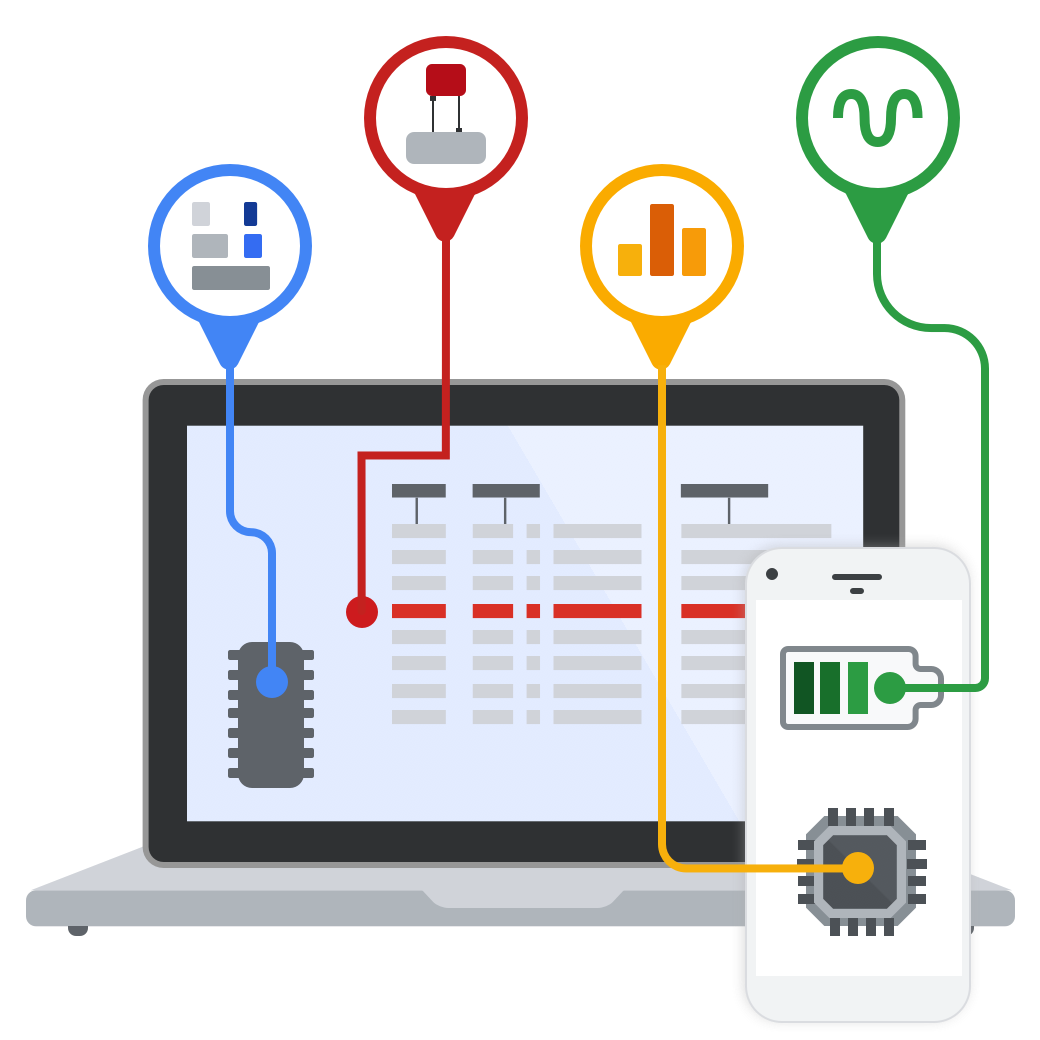
System-wide profiling for Linux and Android
sort
Linux kernel tracing
Capture high frequency ftrace data: scheduling activity, task switching latency, CPU frequency and much more
nfc
Userspace profilers and extra probes
Native heap profiling, Java heap profiling, pollers for /proc stat files
android
Built into Android
Part of the platform since Android 9 Pie, runs on Linux as well
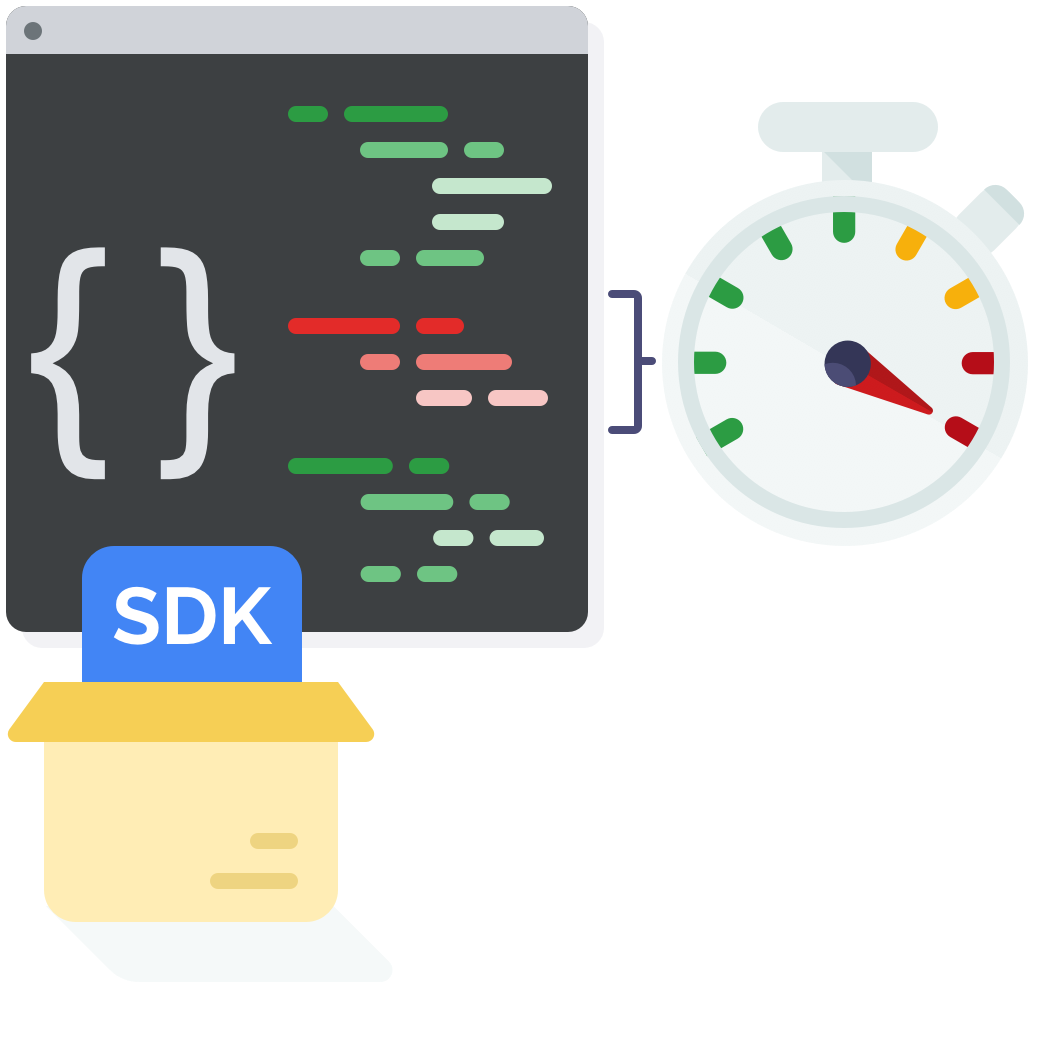
App Tracing
developer_mode
Efficient trace point instrumentation
Log your C++ app’s activity with high throughput, low overhead trace points
ballot
Structured and configurable events
Define custom protobuf messages to represent strongly-typed app-specific information, trace only what you need
view_compact
Integrated with system-wide tracing
Correlate your app’s state with system-wide profiling data on the same timeline
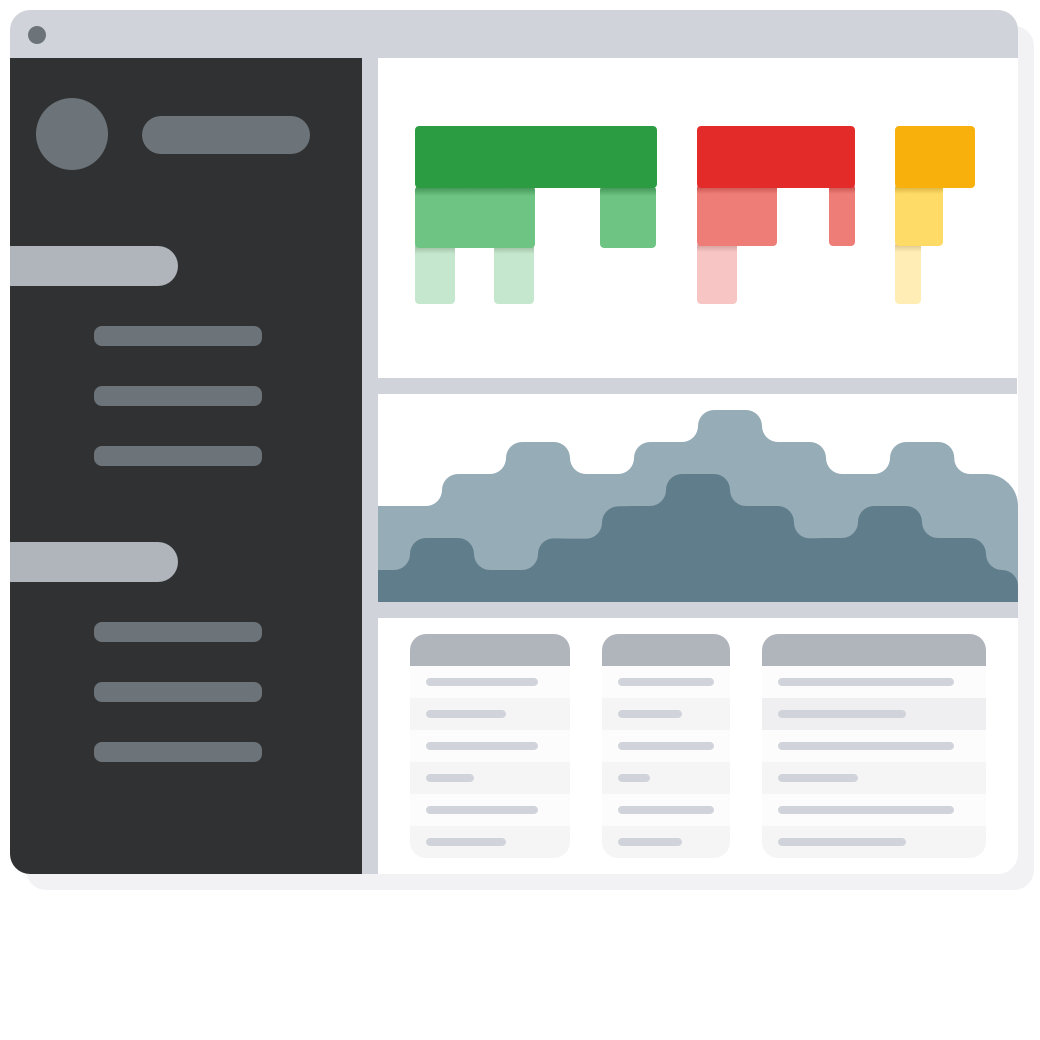
Trace Viewer
timeline
Interactive trace exploration
Record, view and process trace data with the Perfetto UI
file_copy
Supports popular trace format files
TraceEvent JSON, Android systrace, ftrace text output
offline_bolt
Runs fully in your browser
No server interaction involved, works even if you are offline

Trace Analysis
storage
SQL-based trace model
Trace processor ingests traces and exposes a SQLite-based interface to access the contents of the trace, both via shell and UI
speed
Large trace analysis
Supports traces up to tens of GBs
compare_arrows
Interoperable
Can import and export popular trace formats: Chromium JSON trace format, Android Systrace, ftrace, CSV