.png)

Like the rest of the economy, AI has a vibes gap.
Workers are more likely to believe that Artificial Intelligence is a problem for other people than that it is a problem for their own jobs. To be more precise, in our recent survey of over 1,500 American workers, about 24 percent of respondents said AI was a direct threat to their career, while a much larger 42 percent said it was a threat to the availability or quality of jobs more broadly.
This AI vibes gap mirrors a common pattern where individuals often rate their own position more positively than the broader economy.
What else might be learned when we peel apart the AI anxiety onion by using the rich set of characteristics and beliefs studied in our survey?
One unmistakable pattern is that workers who actually use AI are much less worried about it, both in terms of their own career and for the economy writ large. Even more important than use, however, is a particular combination of pessimistic beliefs.
In fact, the more we dig into the findings, the more it appears that who we are — service or manufacturing worker, high-income or low-income earner, young or old, Democrat or Republican — doesn’t much influence our views on AI. Much more predictive is our existing set of beliefs.
We start by estimating differences in concern about AI between different groups of workers based on their AI use, beliefs, and characteristics.
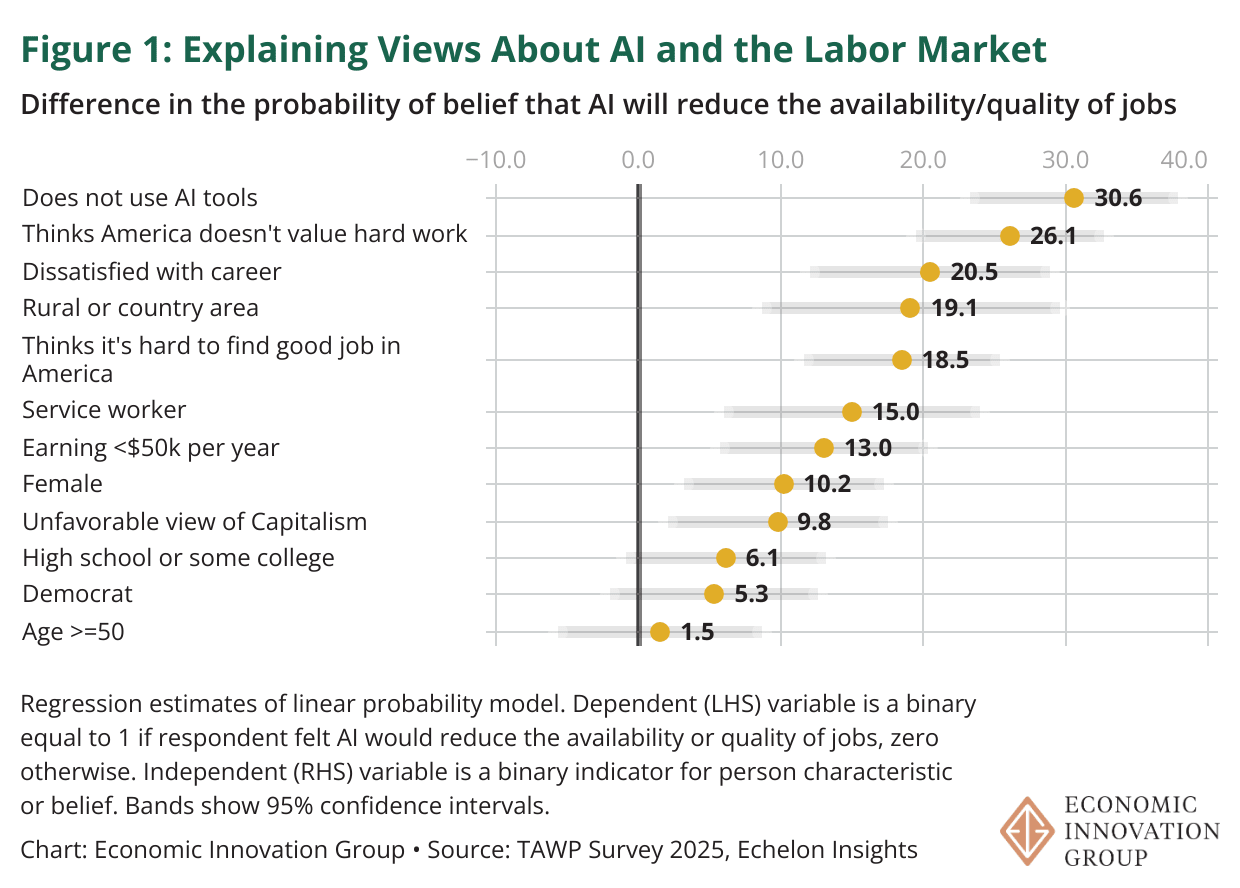
As shown in Figure 1, the biggest gap in general AI anxiety is between workers that use AI and those that don’t. Workers that don’t use AI are 31 percentage points more likely to say that AI is a threat to jobs than workers who do use it.
One plausible reason why the gap is so large is that using AI makes its (current) limitations more salient — functioning as a kind of exposure therapy that inoculates workers against fears about its impact. Or maybe using AI highlights the ways that it can complement their work.
Three of the five largest differences center around beliefs. Workers who express pessimism about societal appreciation of hard work, the availability of good jobs in the economy, and those dissatisfied with their career are 18 to 26 percentage points more likely to see AI as a threat to jobs.
Worker characteristics also seem to play a role in shaping broad-based AI anxieties. Workers in rural areas, those in the service sector, and those earning less than $50,000 per year are 13 to 19 percentage points more likely to say AI is a threat. Finally, females and those with unfavorable views of capitalism are about 10 percentage points more likely to express concern about AI.
Interestingly, the remaining characteristics — including education, age, and political affiliation — show no statistical differences.
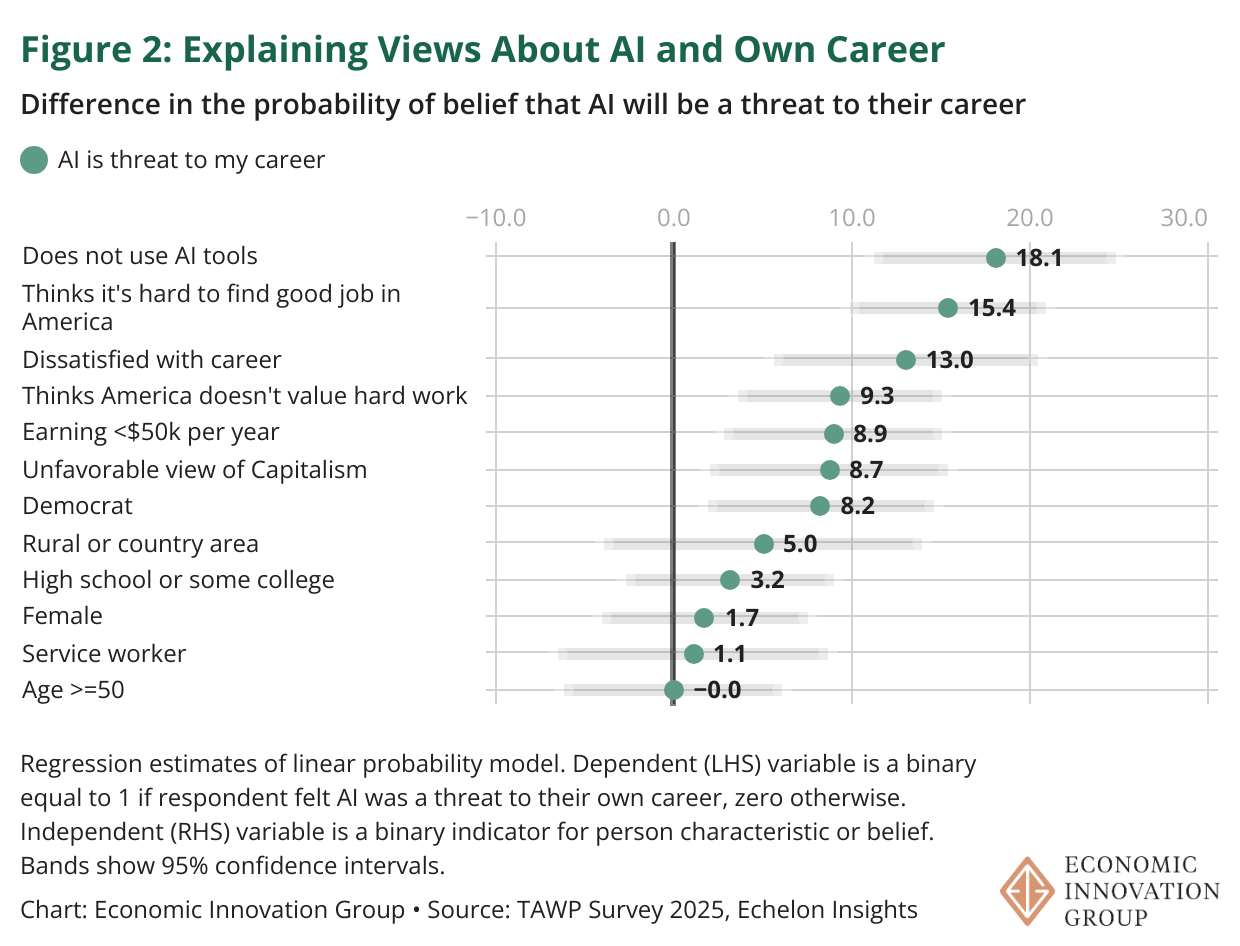
Now let’s turn to worries a bit closer to home — anxiety about the effects of AI on a worker’s own career.
As shown in Figure 2, the biggest gap in own-career AI concerns is, yet again, between those who use AI and those who do not. Workers who don’t use AI are 18 percentage points more likely to see AI as a threat to their career.
Pessimism also plays an important role. Workers with a negative view of the labor market, those saying hard work isn’t valued like it used to be, and workers dissatisfied with their career are 9 to 15 percentage points more likely to be concerned about the effects of AI on their career.
Worker characteristics play a less pronounced role. The only characteristics that show statistical differences are earnings and political affiliation. Workers earning less than $50,000 per year and those affiliated with the democratic party are 8 to 9 percentage points more likely to be concerned about the impact of AI on their career.
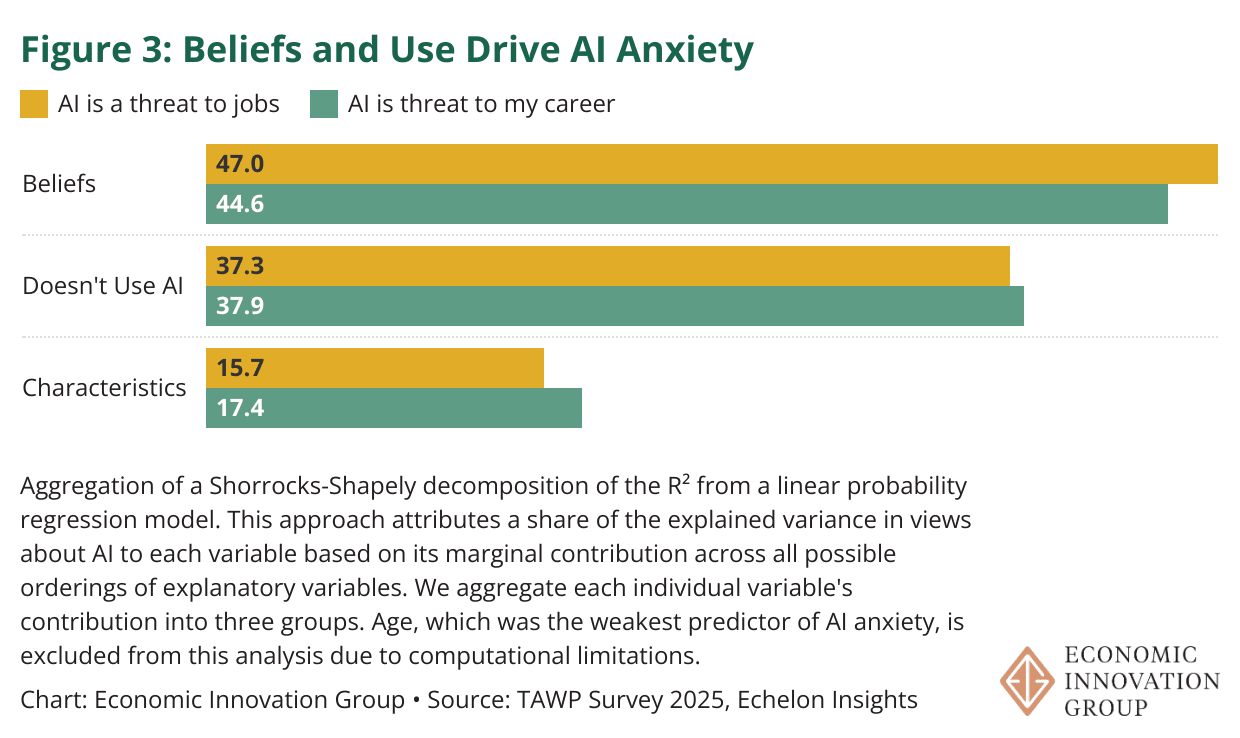
Ultimately, the combination of beliefs captured in our survey explains about 47 percent of worries about AI and the labor market and 45 percent of AI own-career concern. AI use captures another 37 to 38 percent, and characteristics only about 16 to 17 percent. (See Figure 3, the Appendix below, and our Github page for more about our methodology in arriving at these figures.)
Even though AI use is the single strongest predictor of AI anxiety, this bundle of pessimistic beliefs together helps explain more of the variation in AI anxiety, each soaking up about 12 percent of the variation on average.
AI Survey Questions
Which of these statements comes closest to your view of artificial intelligence (AI) and American workers, even if none are exactly right?
AI is a threat to significantly reduce the availability or quality of jobs 42%
AI probably evens out to neutral or no impact on the availability or quality of jobs 24%
AI is an opportunity to significantly improve the availability or quality of jobs 28%
Unsure 6%
Which of these statements comes closest to your view of AI and your career (e.g., your job or the job you’re looking for), even if none are exactly right?
AI is an opportunity that could improve my career opportunities and/or job satisfaction 31%
AI probably evens out to neutral or no impact on my career and/or job satisfaction 38%
AI is a threat that could harm my career opportunities and/or job satisfaction 24%
Unsure 7%
Do you currently use artificial intelligence tools (e.g., ChatGPT, AI assistants, automation software) in your job or personal life? Select all that apply. [RANDOMIZE 1-2]
Yes, for personal tasks (e.g., planning, learning, entertainment) 50%
Yes, for my job (e.g., writing, data analysis, customer service) 36%
No, I do not use AI tools 33%
Unsure if I use AI tools 3%
Variable Definitions
All reported statistics use survey weights.
“Does not use AI tools” - Answered “No, I do not use AI tools” to the question “Do you currently use artificial intelligence tools (e.g., ChatGPT, AI assistants, automation software) in your job or personal life? Select all that apply.” Options include: “Yes, for personal tasks (e.g., planning, learning, entertainment)”, “Yes, for my job (e.g., writing, data analysis, customer service)”, “No, I do not use AI tools”, and “Unsure if I use AI tools”.
“Thinks America doesn’t value hard work” - Answered “America doesn’t value hard work the way it used to. Too many people no longer take pride in their work or expect high effort from others.” to the question “Which of these statements comes closest to your view, even if neither is exactly right?” Options include: “America doesn’t value hard work the way it used to. Too many people no longer take pride in their work or expect high effort from others”, “America is still a country that values hard work. Most people take pride in doing their jobs well and expect others to do the same”, and “Unsure”.
“Dissatisfied with career” - Answered “Very dissatisfied” or “Somewhat dissatisfied” to the question “Would you say you are satisfied or dissatisfied with your overall career.” Options include: “Very dissatisfied”, “Somewhat dissatisfied”, “Neither satisfied nor dissatisfied”, “Somewhat satisfied”, “Very satisfied”, and “Unsure”.
“Rural or country area” - Answered “Rural or country area” to the question “How would you describe the area in which you live?” Options include: “City”, “Suburb near a city”, “Small town not near a city”, and “Rural or country area”.
“Thinks it’s hard to find good job in America” - Answered “Very hard” or “Somewhat hard” to the question “Would you say it is easy or hard to find a good job with good pay for American workers in general?” Options include: “Very hard”, “Somewhat hard”, “Neither easy nor hard”, “Somewhat easy”, “Very easy”, and “Unsure”.
“Service worker” - Answered “Service worker, like work in a store, hospital, or restaurant” to the question “Which of the following comes closest to describing the kind of work you do?” Options include: “White collar worker, like work at a desk or an office”, “Blue collar worker, like work with my hands or in a factory”, “Service worker, like work in a store, hospital, or restaurant”, and “Unsure”.
“Earning <$50k per year” - Answered “Less than $30,000 per year” or “$30,000 to $49,999 per year” to the question “In total, how much were your personal individual earnings from your job(s)/employer(s) in 2024, before taxes and other deductions? Please include wages/salary, overtime, tips, and bonus pay in your total earnings. For those who were self-employed, please specify the amount earned after subtracting business expenses.”
“Female” - Answered “Woman” to the question “Do you describe yourself as a man, a woman, or in some other way?” Options include: “Man”, “Woman”, and “Some other way”.
“Unfavorable view of Capitalism” - Answered “Very unfavorable” or “Somewhat unfavorable” to the question “Would you say you have a favorable or unfavorable view of Capitalism as an economic ideology?” Options include: “Very unfavorable”, “Somewhat unfavorable”, “Heard of, no opinion”, “Somewhat favorable”, “Very favorable”, and “Never heard of”.
“High school or some college” - Answered “High school or less” or “Some college” to the question “What is the highest level of education you have completed?” Options include: “High school or less”, “Some college”, “Associate degree”, “Bachelor’s degree”, “Graduate degree”, and “Prefer not to say”.
“Democrat” - Answered “Democrat” to the question “Do you consider yourself a...?” Options include: “Republican”, “Democrat”, “Independent”, “Member of another party”, and “Unsure”.
“Age >=50” - Answered “50 - 64” or “65+” to the question “What is your age?”. Options include: “18 - 34”, “35 - 49”, “50 - 64”, and “65+”.
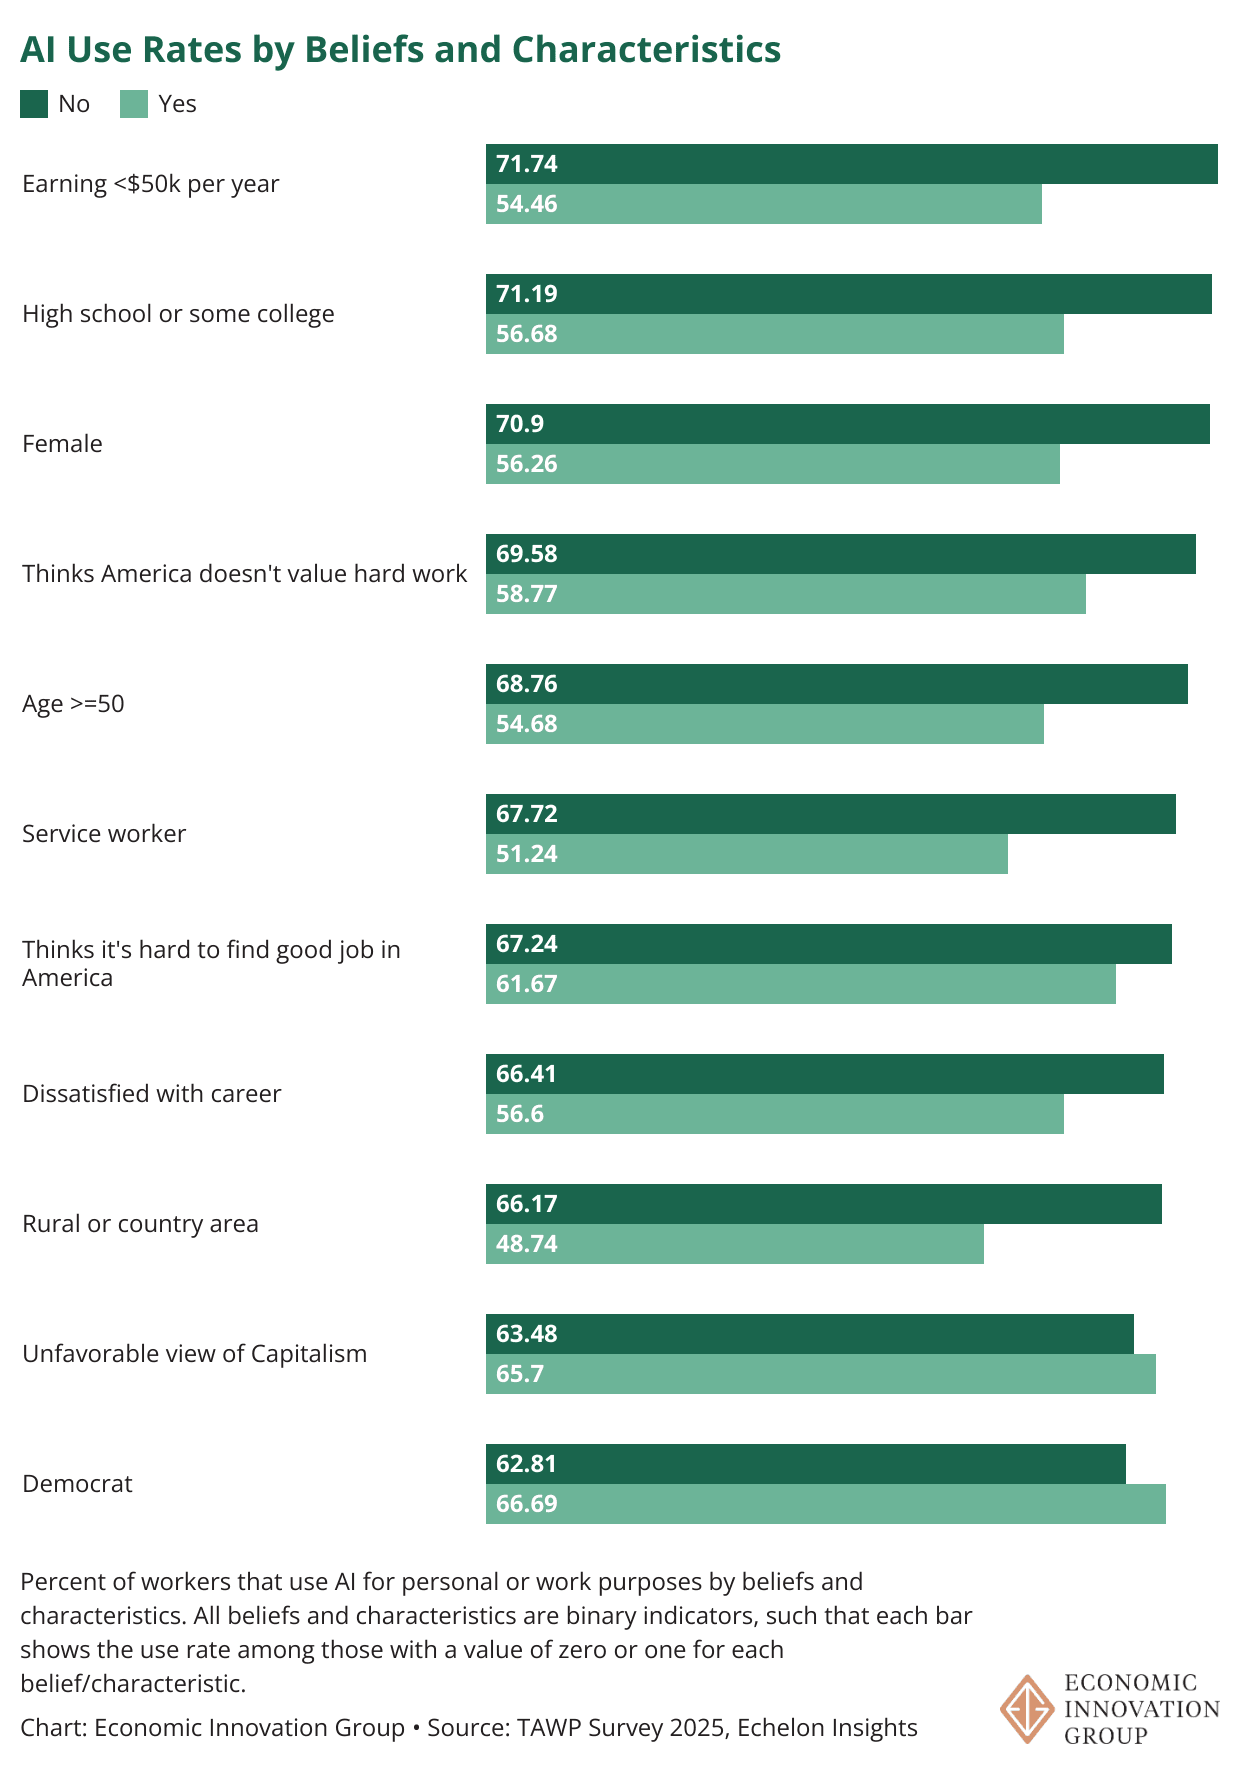
Who Uses AI?
The overall use rate, defined as using AI for either personal or work tasks, is 64% in our survey. About 36% of individuals report using AI for work tasks (e.g., writing, data analysis, customer service) and 50% report using AI for personal tasks (e.g., planning, learning, entertainment). The share using AI for work tasks is similar in magnitude to Hartley et al. (2025), who found 36.7% adoption among U.S. workers in September 2025 and higher than the Bick et al. (2024) estimate of 23% at the end of 2024.
The chart below describes how the use of AI (for work or personal tasks) varies by individual beliefs and characteristics. The highest AI use rate is among those earning more than $50 thousand per year (72%) followed by those with a college education (71%) and males (71%). The lowest use rates are found among workers in rural communities (49%).
Shapley Decomposition
We use the Shorrocks-Shapely decomposition to measure how much of the variation in AI anxiety is explained by groupings of different variables. This method provides an order-invariant way to attribute the overall explanatory power of a regression model (e.g., its R²) to individual independent variables or groups thereof. It does so by computing, for every possible ordering of variables, the marginal increase in the model’s R² when a variable is added, and then averages the variable’s contribution across all orderings. The resulting values represent each variable’s average contribution to explaining variation in the outcome, independent of the order in which variables enter the model. Additional information on the computation can be found here.
View the Github with code for replicating this analysis here.