.png)


I’m so excited to finally introduce Plotly Studio. Plotly Studio is our new AI-native desktop app for creating data apps and visualizing data. This milestone marks the beginning of the third chapter of our company, and underlines our mission to make flexible and sophisticated visual analytics accessible for all.
Plotly Studio automatically generates beautiful data apps in two minutes with nothing but your dataset and optional context or goals.
It's now available for Early Access - Sign Up here.
It's this easy:
![]()
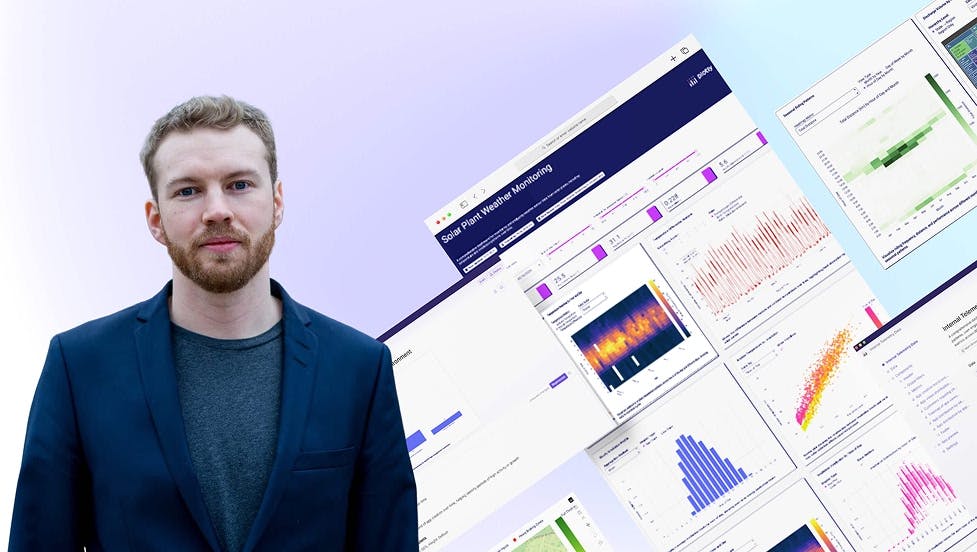
Chris Parmer, Plotly Co-Founder and Author of Dash, introduces Plotly Studio.
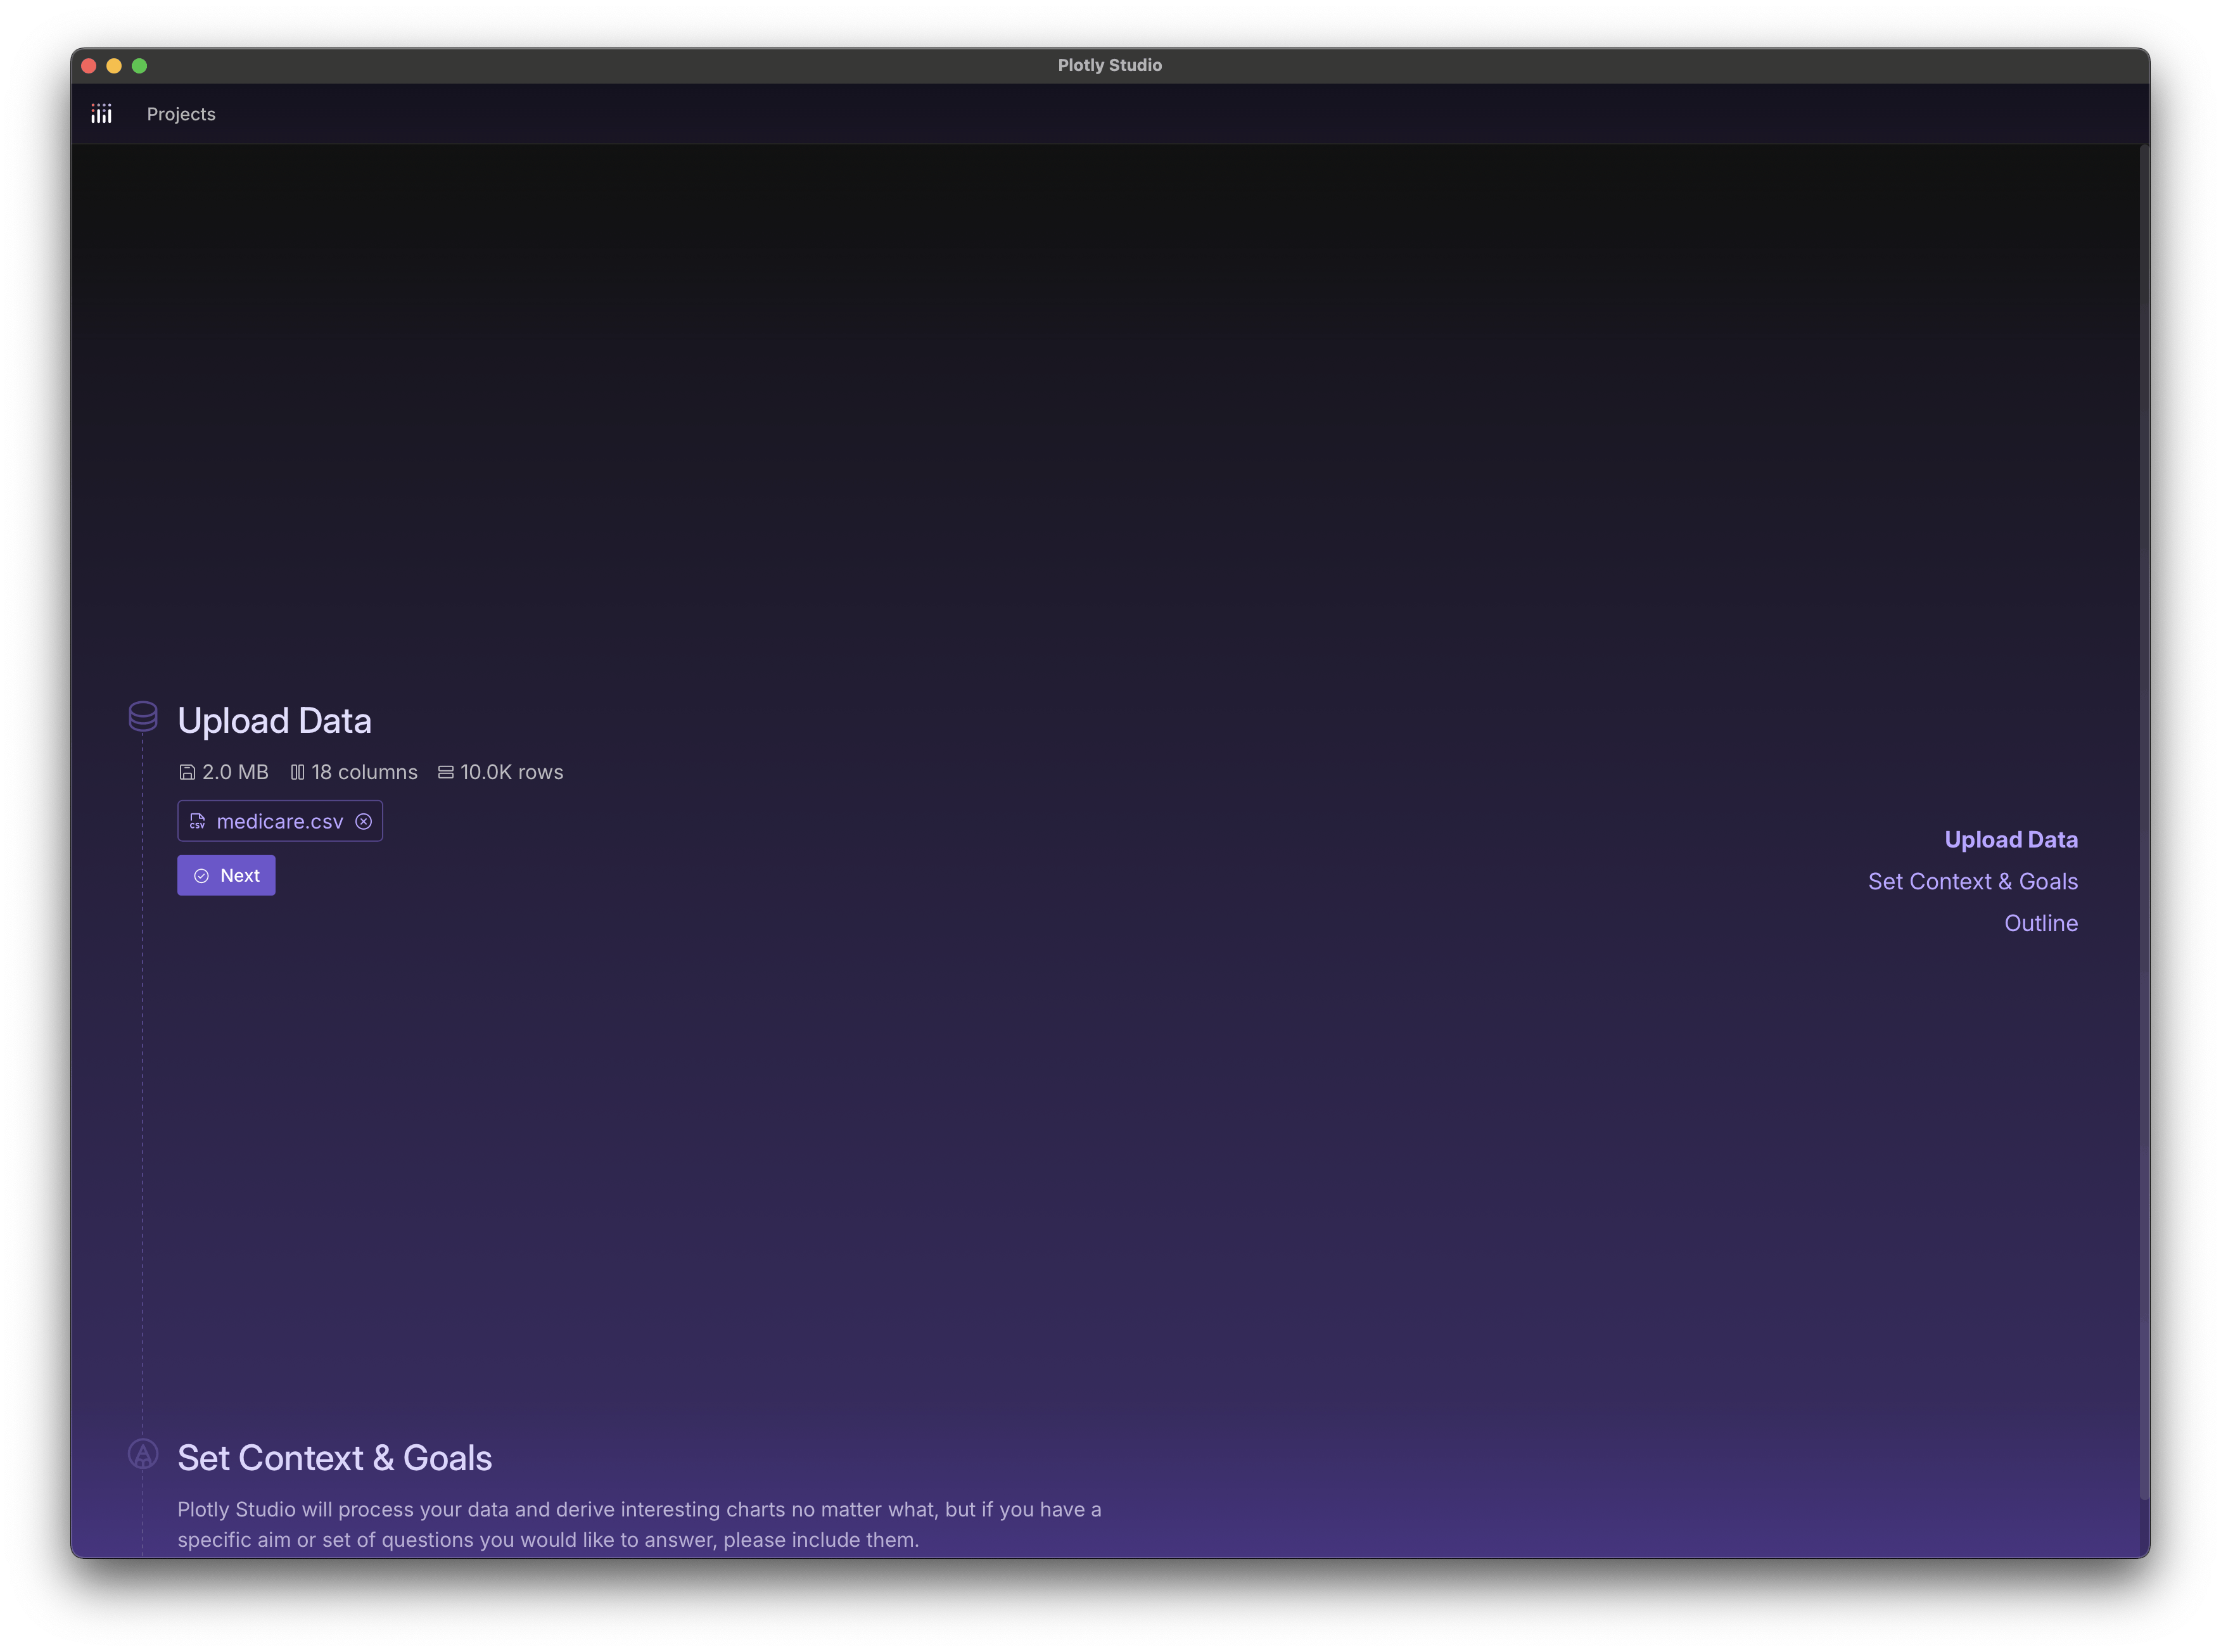
Step 1 - Import your data
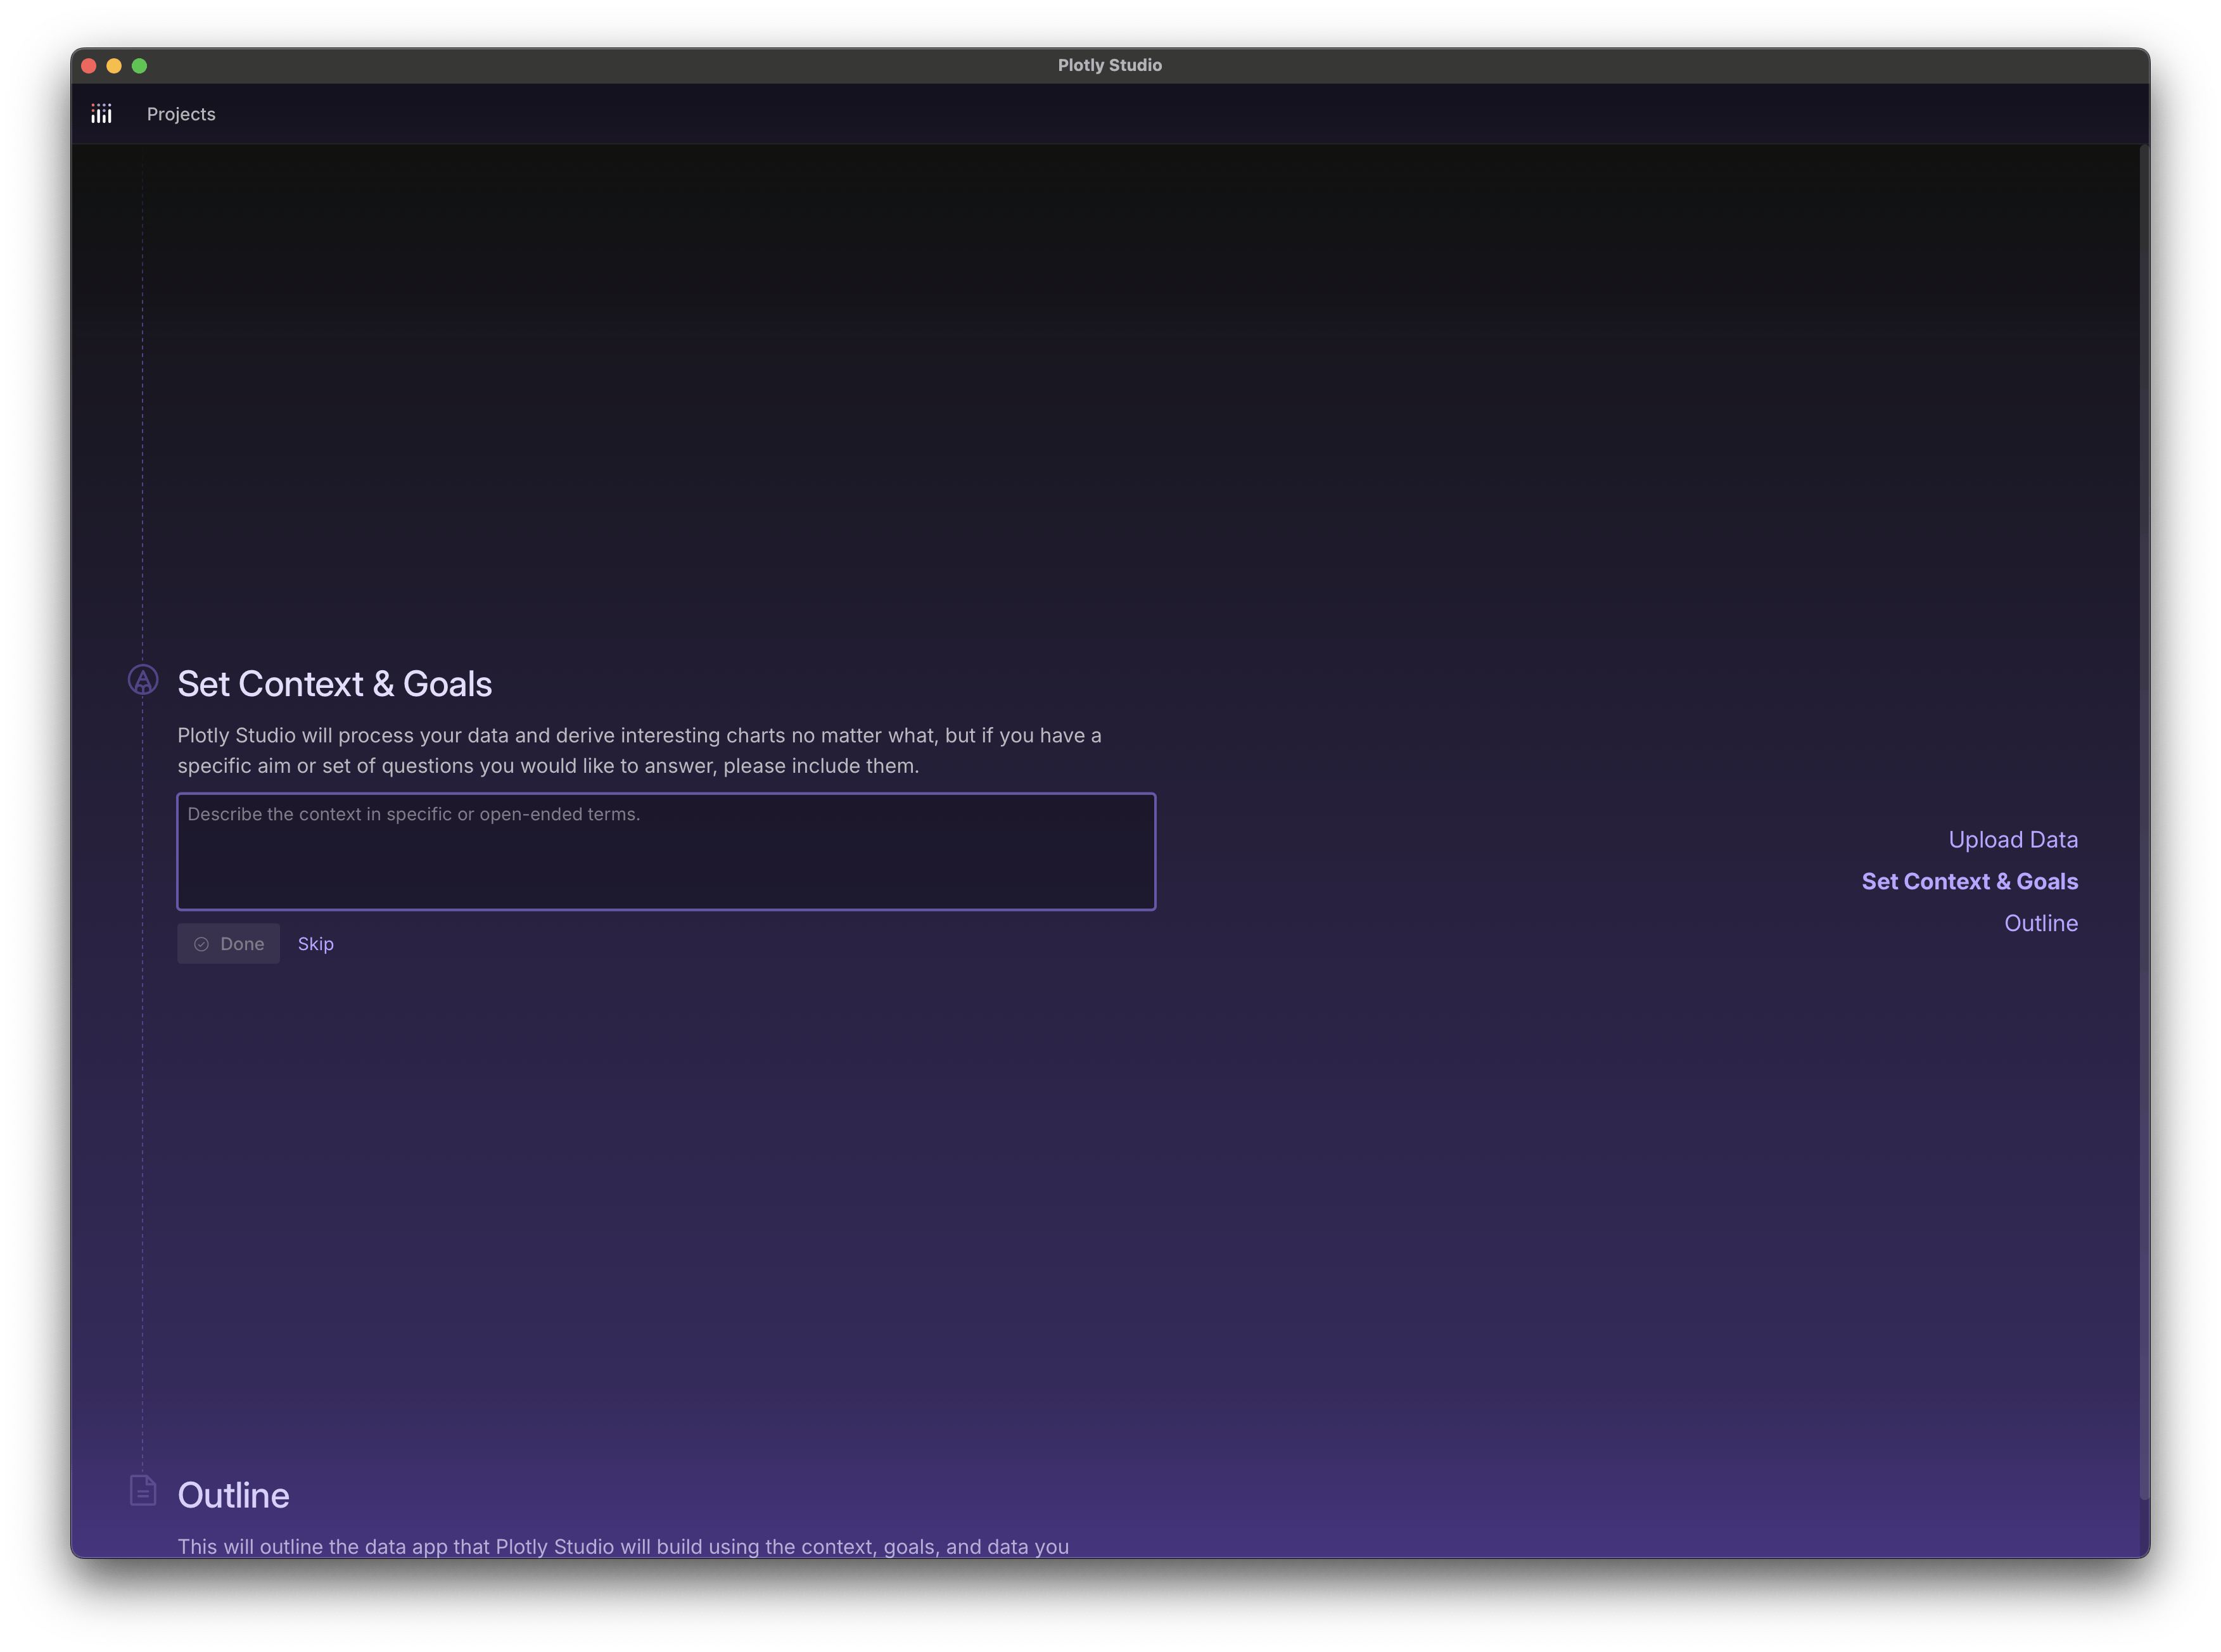
Step 2 - Provide additional context about your dataset (certain columns to include or ignore, tribal knowledge, units, etc) or goals about what you're trying to make or explore. This section is optional and we recommend seeing what Plotly Studio creates on its own first.
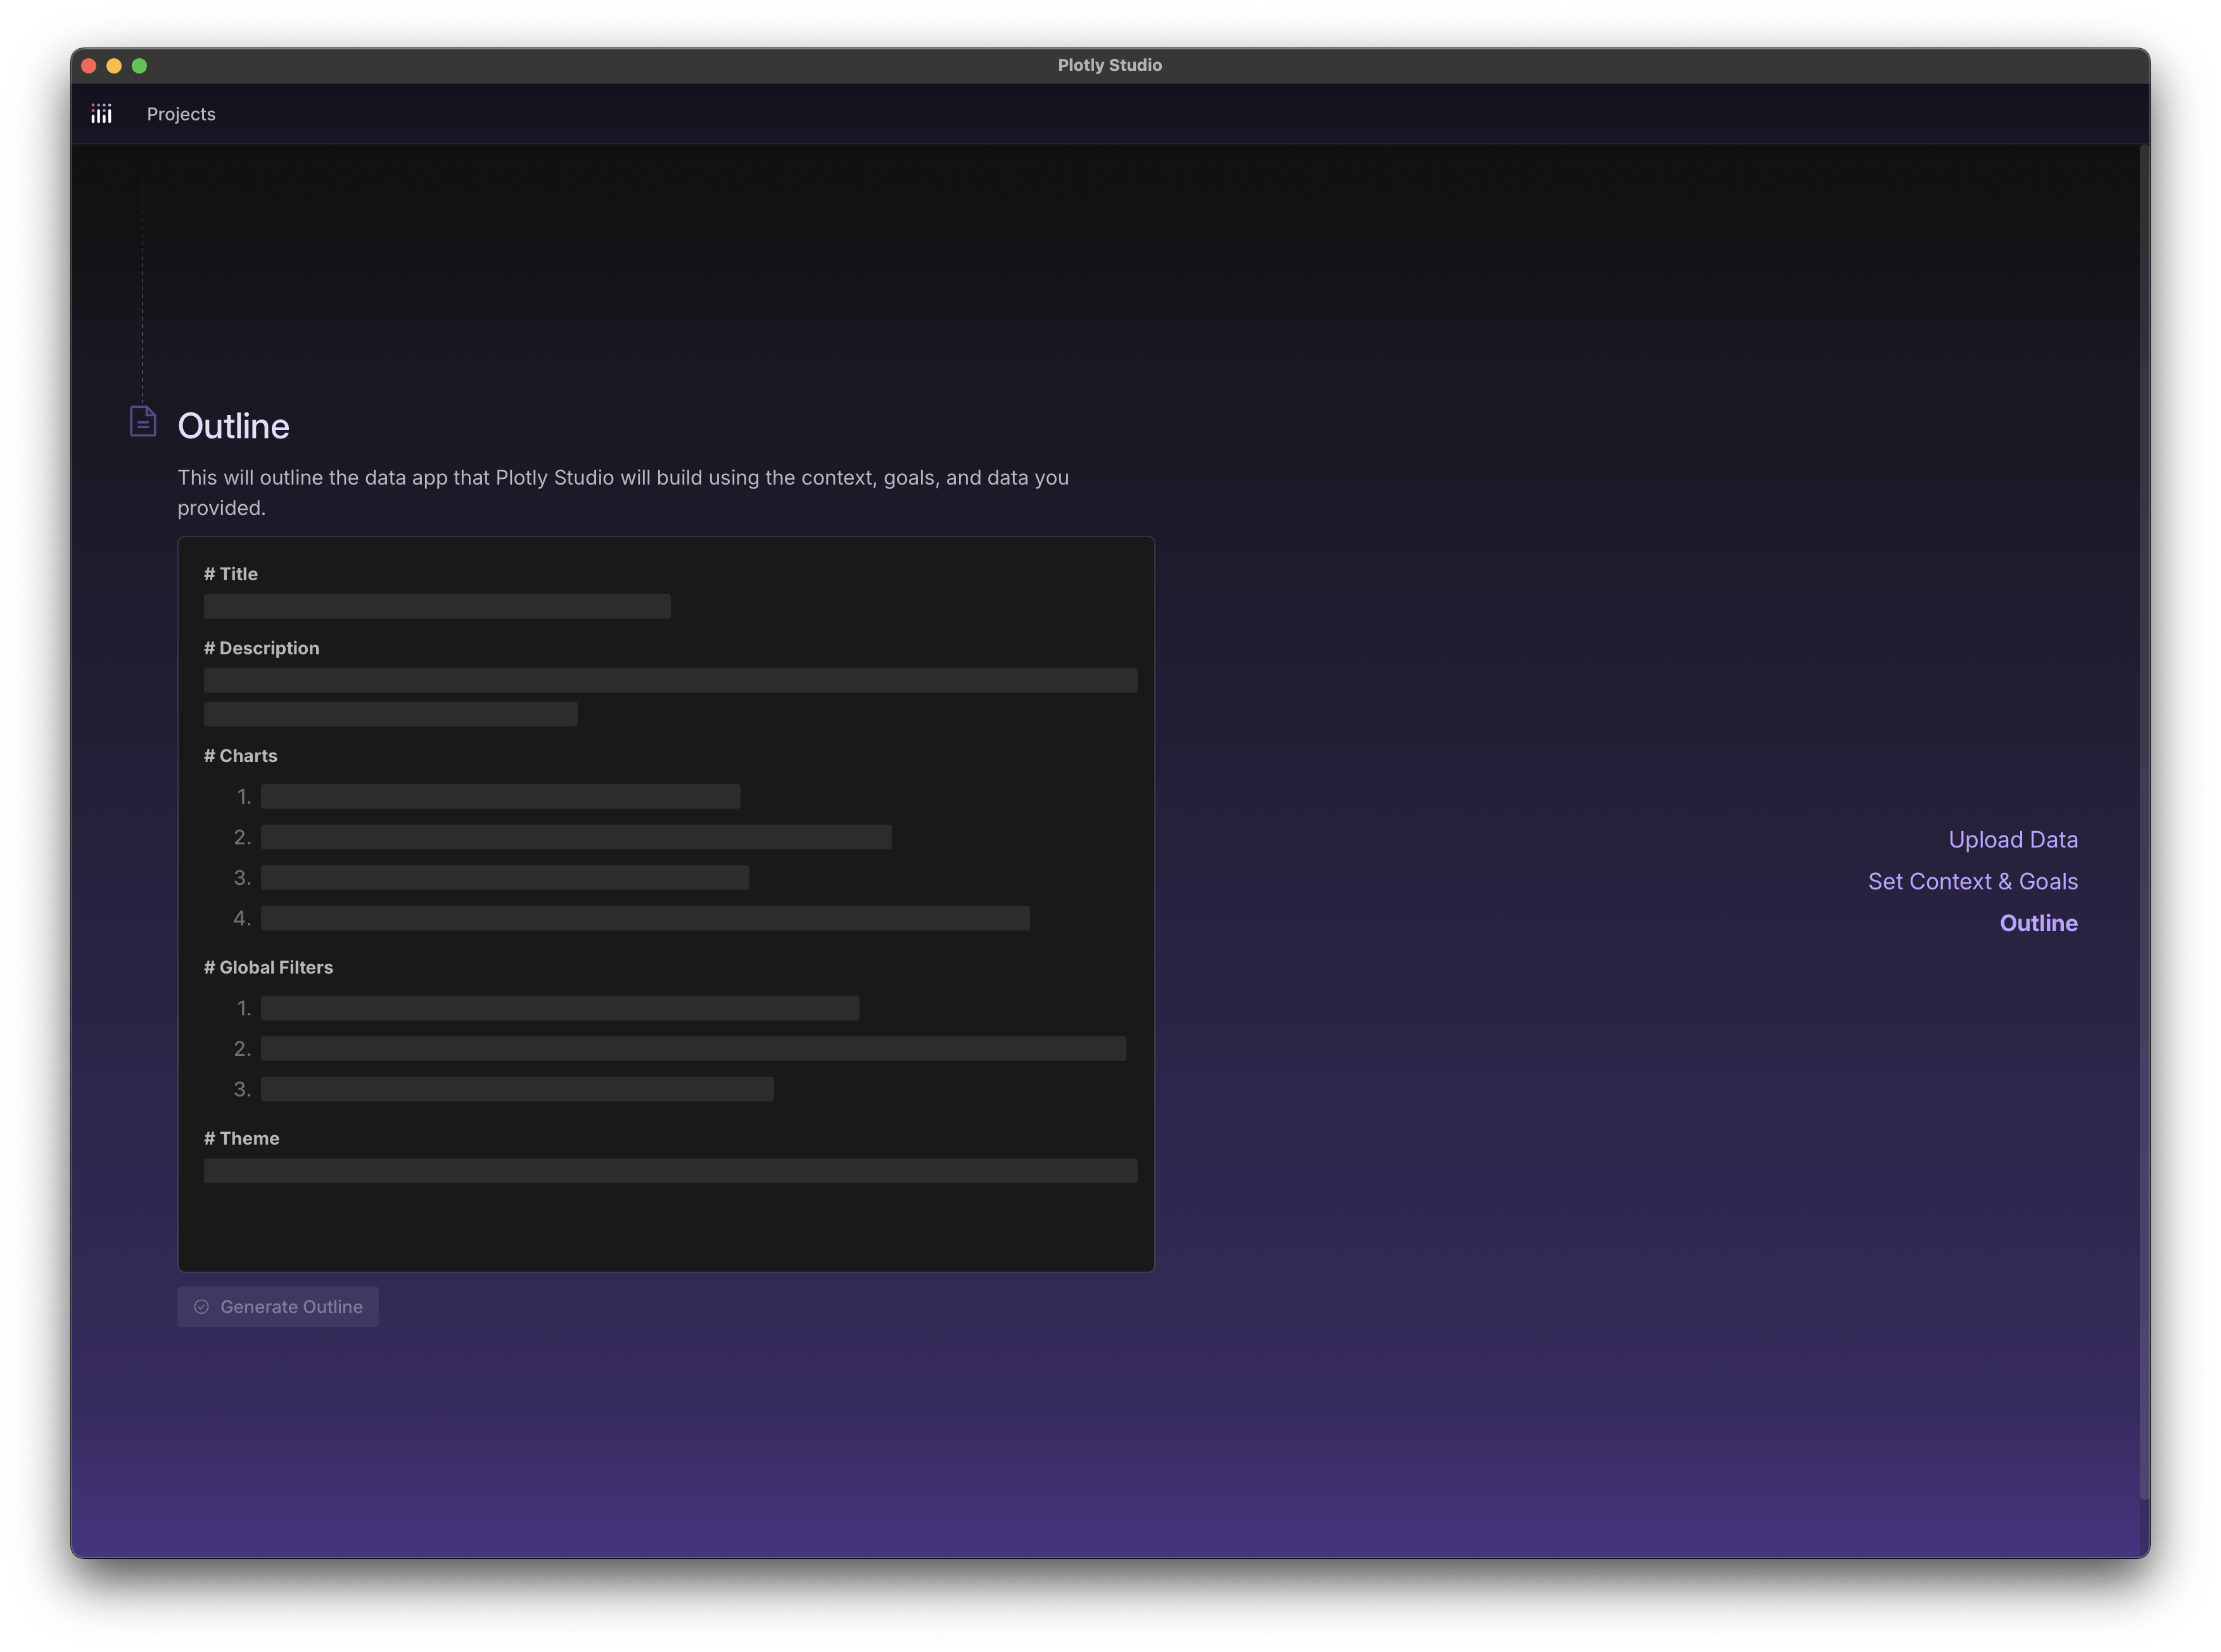
Step 3. Plotly Studio automatically generates an outline of your data app based off of your dataset, context, and goals.
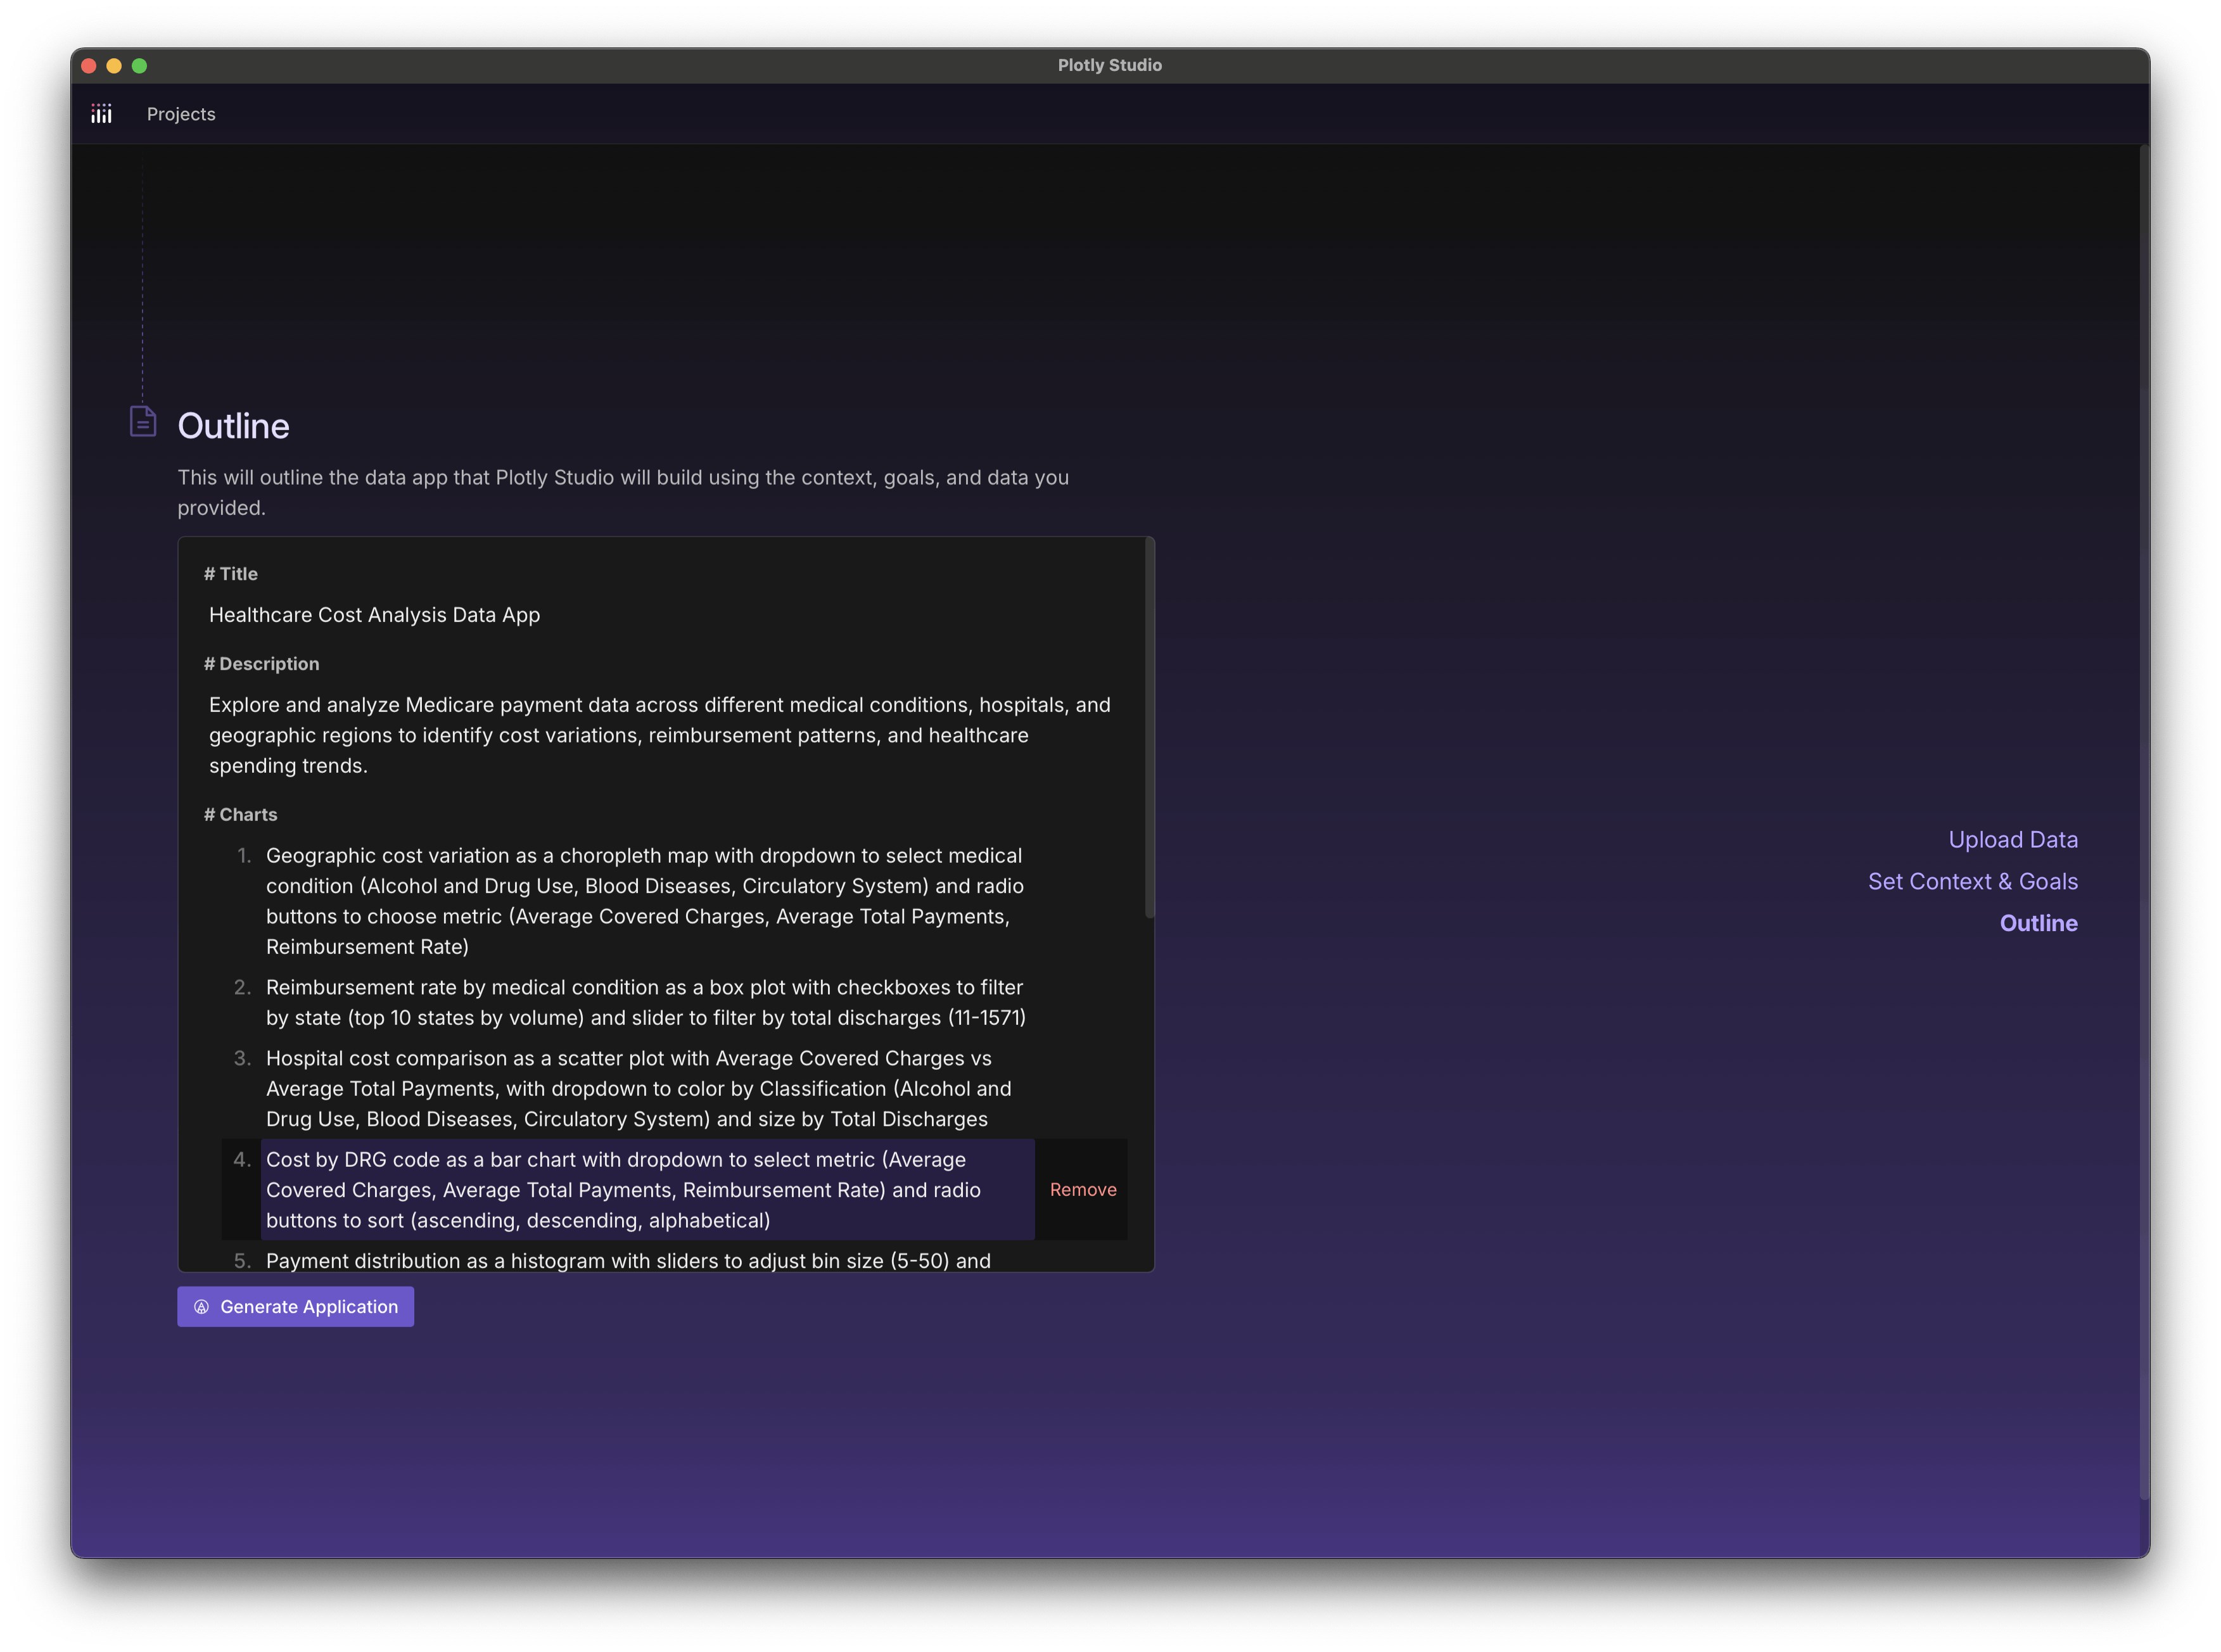
Step 4. Voilà, the outline! This outline is autogenerated by Plotly Studio and completely editable. It contains information about the charts, controls, filters, and theme that it will generate.
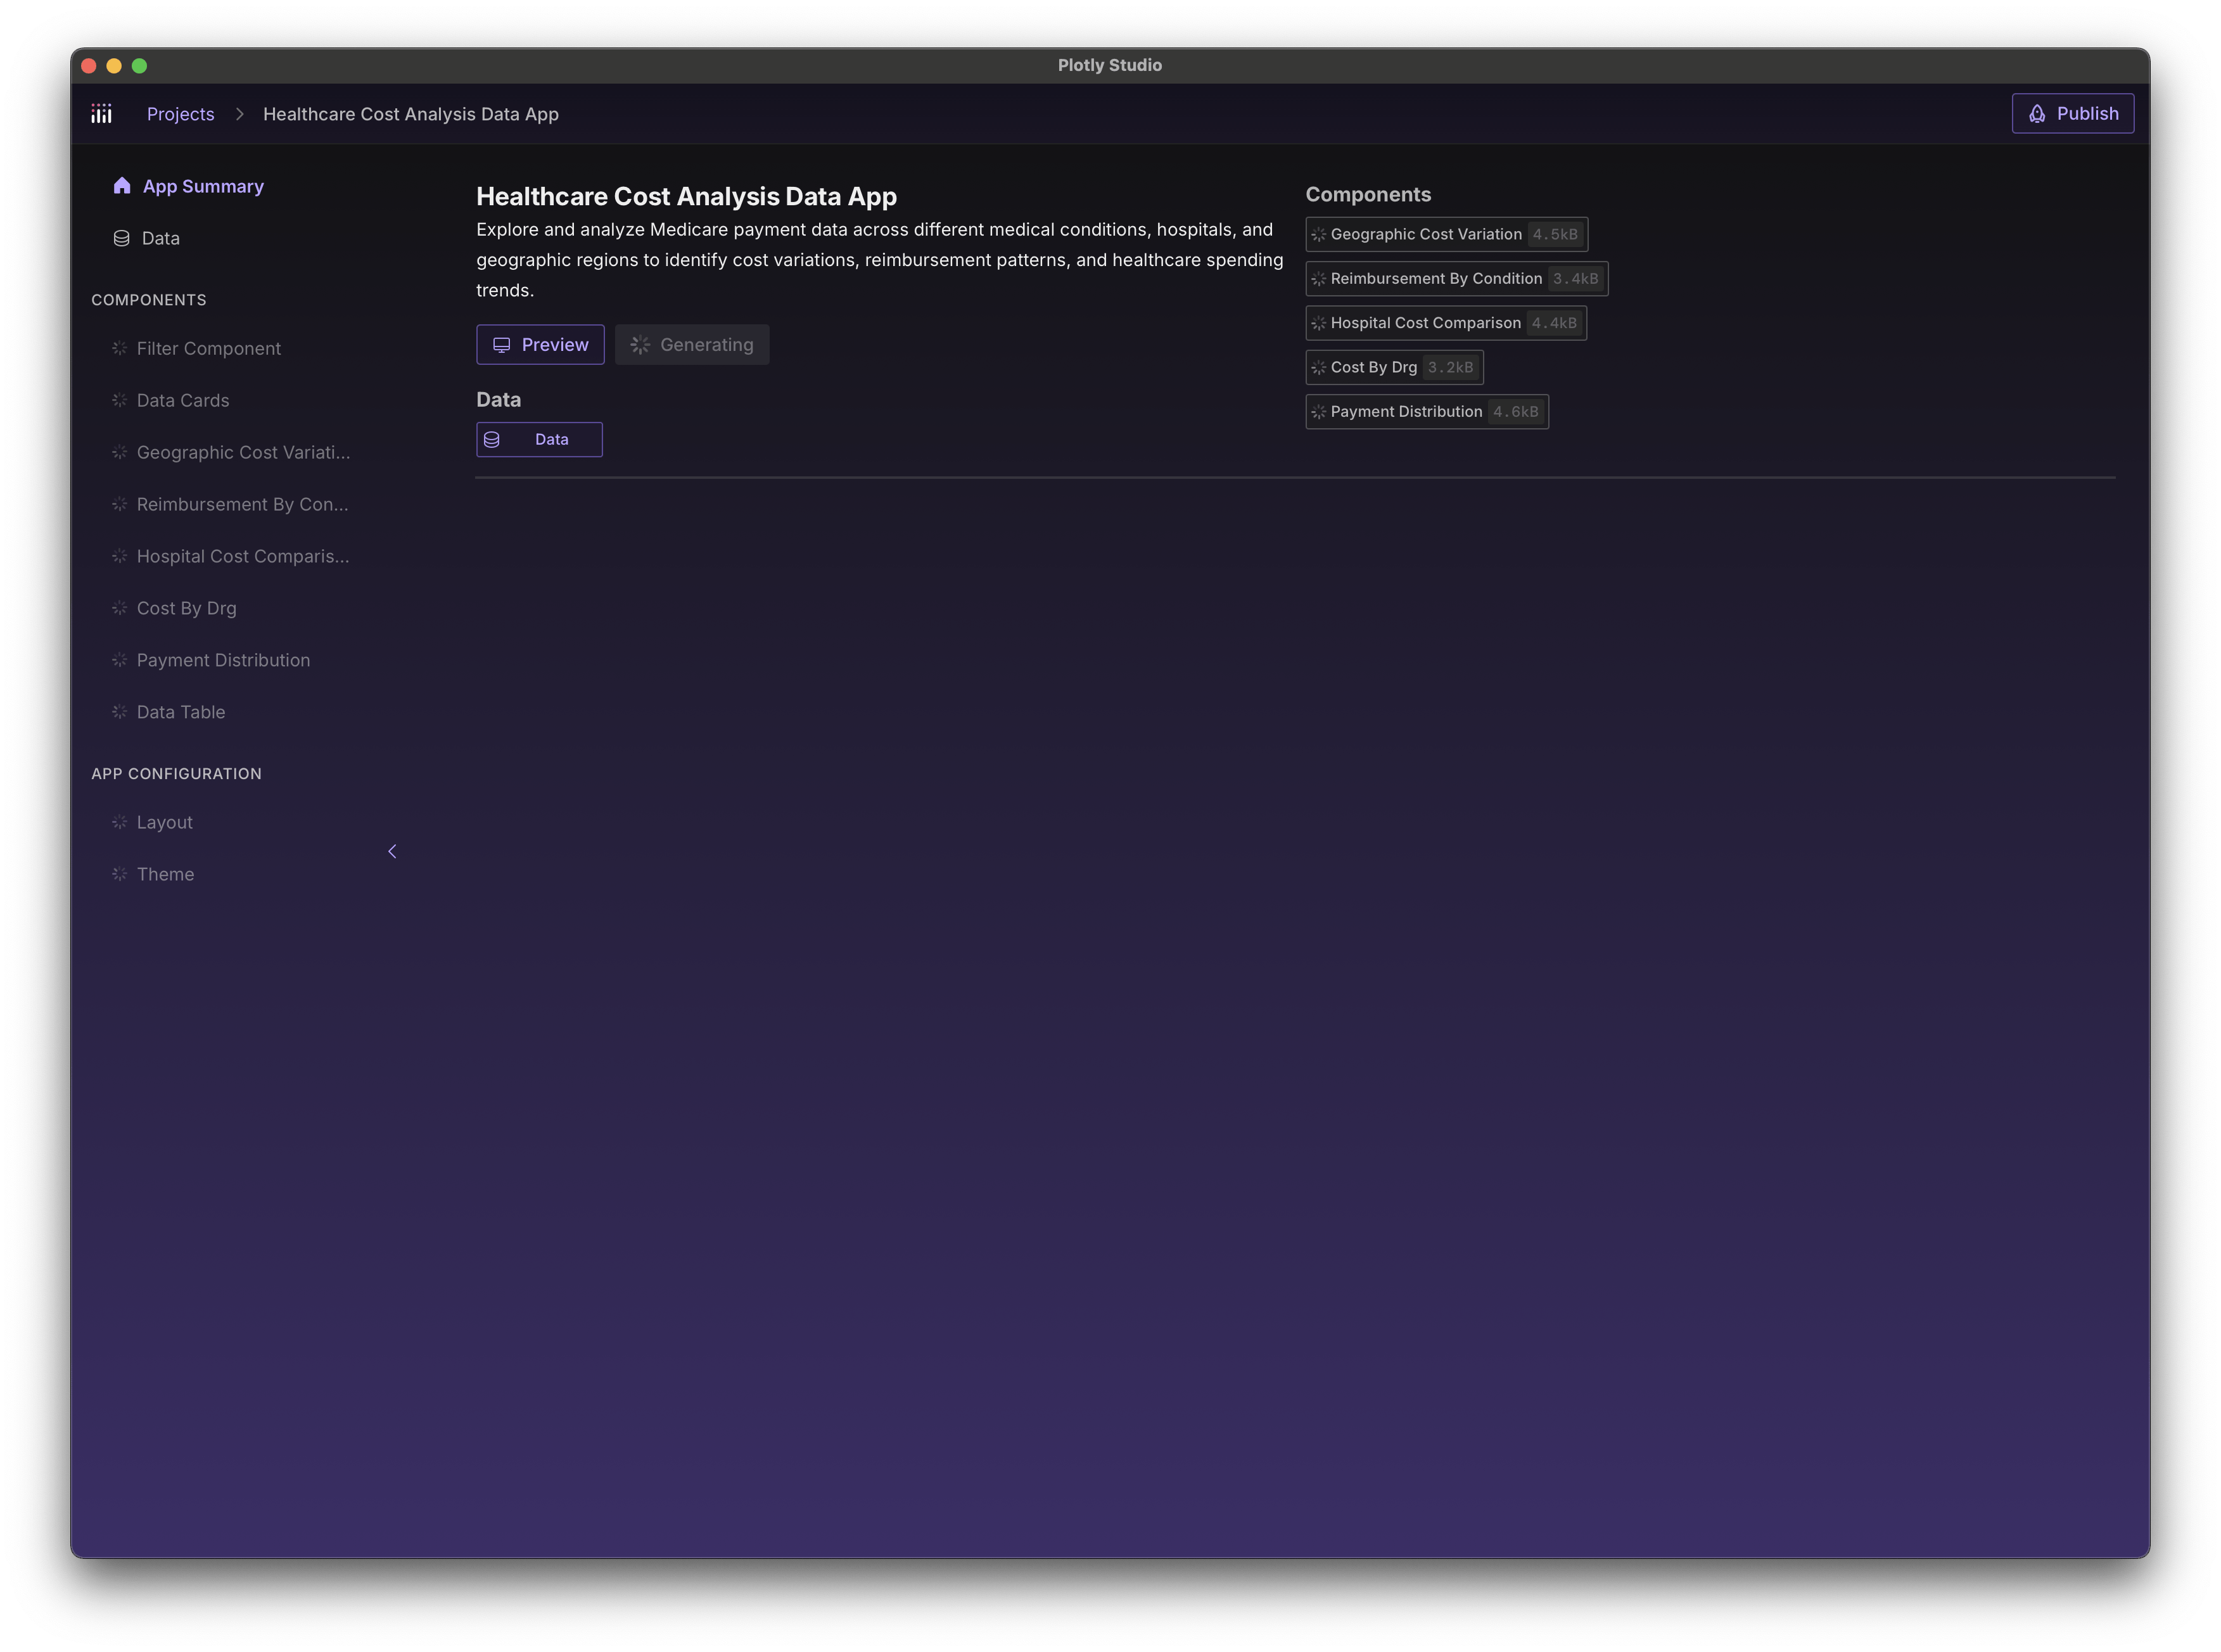
Step 5. Plotly Studio generates the application based off of the outline, context, goals, and dataset. It will generate about 2,000 lines of well structured Python code and natural language specification files.
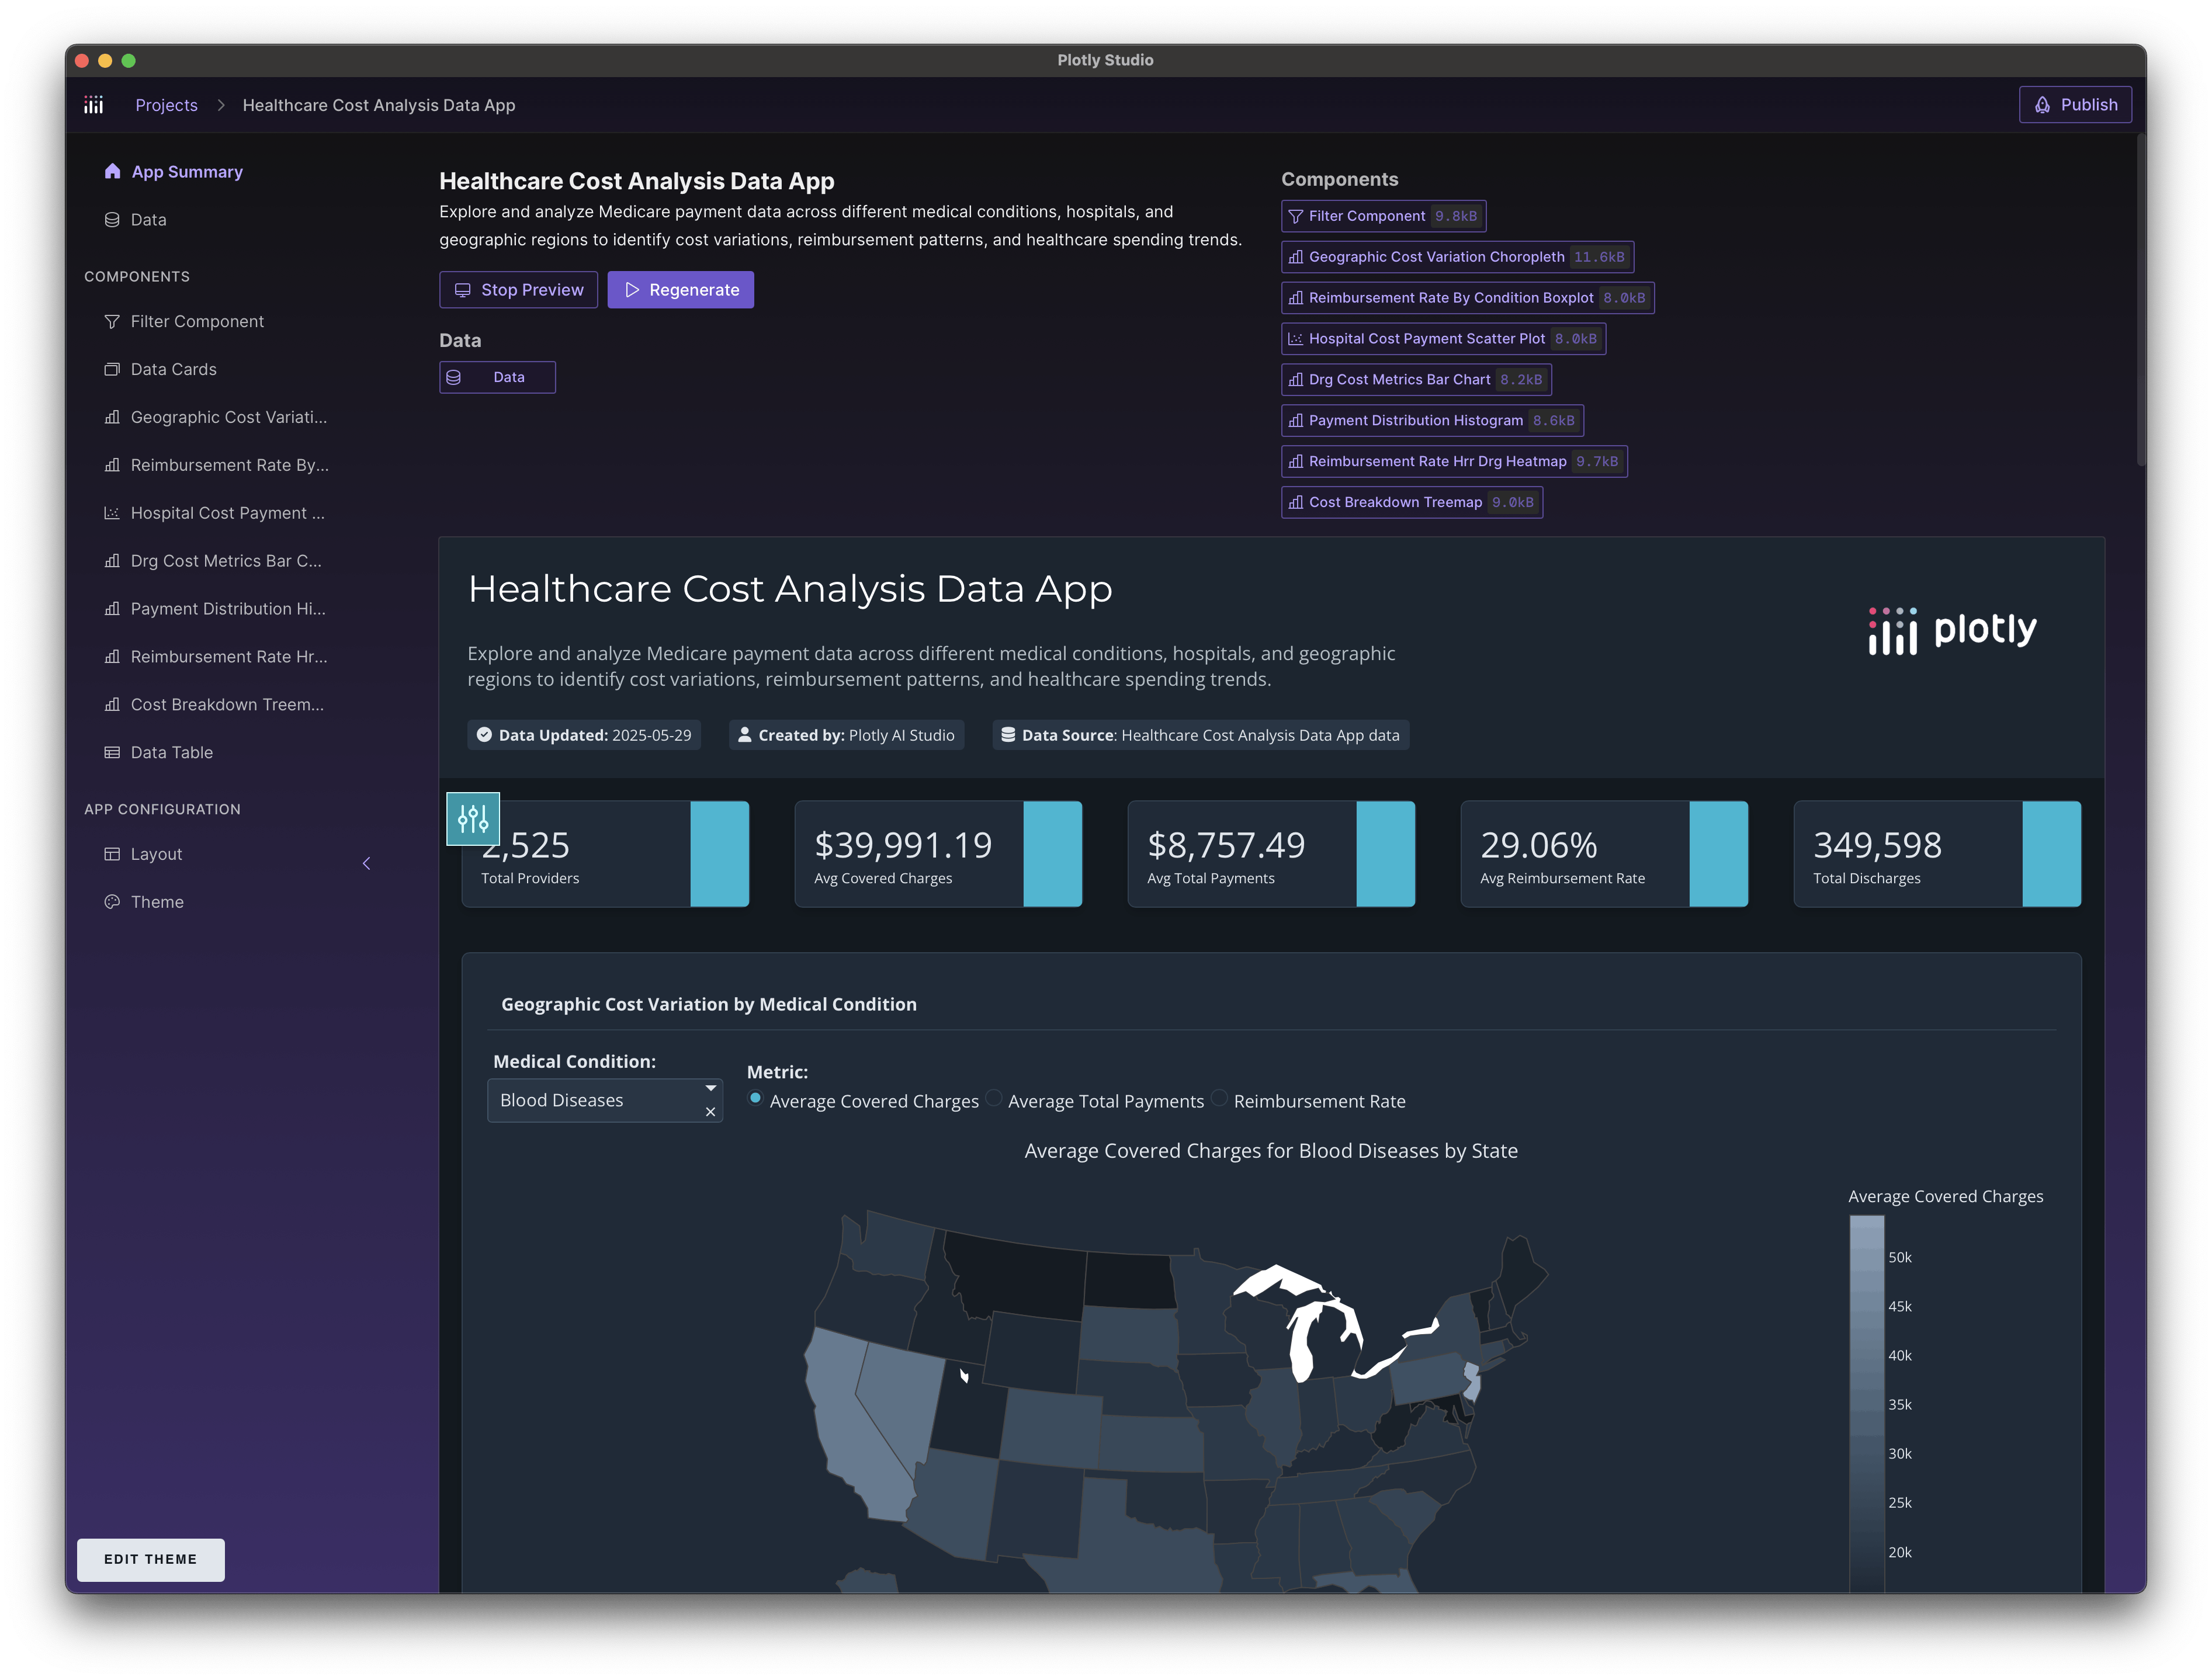
Step 6. First draft complete!
Two minutes! These are apps that would take me multiple days or even weeks to create (and heck, I wrote Dash).
The data apps are beautiful, fast, and backed by code. They incorporate patterns and recommendations that we’ve internalized over the last 10 years, building tools loved by millions and helping our customers across the Fortune 500. Plotly Studio combines this expertise with our expressive and flexible Python visualization and data app libraries, and the world knowledge of LLMs.
The results are remarkable.
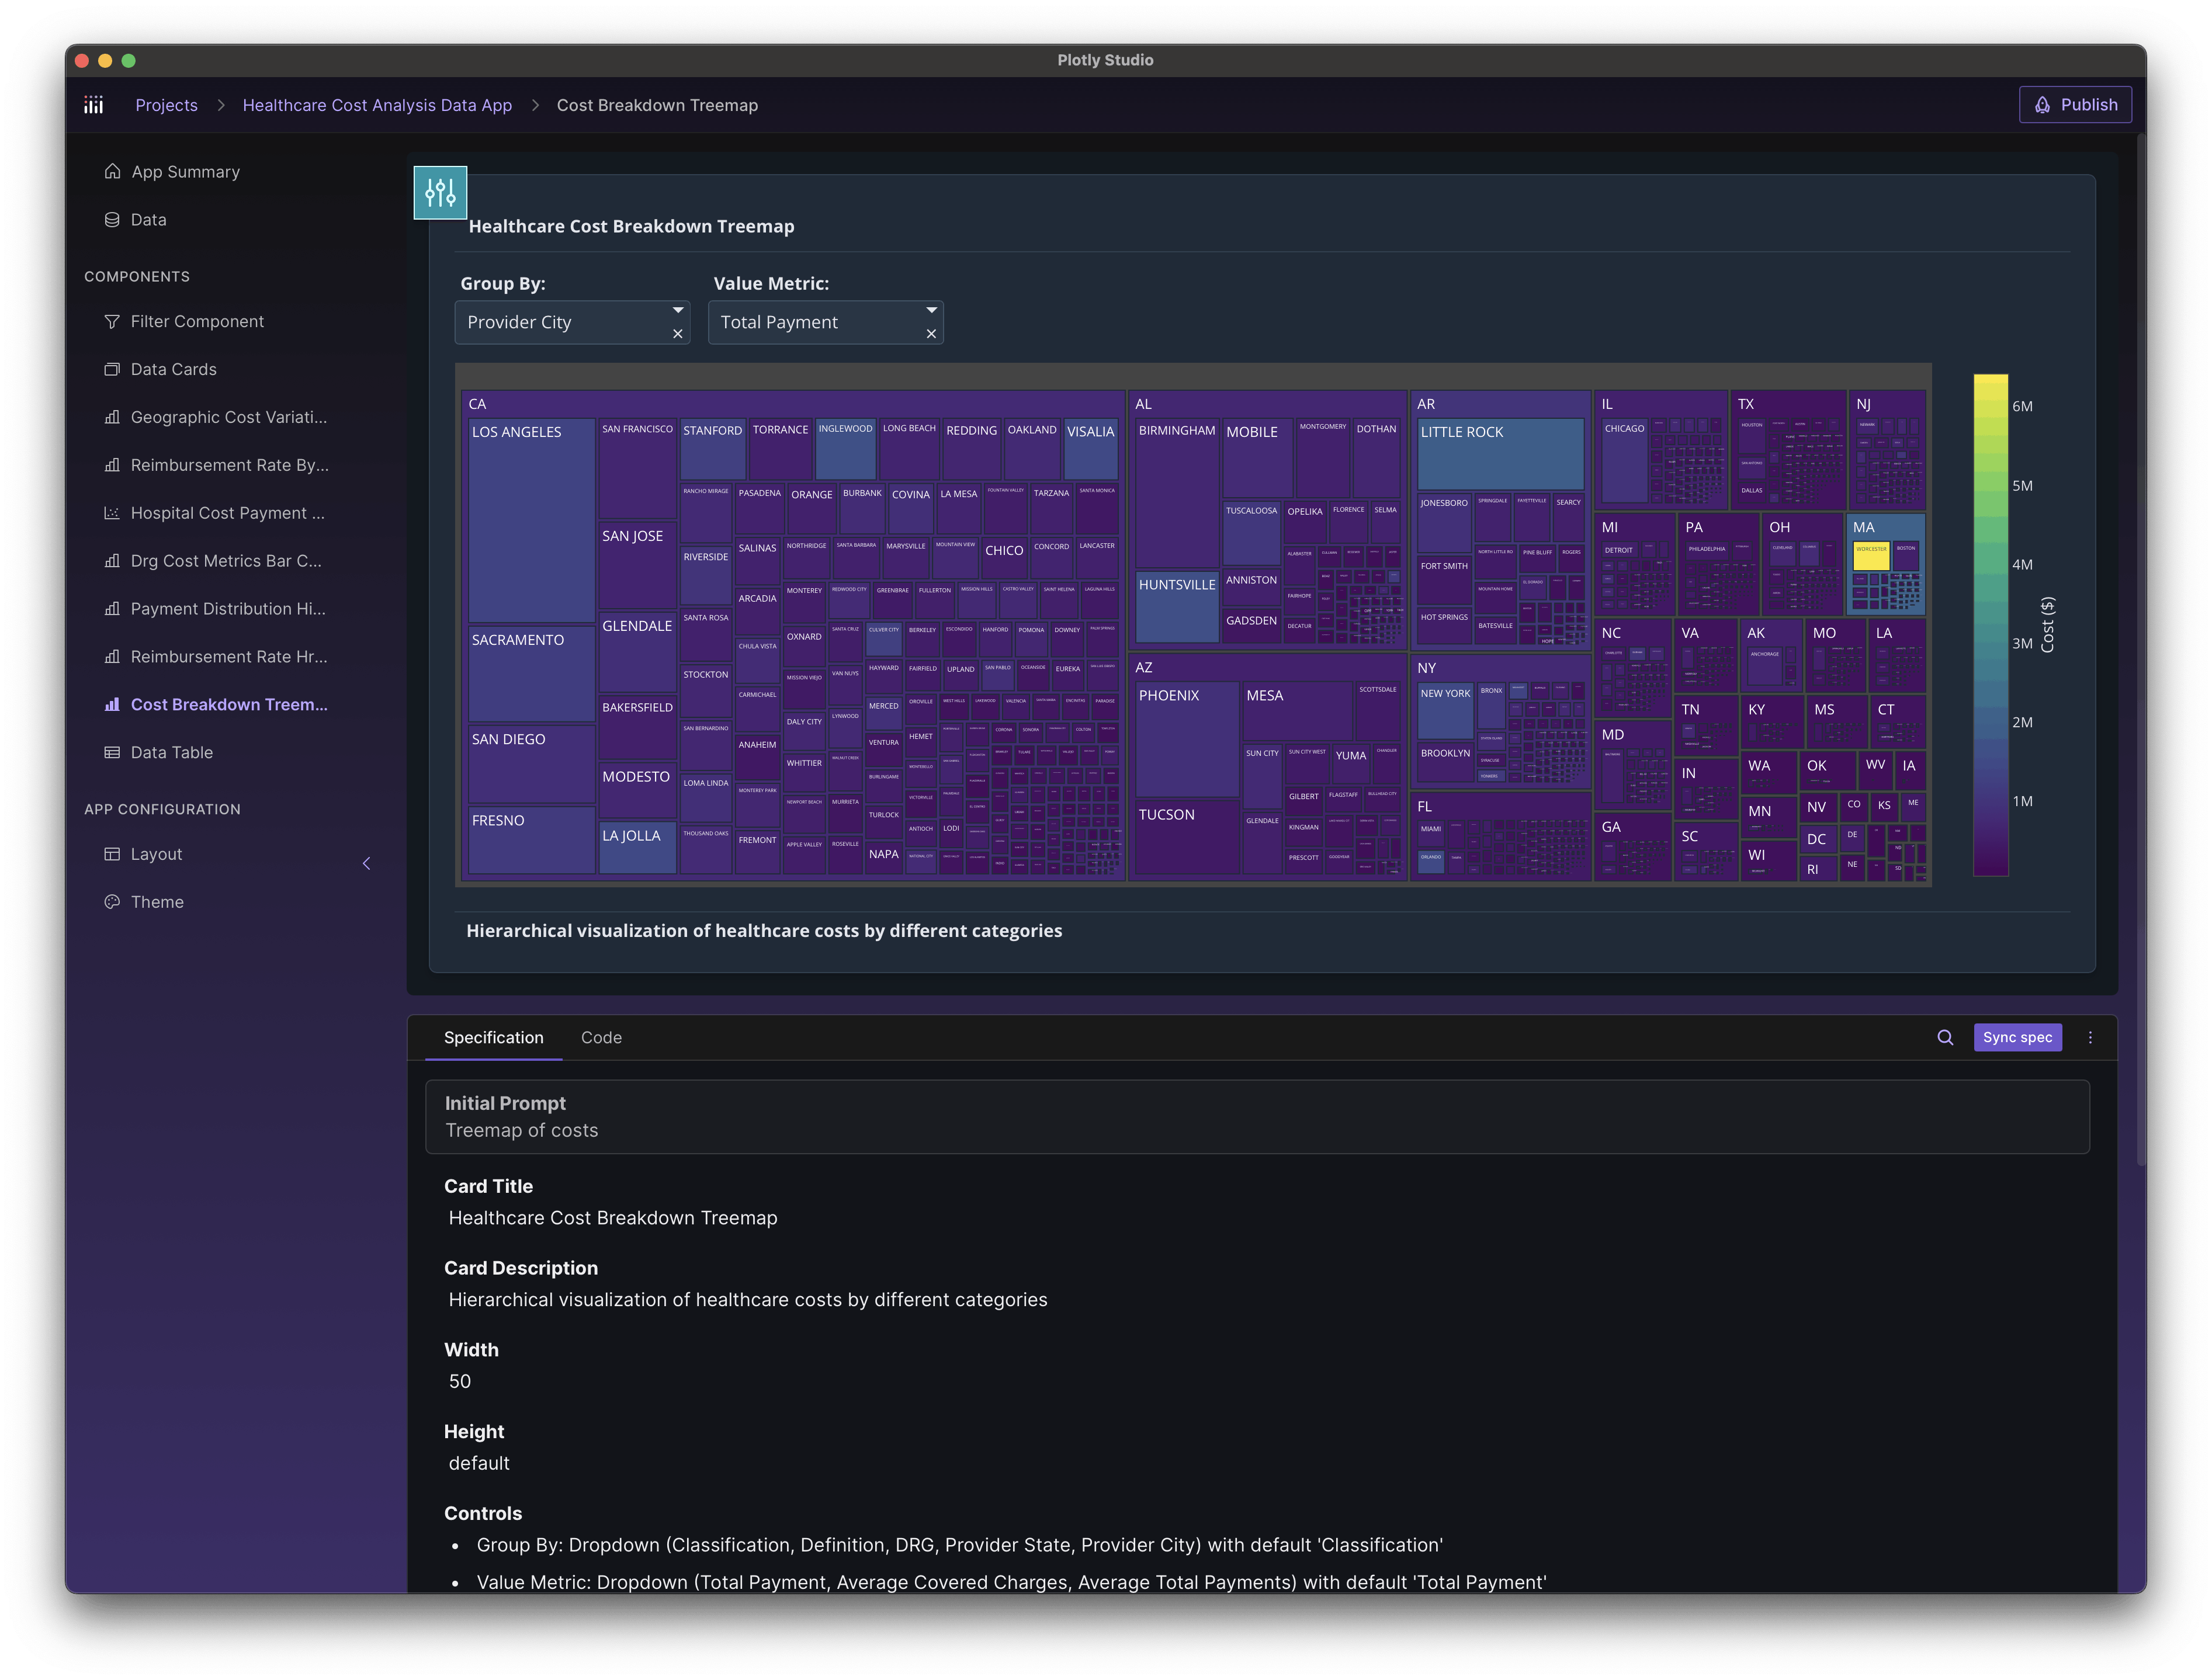
Example of a treemap visualization created in Plotly Studio from a medicare dataset. Each individual chart is editable in code or in the natural language specification file.
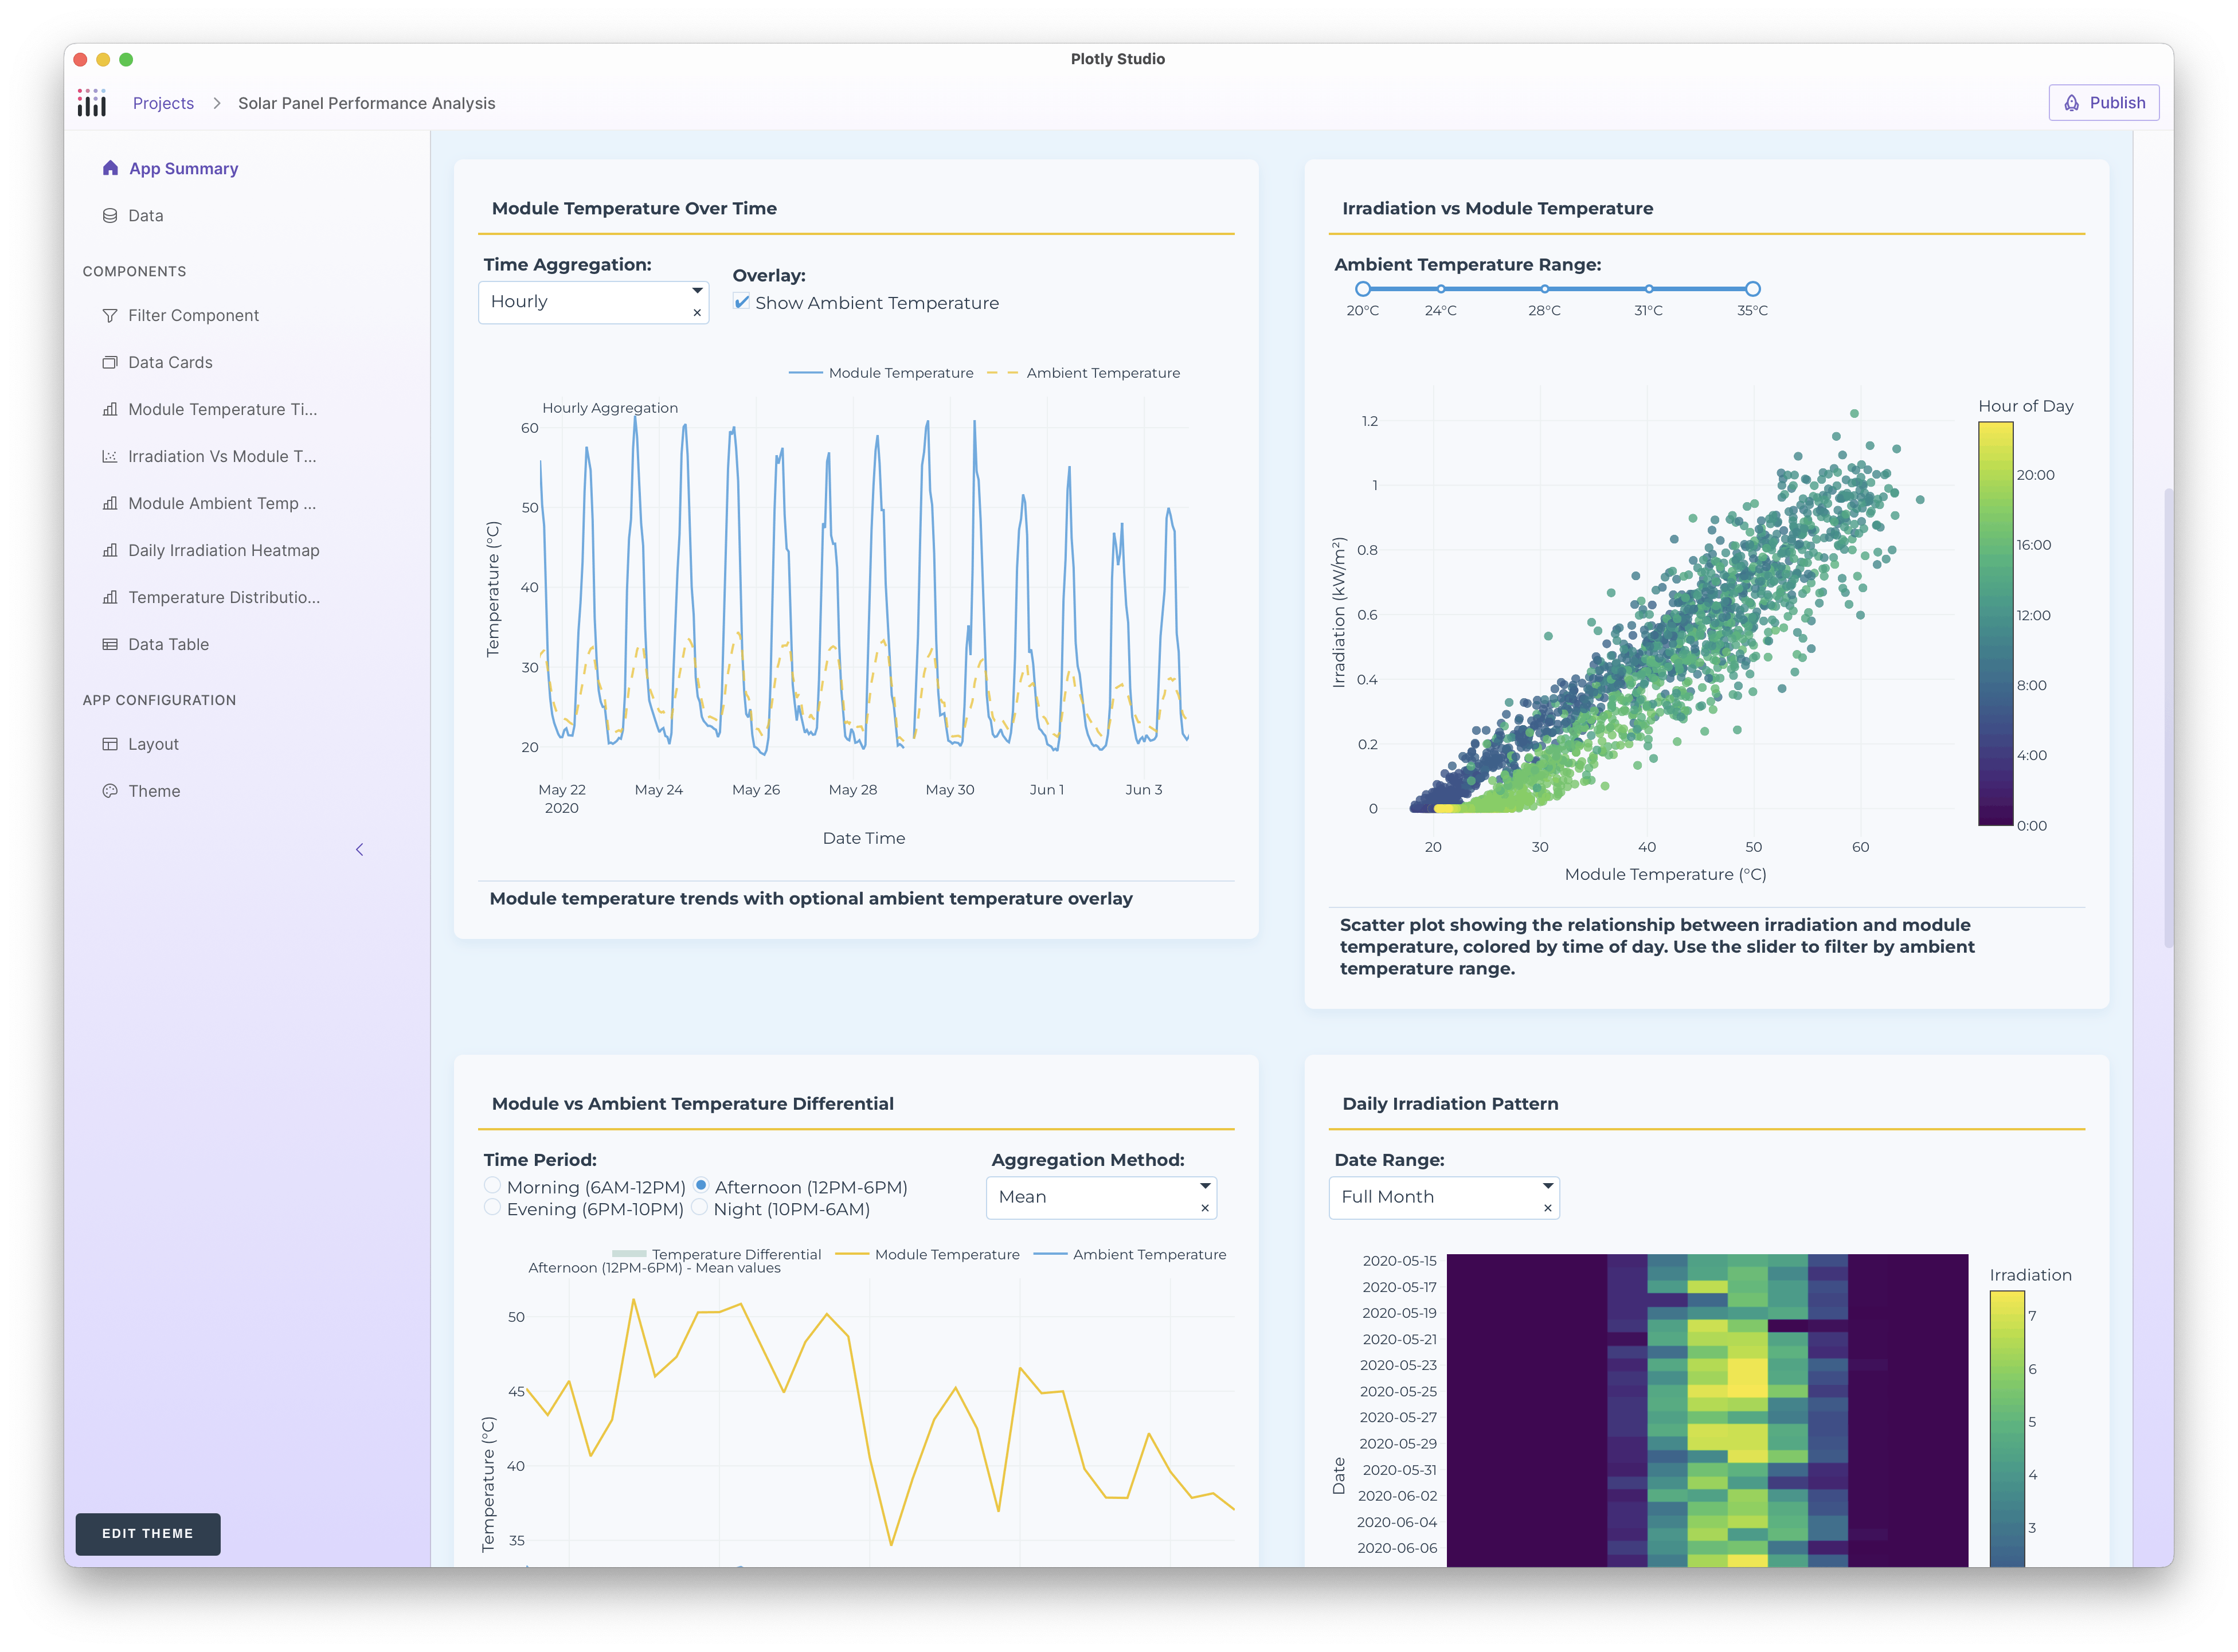
A solar panel performance analysis data app generated without any additional context or steering - just the dataset!
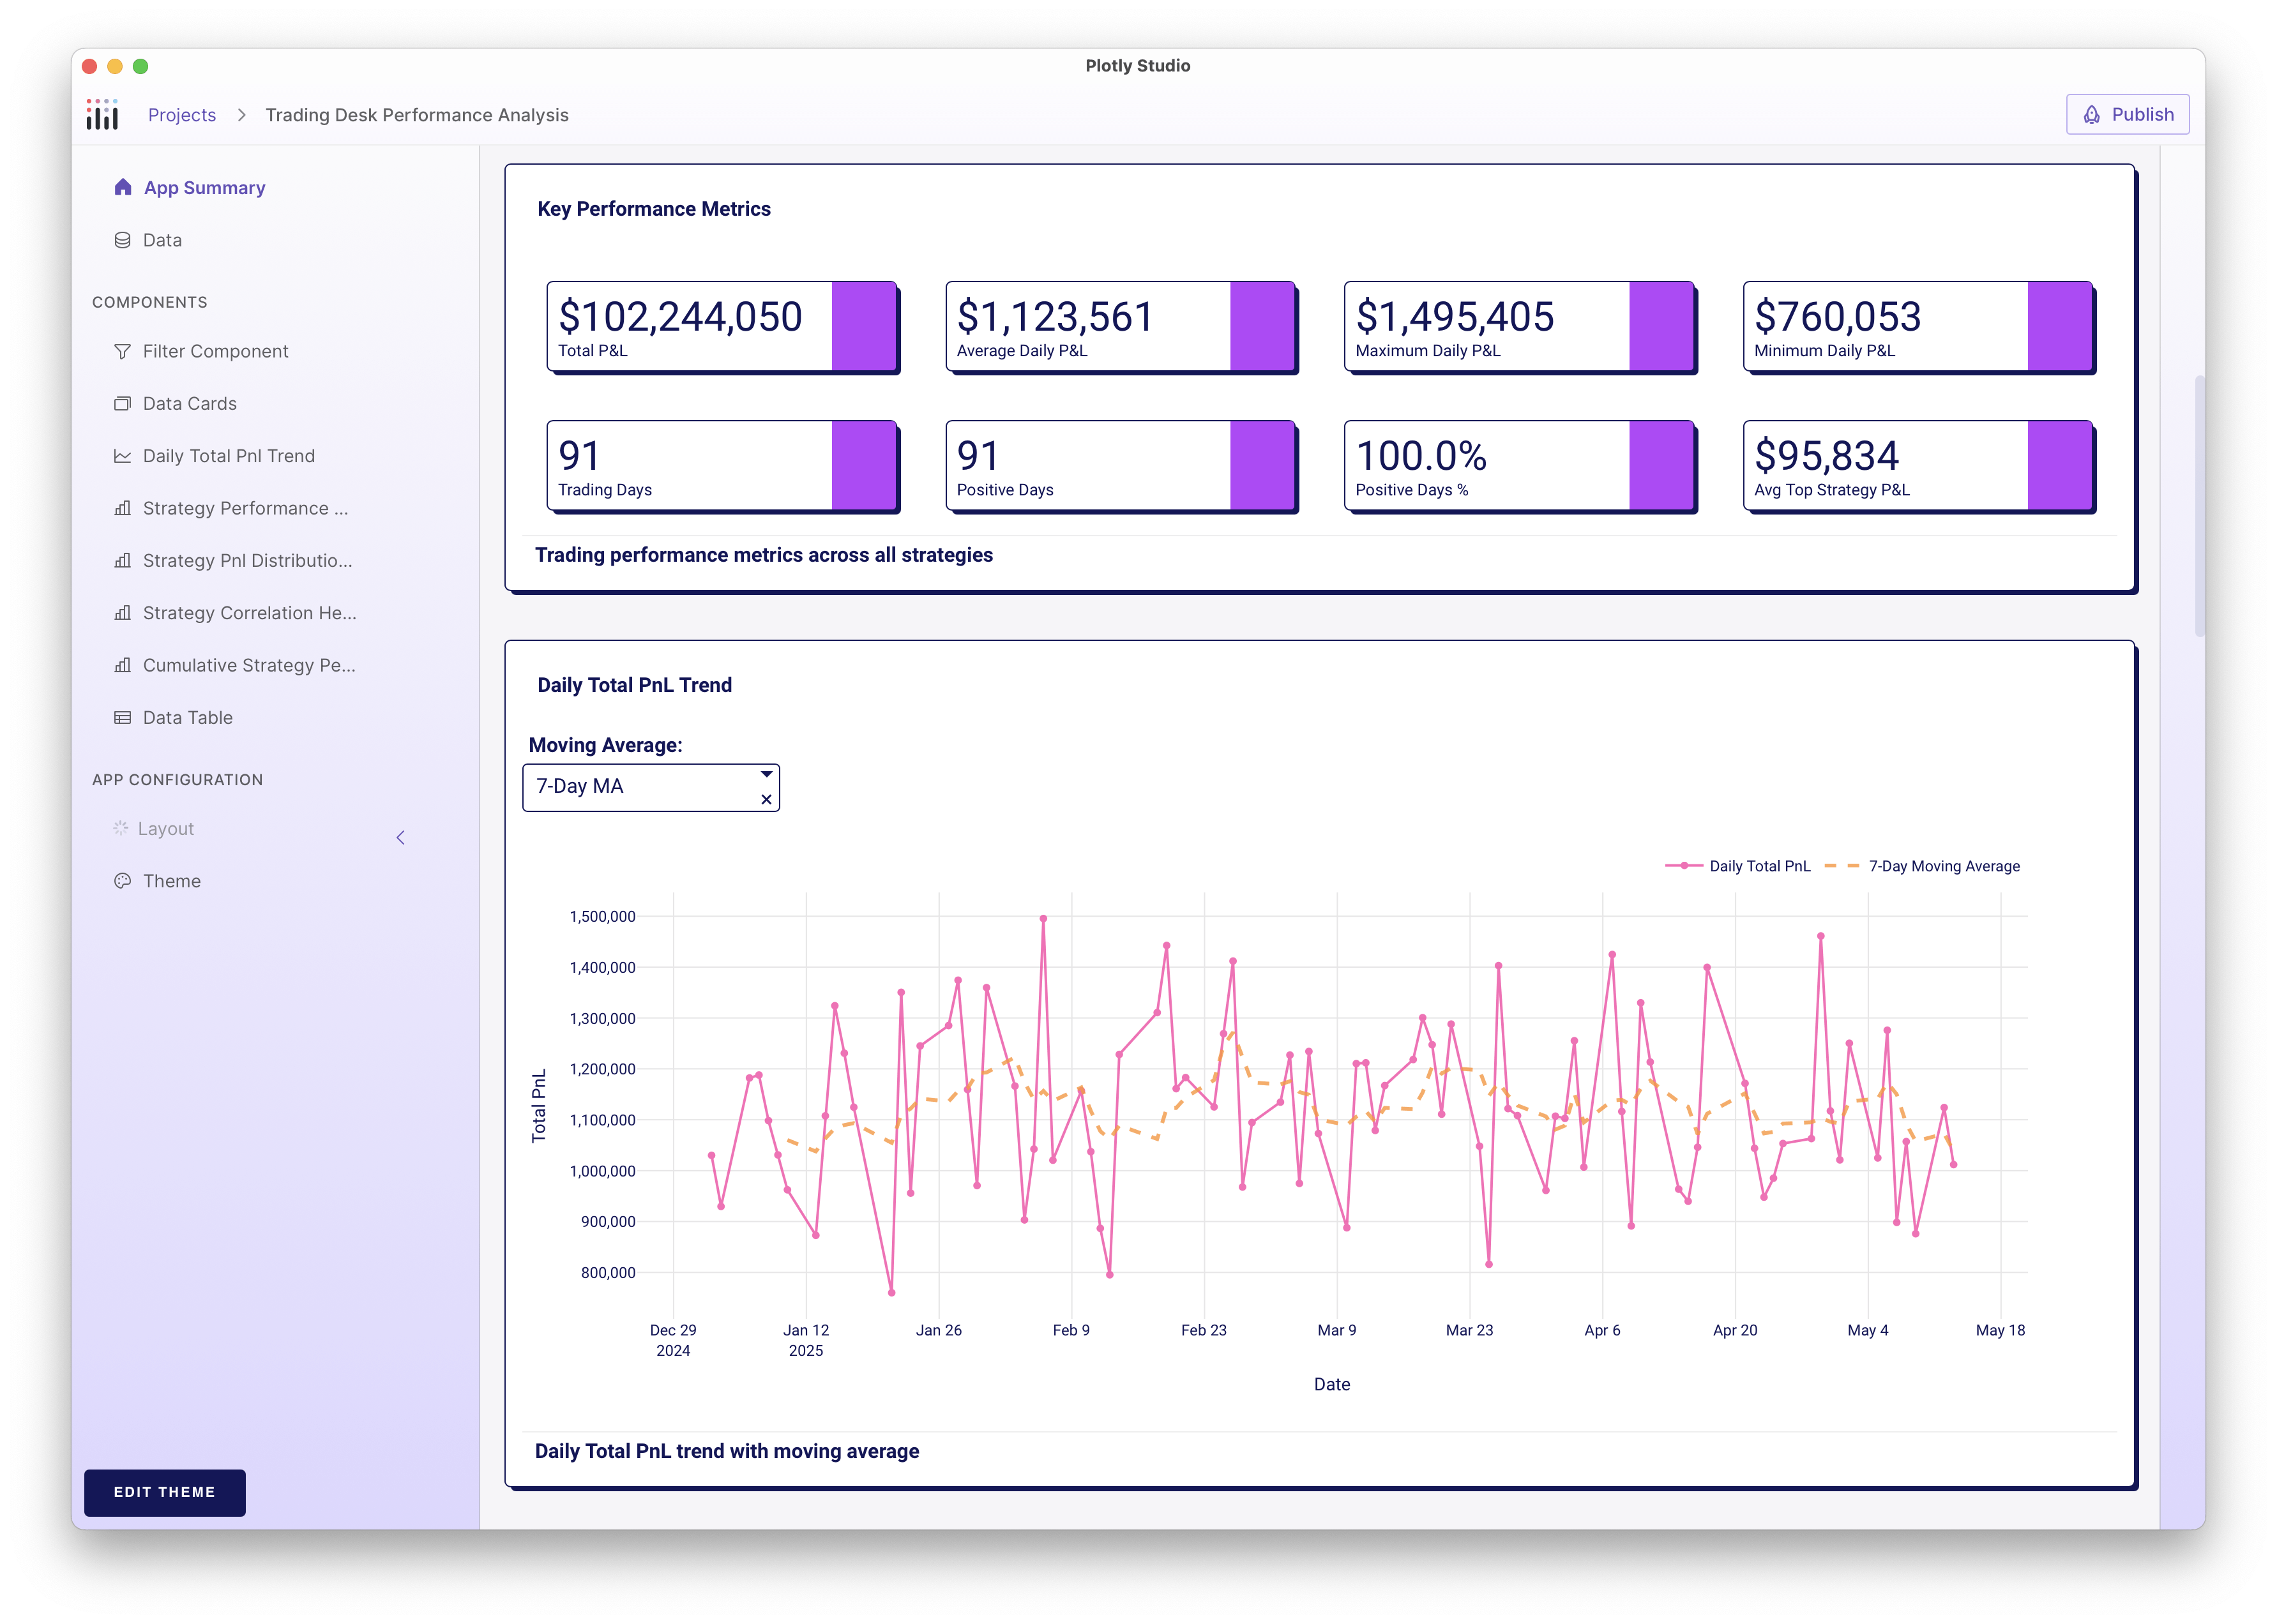
A financial trading desk data app created in Plotly Studio.
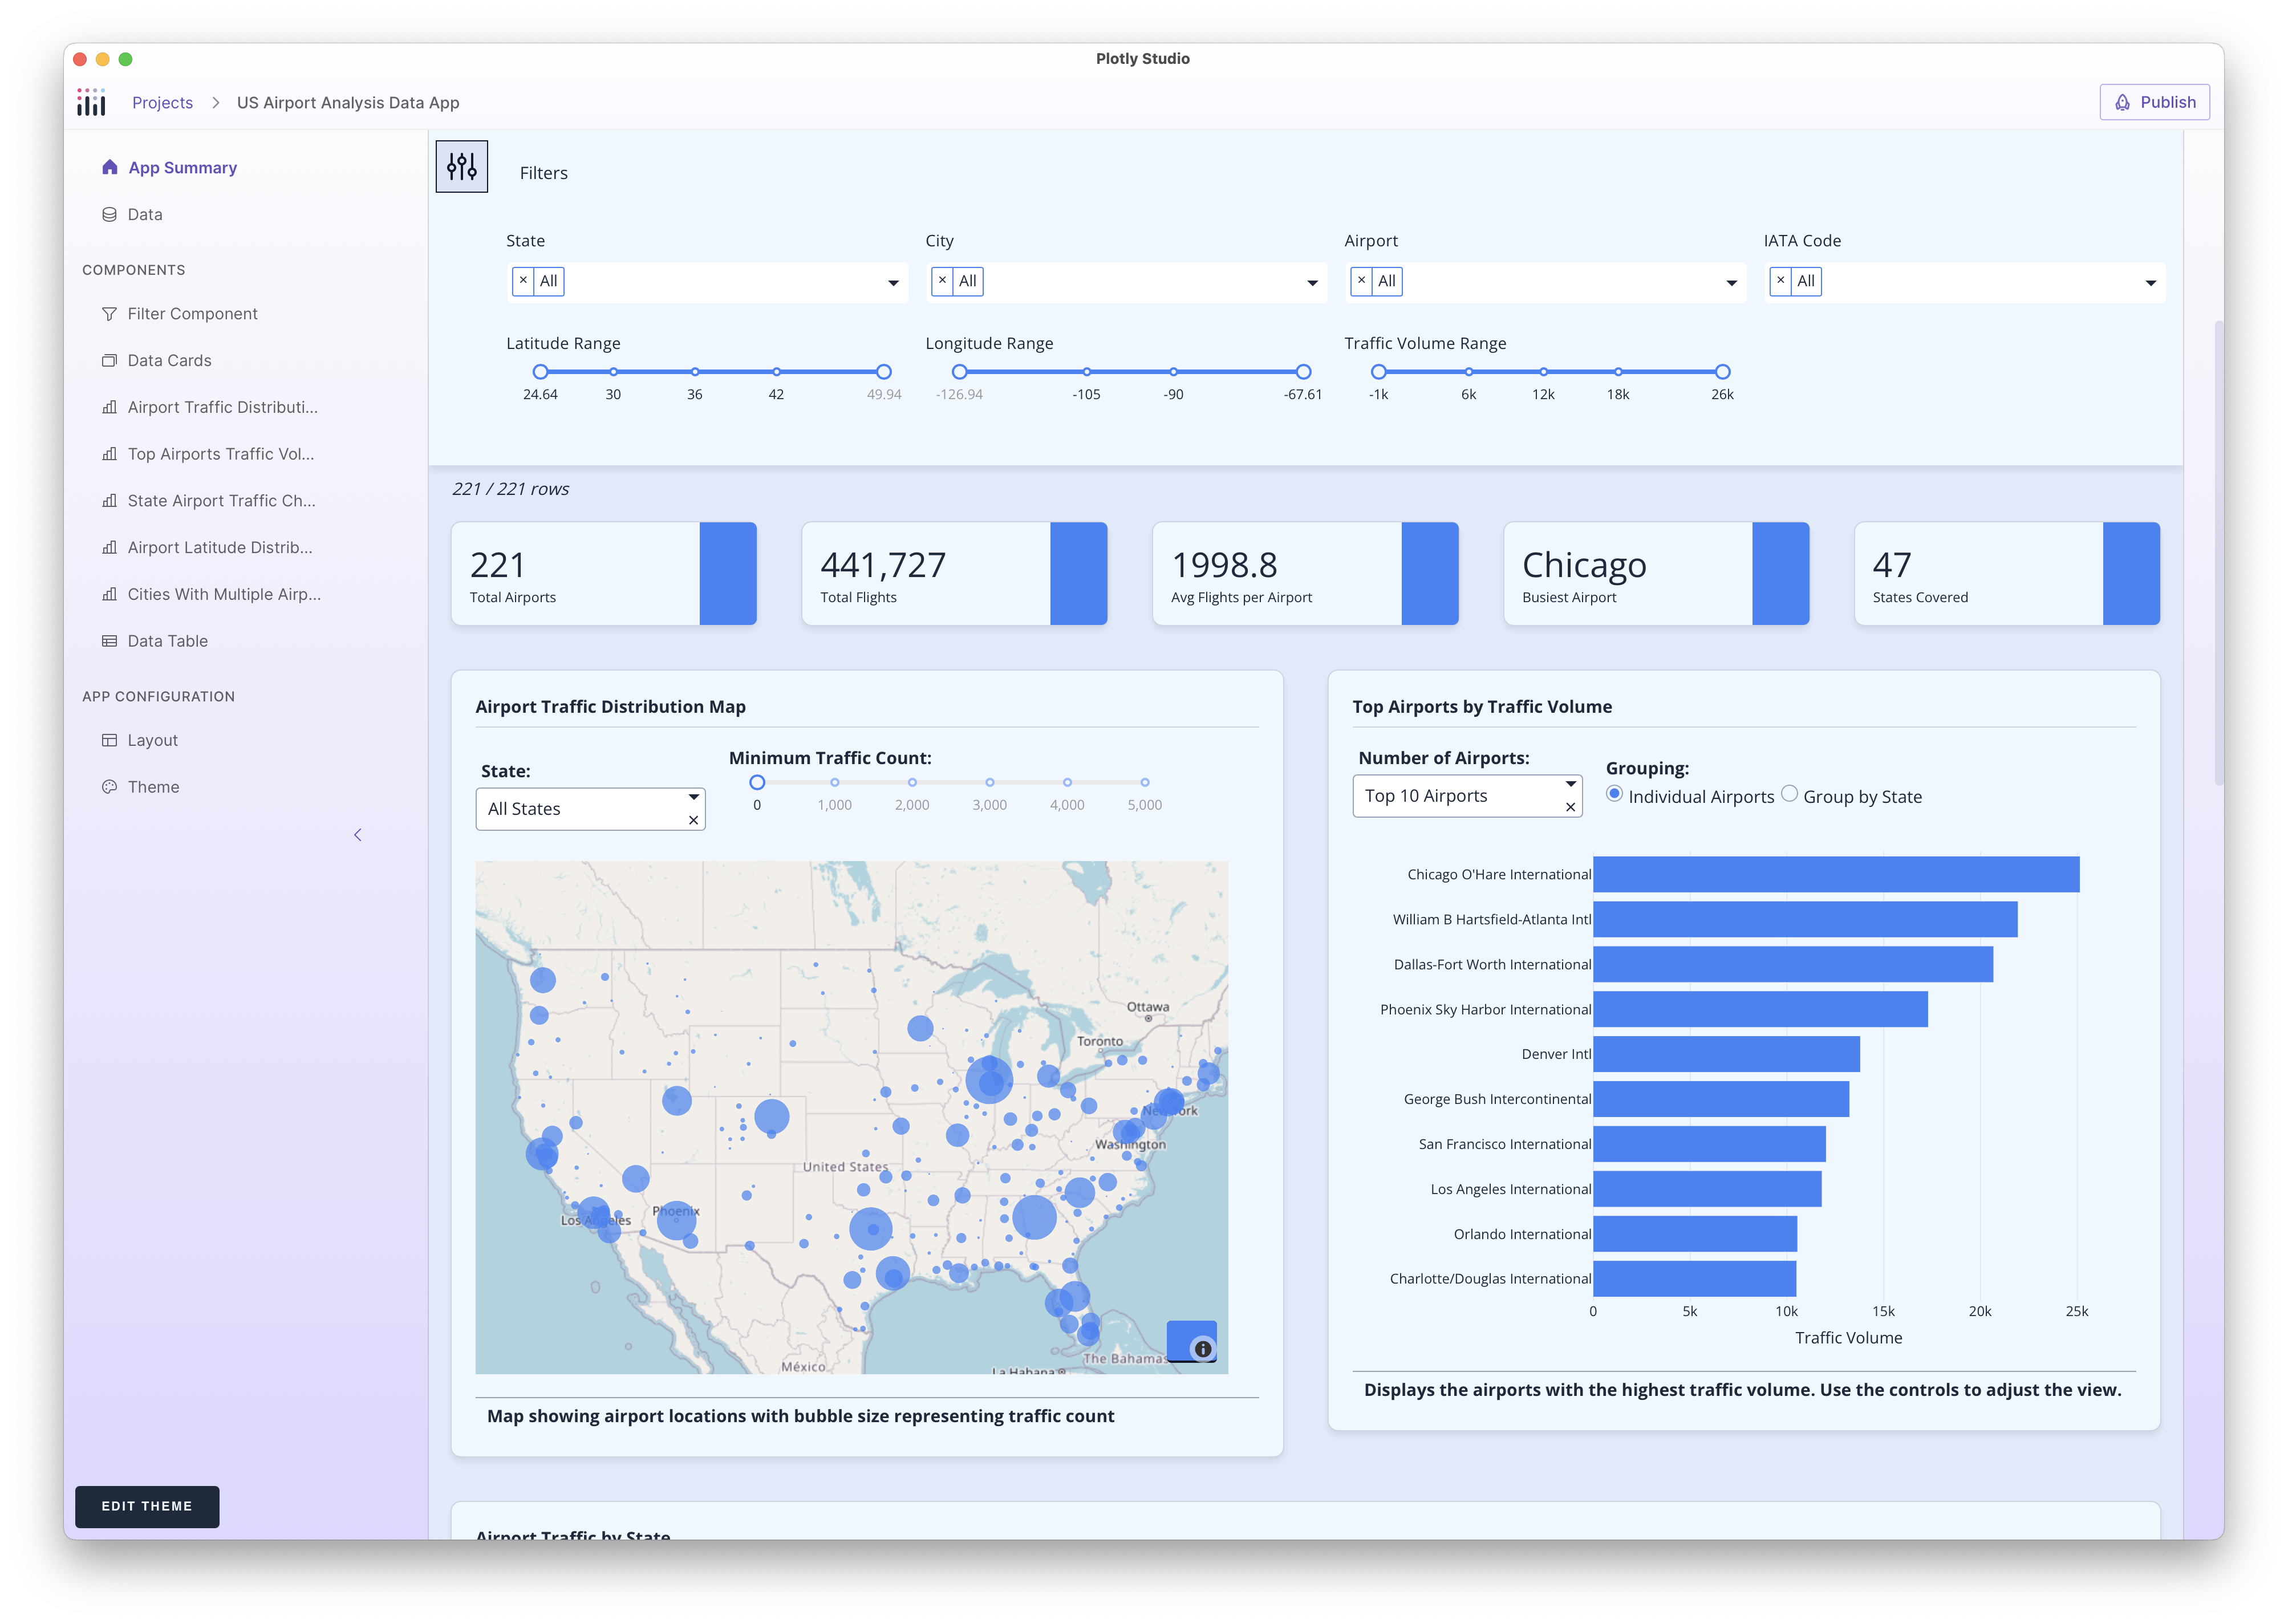
A flight delays app built in Plotly Studio.
Plotly Studio generates domain-specific apps, computes domain-specific formulas, and often surfaces interesting visualizations outside of your proclivities. Every Plotly chart generated is associated with auto-generated controls and callbacks to run additional analytics or modify the visuals.
The Analytical Prowess of Python
The generated apps are backed (and editable) in Python code, which enables an unprecedented level of analytical, scientific, and data processing capabilities unseen before by any traditional BI tool over the last 30 years.
It also opens up a whole new class of sophisticated data visualization capabilities that were previously relegated to power users working in code.

Editing in Code or in Specification Files
Each component within the app — the charts, the data processing module, the global filter panel, the layout, the theme — are accompanied by a code file, a natural language specification file, and the initial prompt that generated the chart.
The specification file resembles a Product Requirements Document; a declarative representation of the component's behavior.
Editing these components can be done by editing the specification file or the code. The specification file resembles a Product Requirements Document. It's a declarative representation of the behavior. Plotly Studio keeps the specification file and the code in sync, so editing one will patch the other and vice versa.
Dog Fooding
We’ve been using the product internally ("eating our own dogfood") and falling in love with the new workflow. We tried it out on some of our “Figure Friday” data viz challenges and found the results ranked among some of our favorites written by scratch.
I rebuilt some of our internal KPI Dash apps in a fraction of the time — hours instead of weeks — and was able to add my colleague’s requests and suggestions simply by copying and pasting their requests into the specification file.
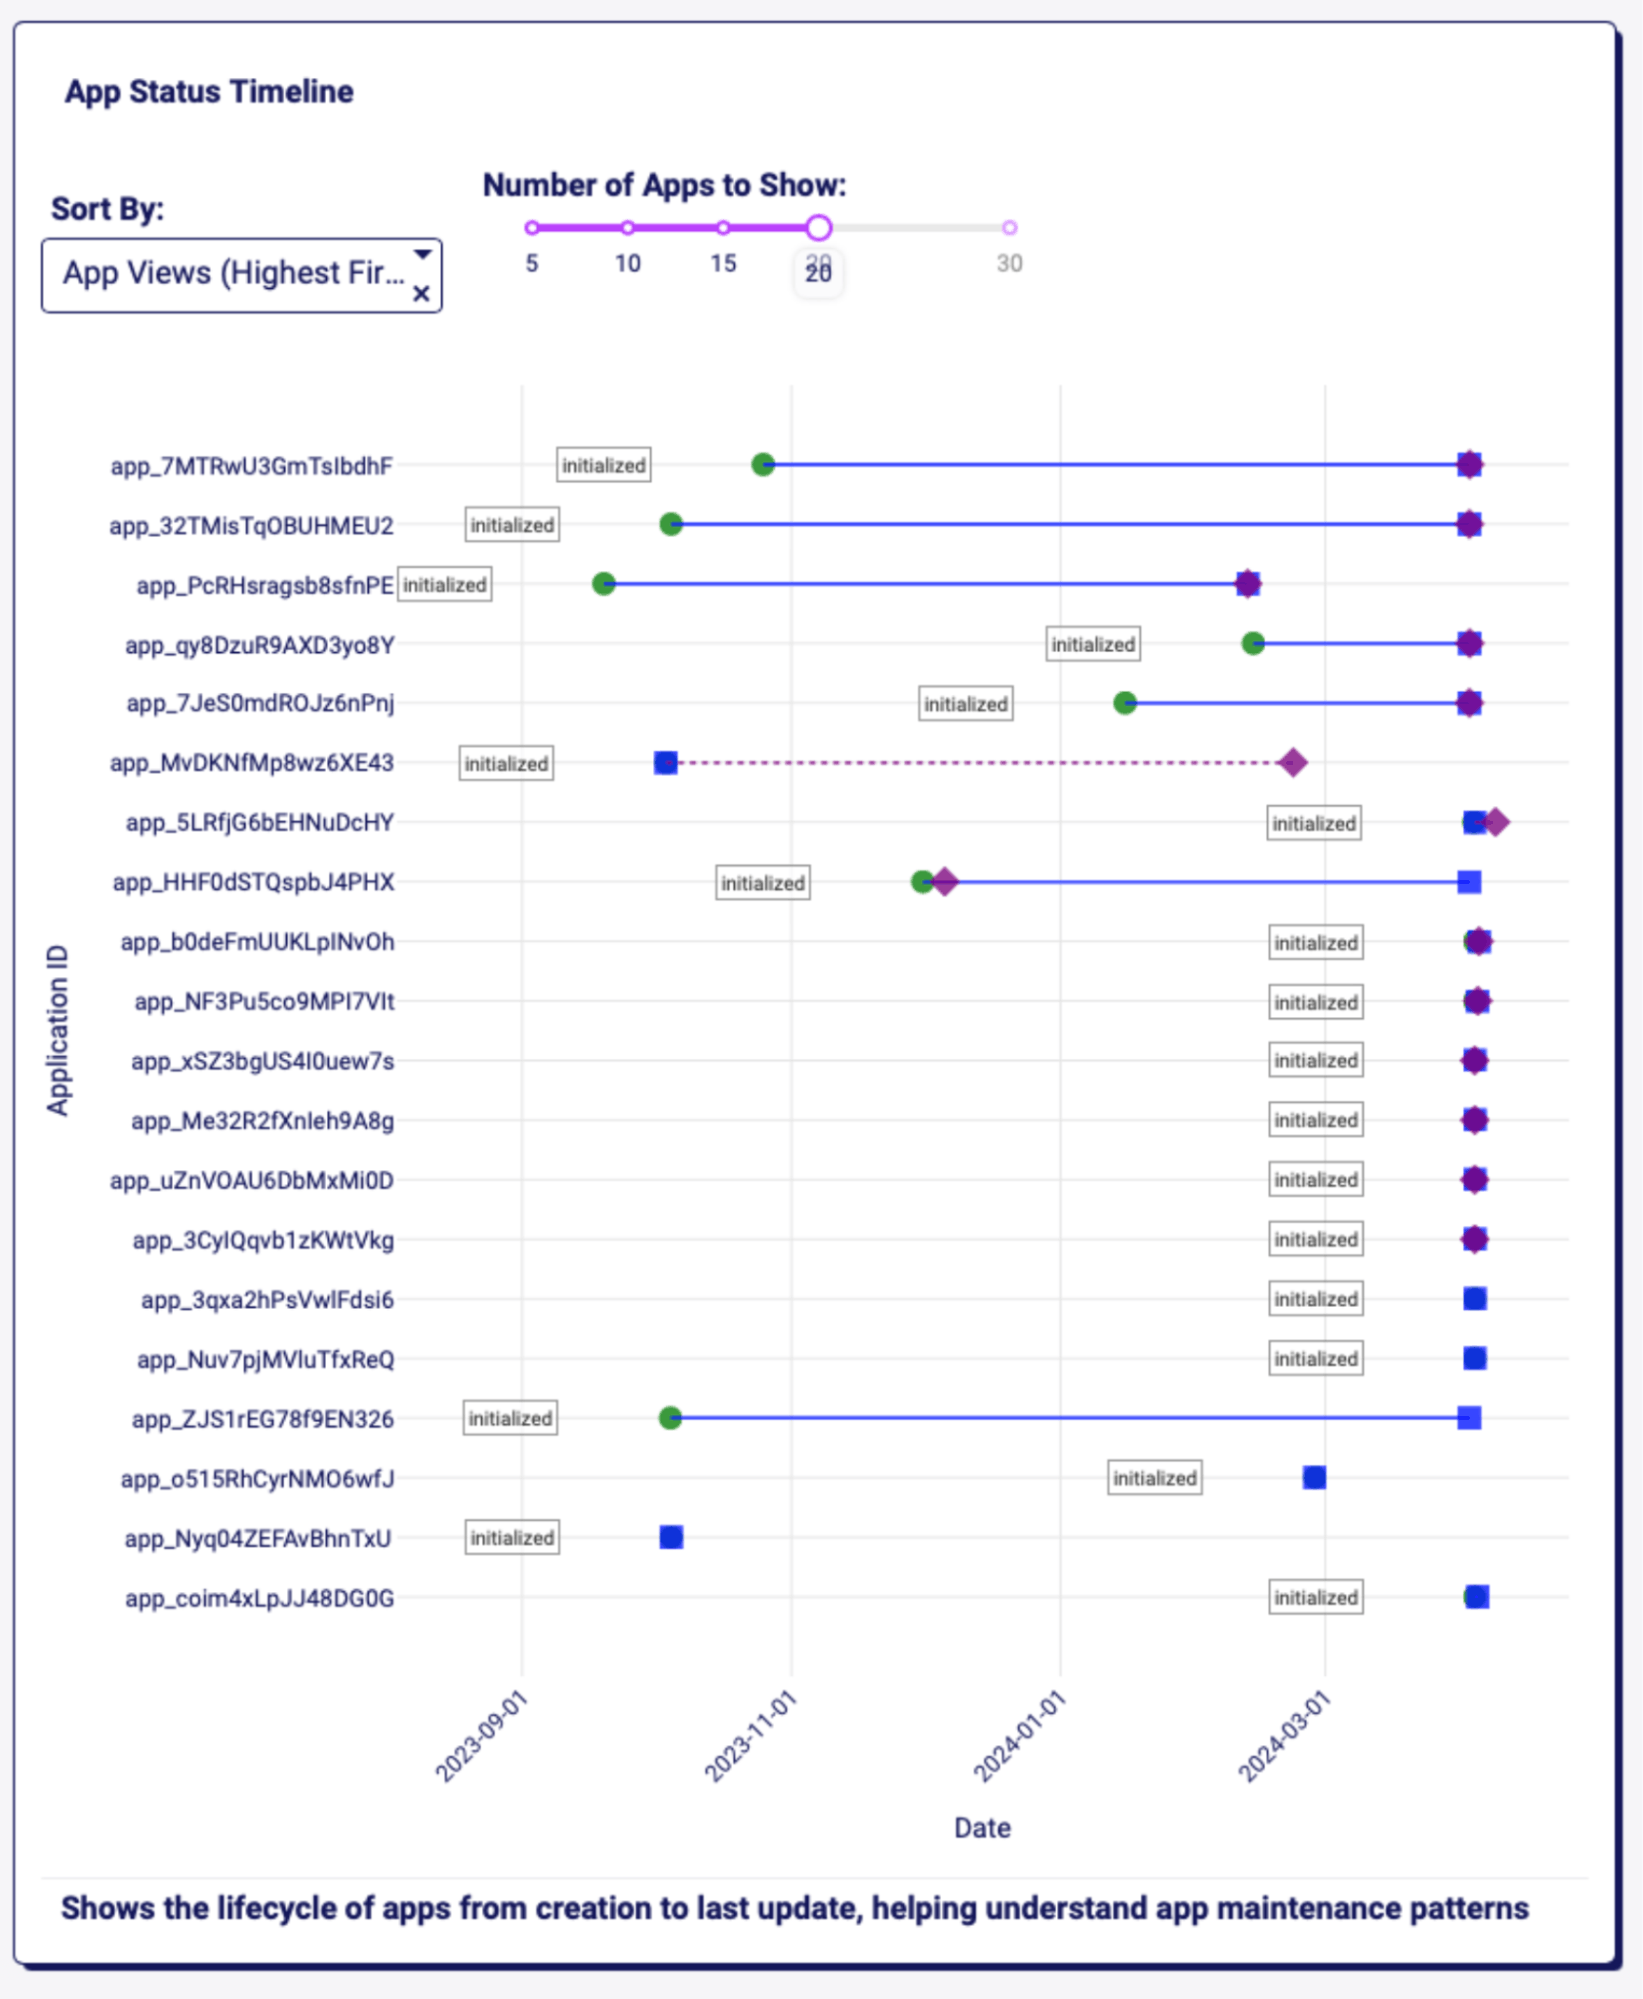
One of my favorite charts generated automatically by Plotly Studio — a sophisticated timeline analysis chart analyzing the lifecycle of some of our internal applications. It's a great example of an app that wasn't really in "my mind's eye" until I saw it.
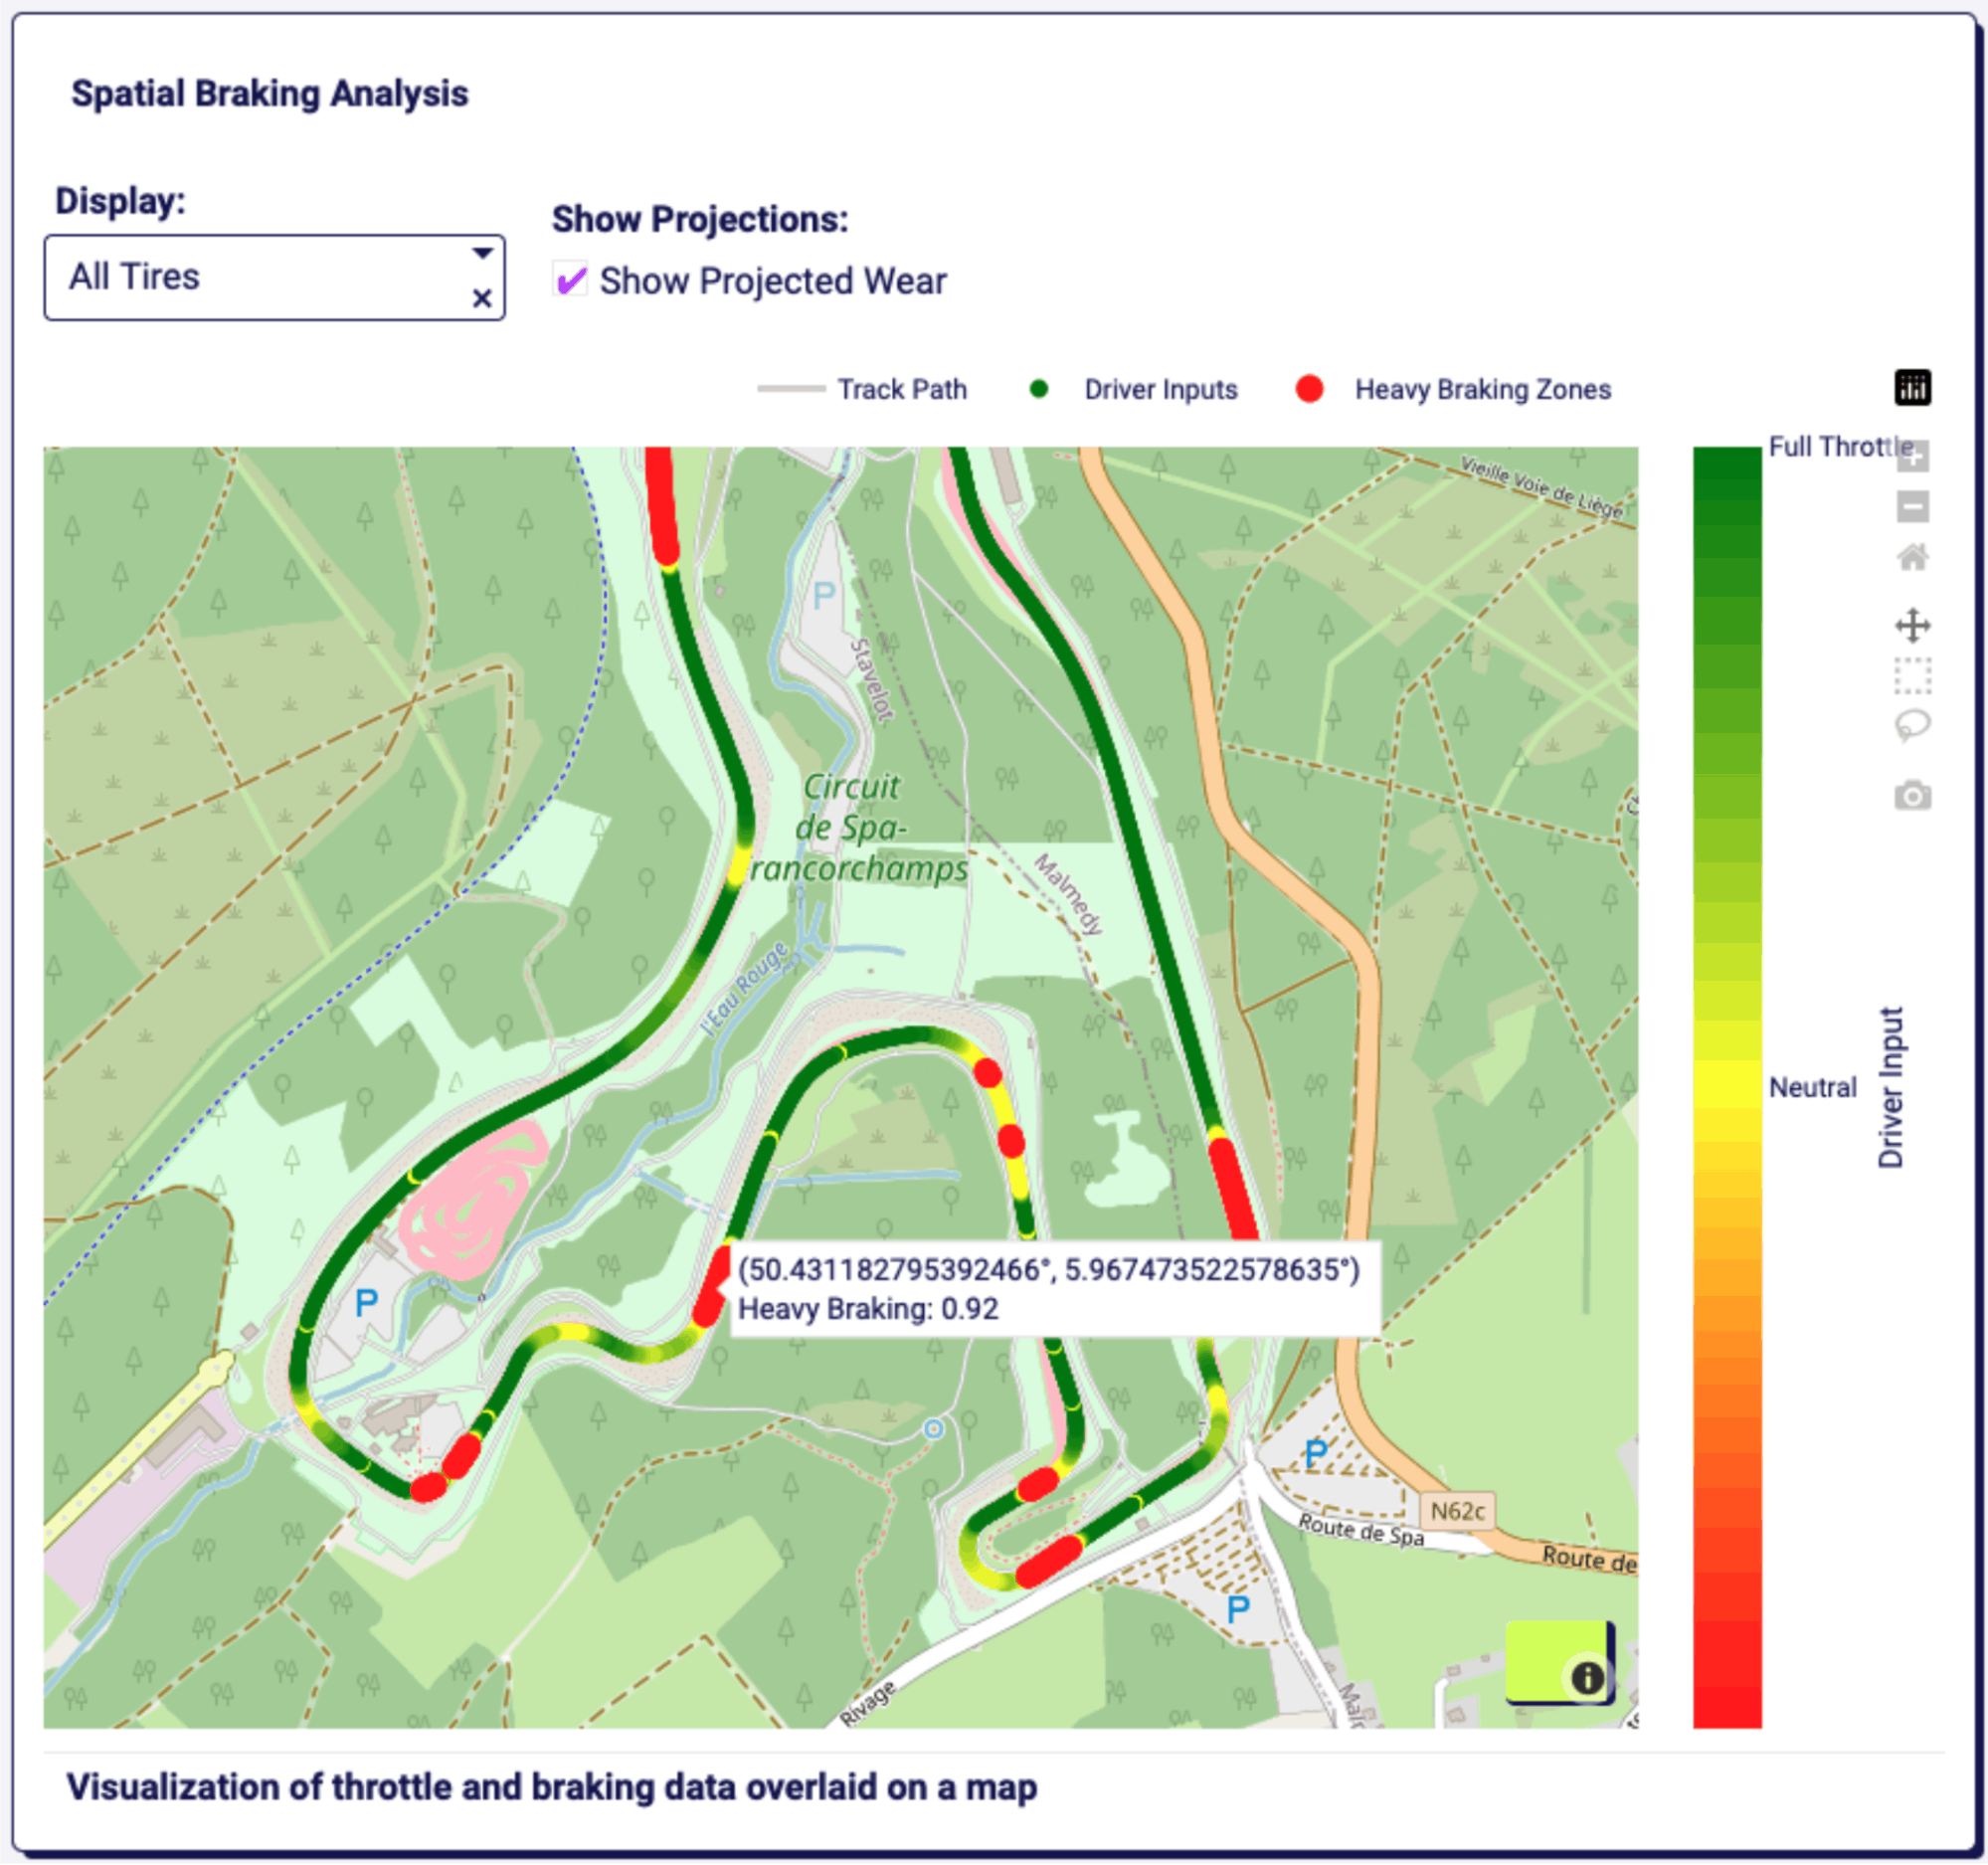
One of our product managers does simulated vehicle testing as a hobby and each run will generate datasets with hundreds of columns of data. We had a ton of fun exploring this race track data during our development. Plotly Studio's "world knowledge" via the underlying LLMs has no problem surfacing relevant charts across a wide variety of disciplines.
Dash For All
So the obvious use case for Plotly Studio is that it makes it easier and faster to build Dash apps.
But as we talked to our beta users, almost everyone one of them talked about being the technical bottleneck for their team; "I can do anything, but I can't do everything."
There are 1 billion knowledge workers out there. Plotly Studio opens it all up.
The magic of Plotly Studio is that there is virtually zero learning curve to create something amazing. You don’t need to prompt hack or fuss around in a terminal or even install Python to get started; all you need is two minutes and a dataset.
“How do we trust the results?”
A lot of data issues will be ambiguous to the machine — multiple columns with similar names (think "revenue_2" vs "revenue_new") and multiple different ways to compute a metric.
So if your data is complex, you’ll need to manually verify the AI’s work.
At Plotly, we believe that it is our responsibility as product designers to make this as easy and obvious as possible. Users have a tendency to take an AI’s output at face value and many AI products on the market don’t lend themselves to critical inquiry or verification.
In Plotly Studio, the AI isn’t actually doing data analysis itself; the underlying LLM doesn’t crunch any numbers, it generates code that will do so.
The code is right there. It’s not hidden behind a modal or a spreadsheet cell. We generate the code in an organized, modular way that is easy to scan, version control, and peer review.
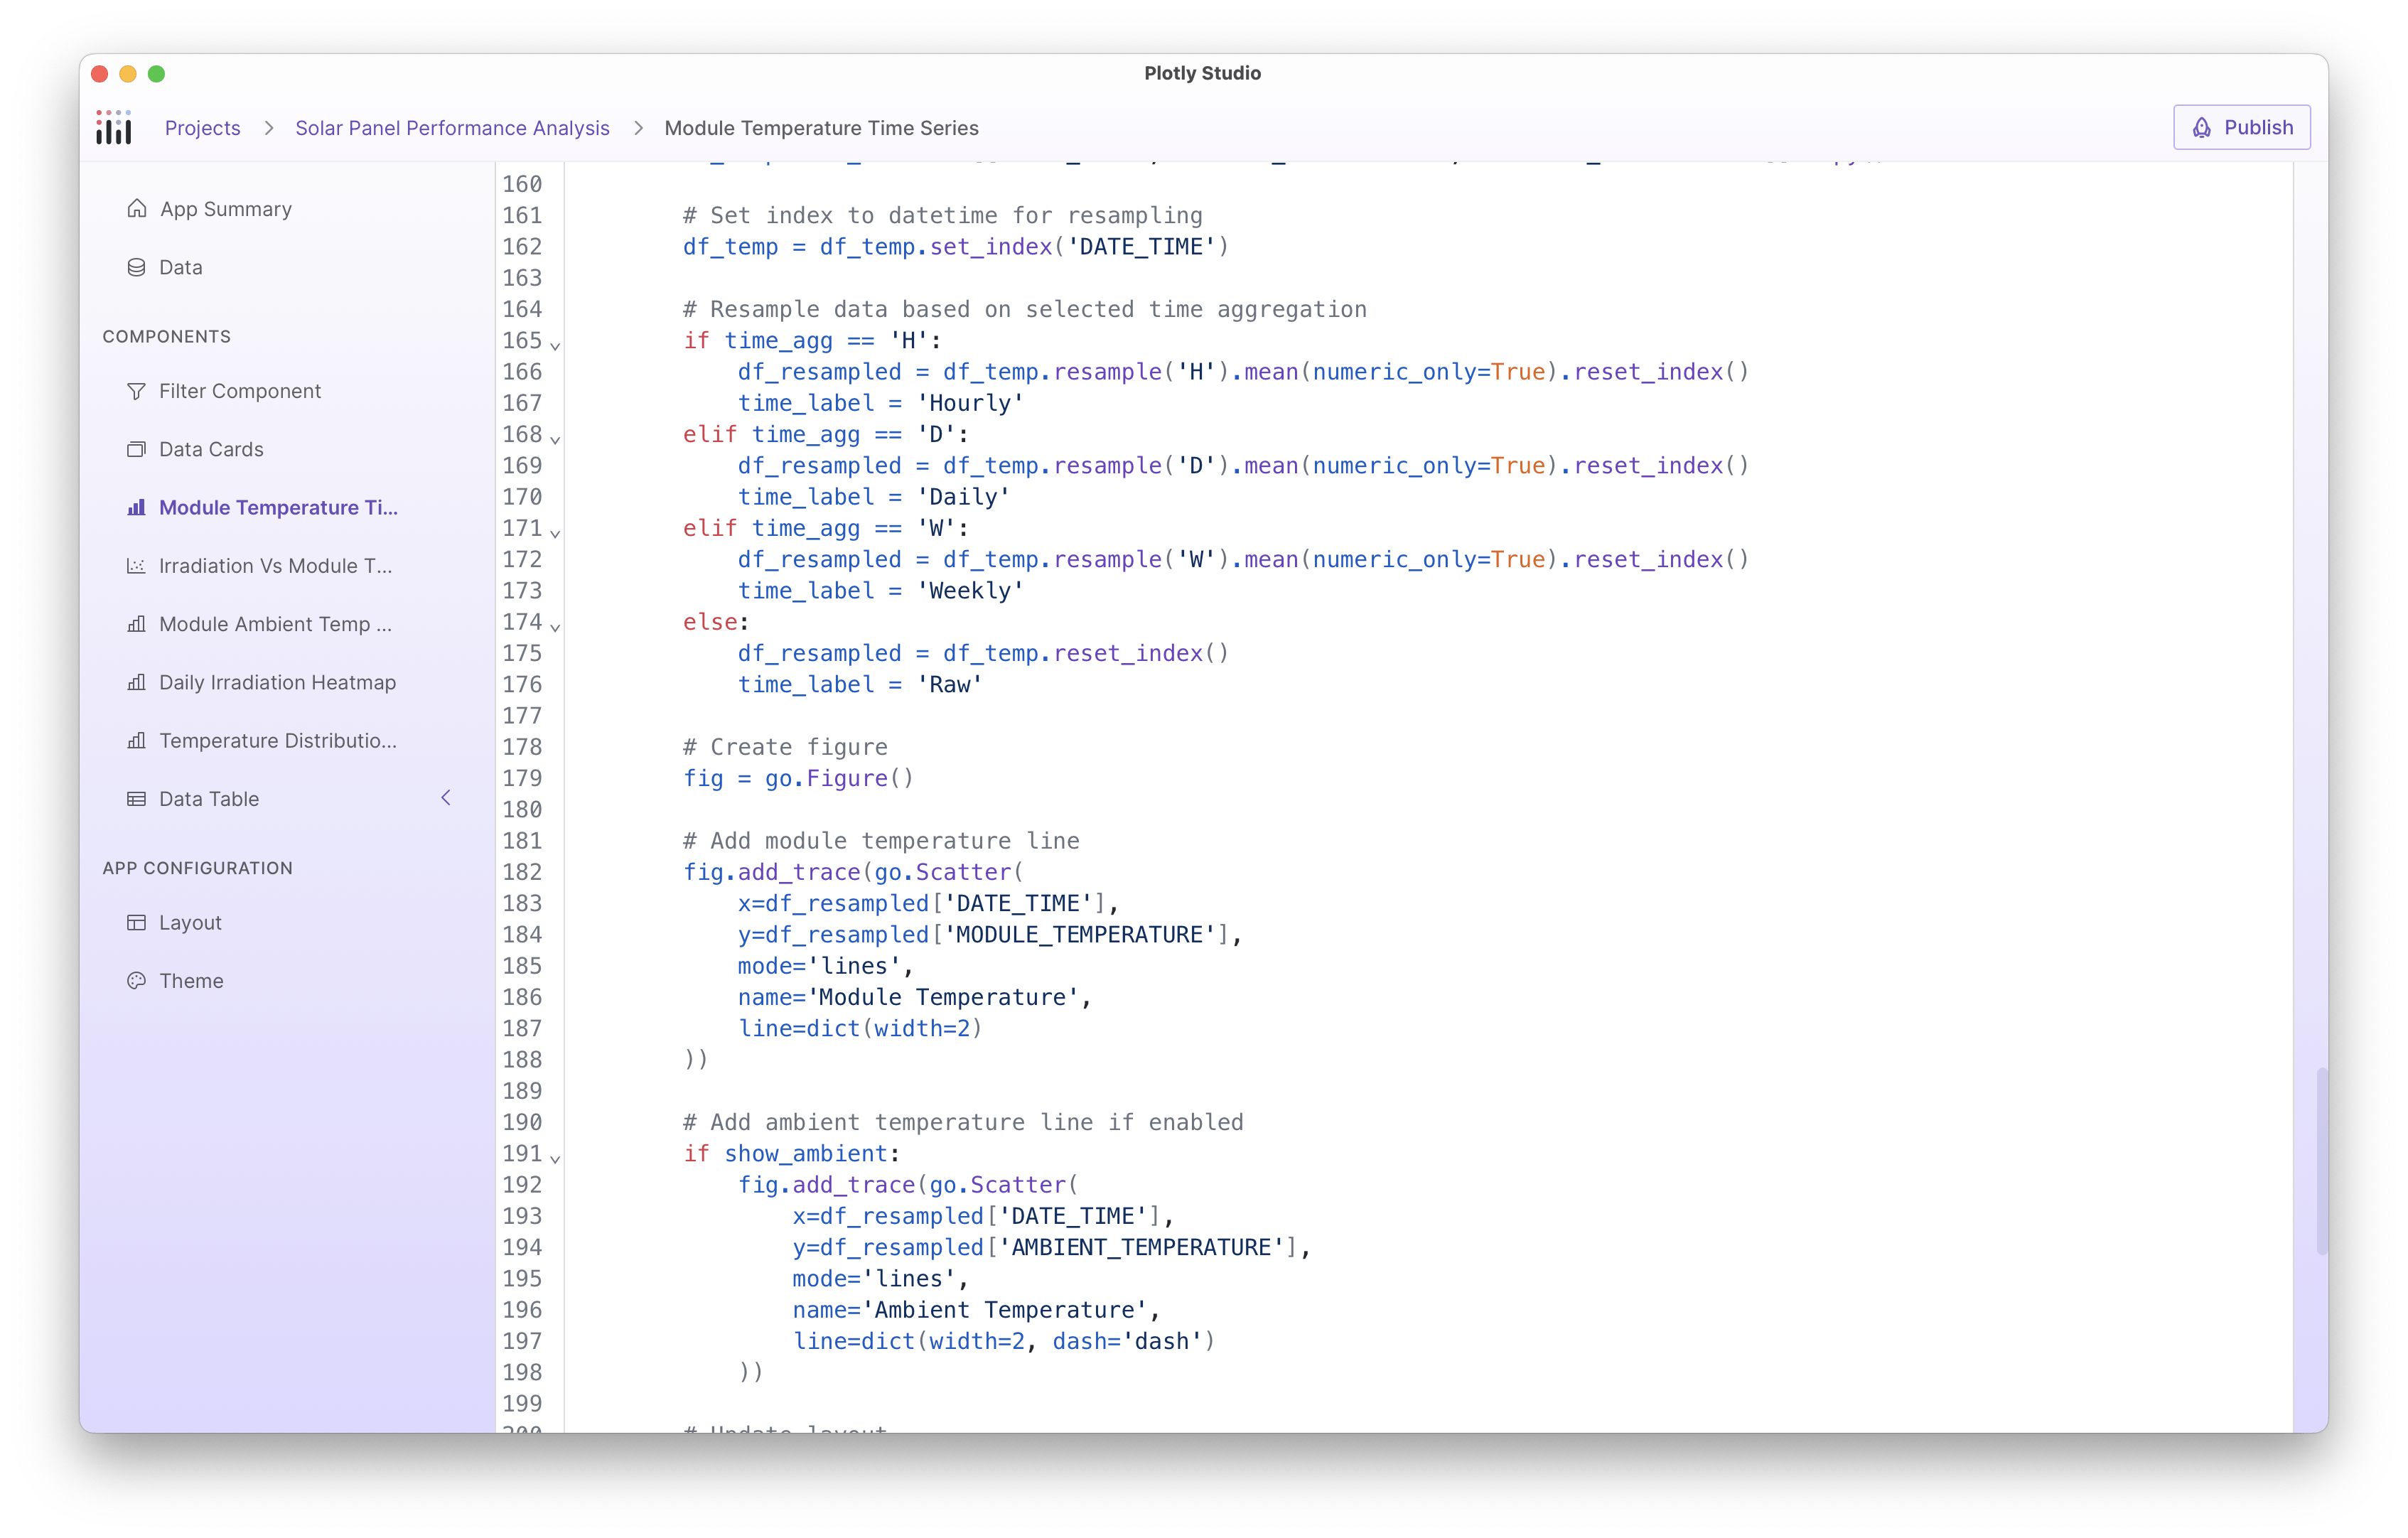
Plotly Studio generates analytic code that is well organized, structured, and easy to scan and verify.
The specification file also describes the behavior of the code and the analytics automatically. It describes the formulas, the filters, and the transformations and it’s formatted clearly and concisely.
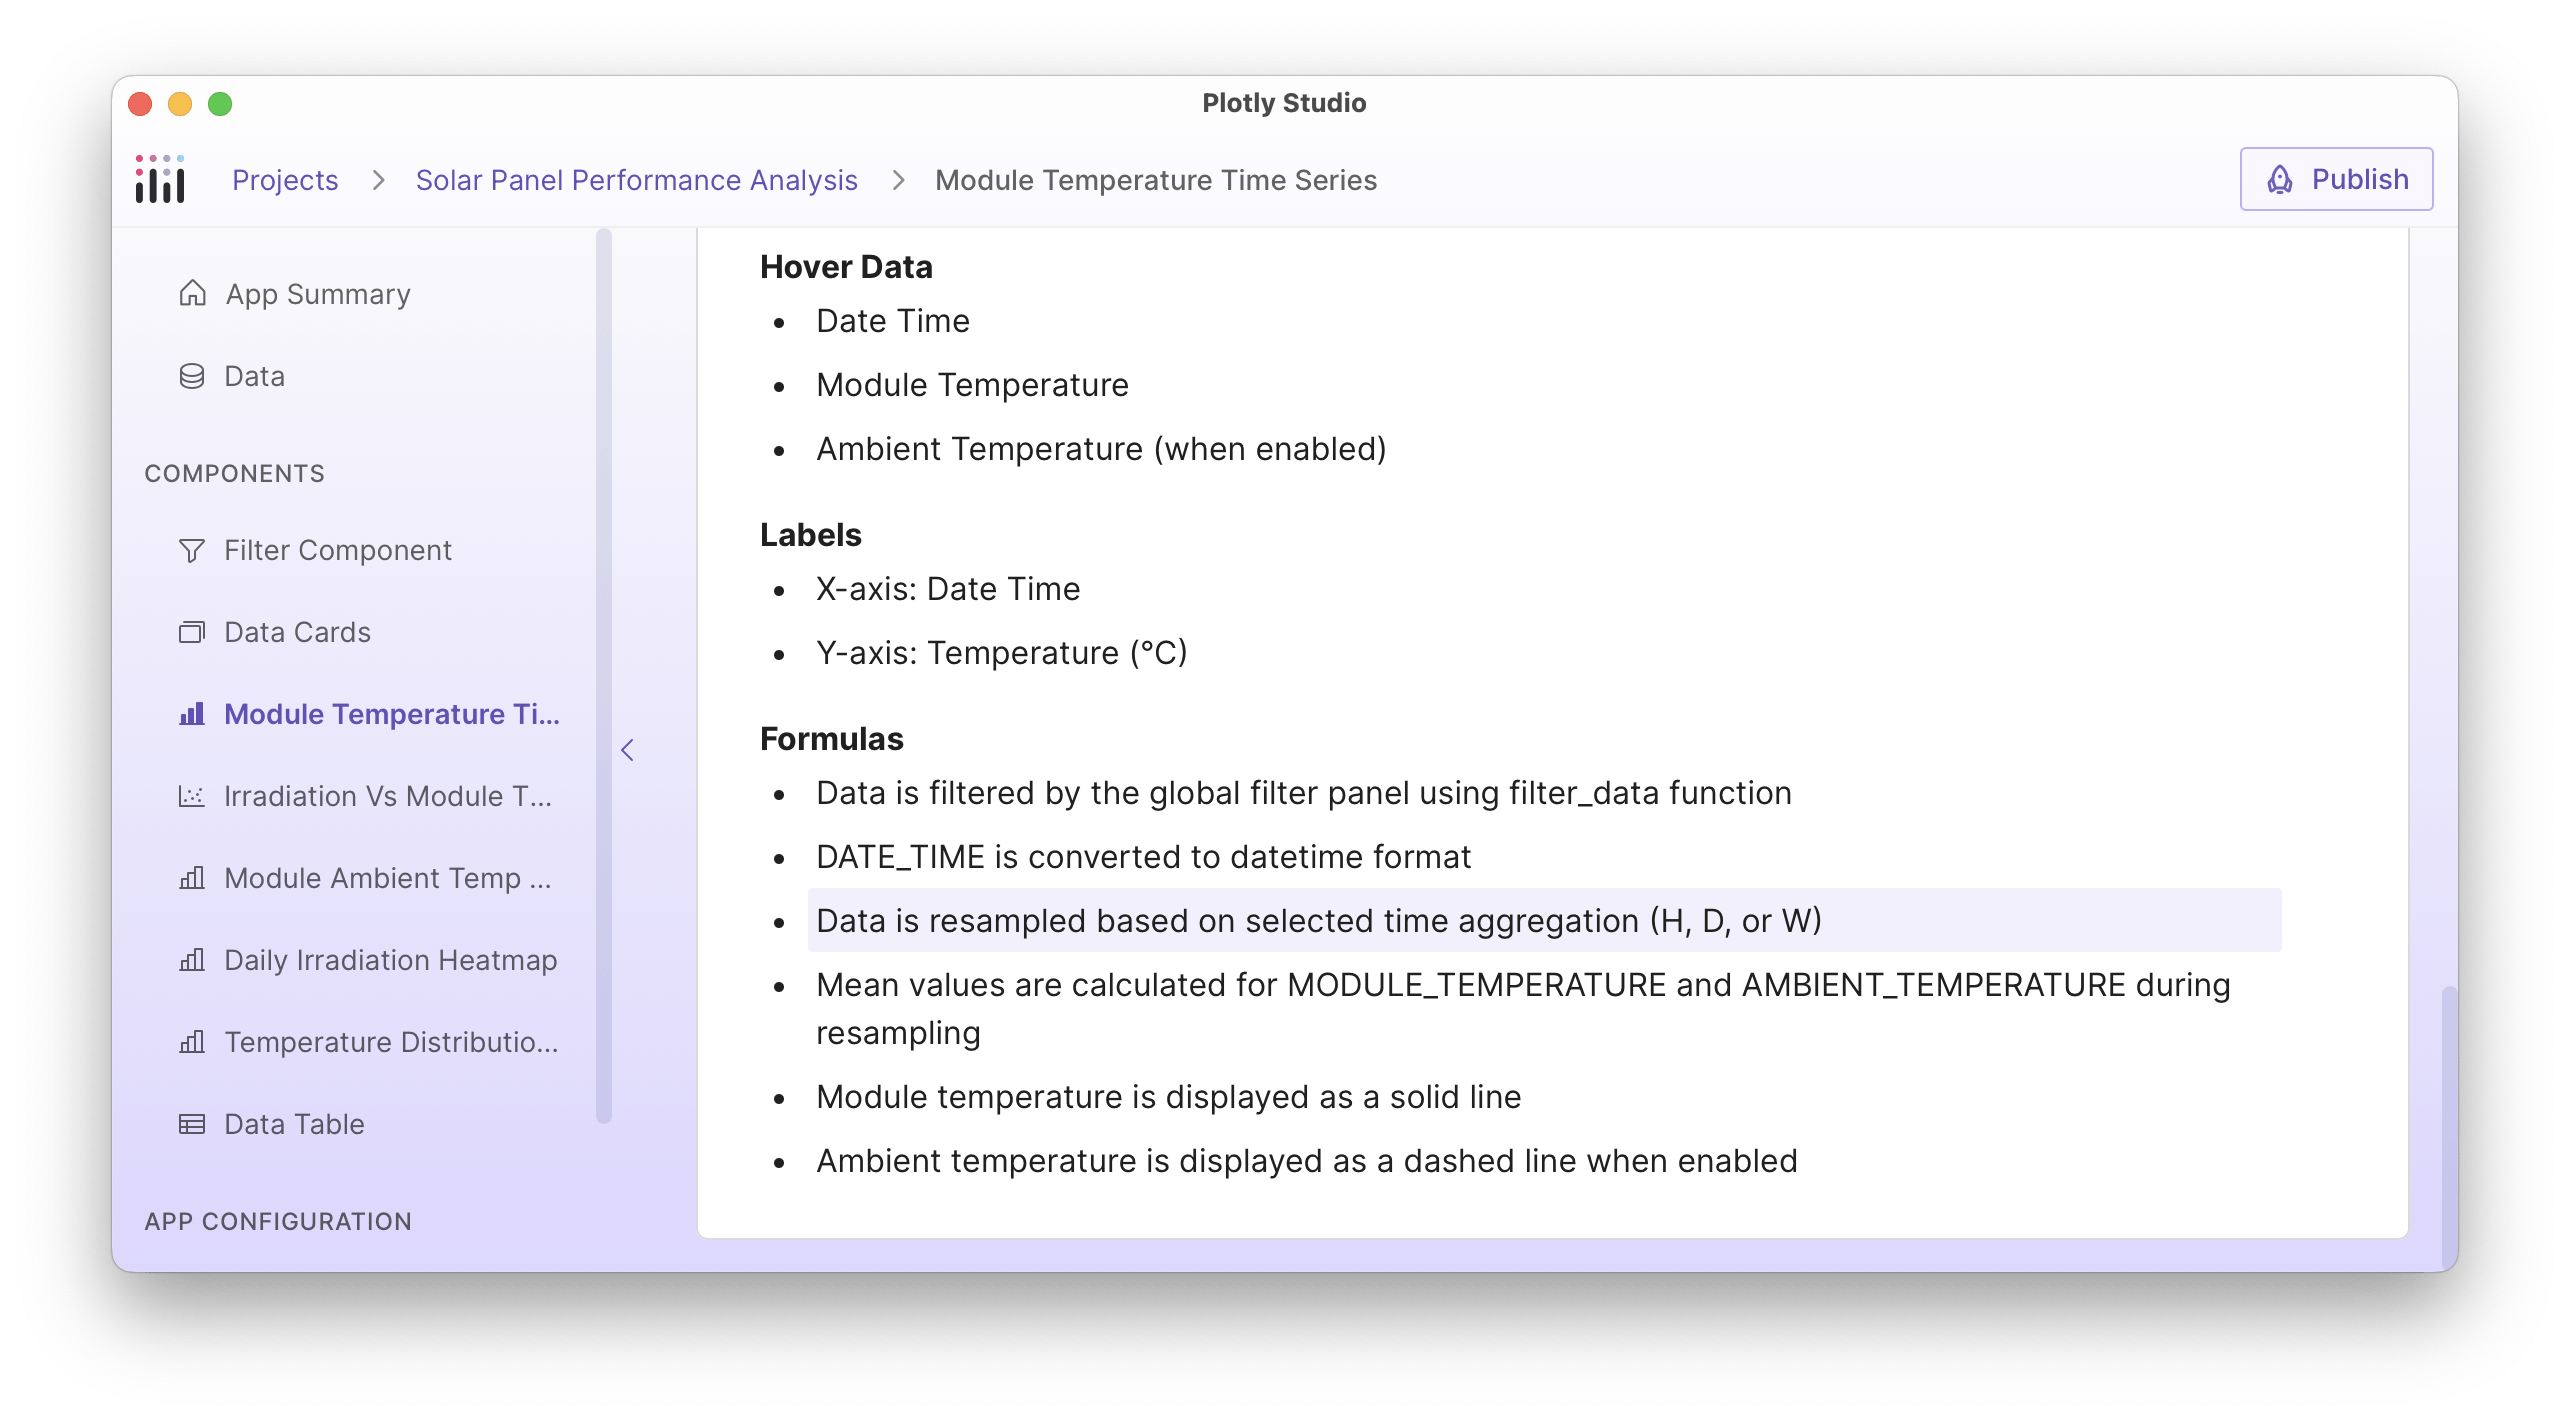
The formulas and analytics behind the chart and its code are presented in natural language in a specification file. The specification files are editable and stay in sync with the code and the chart.
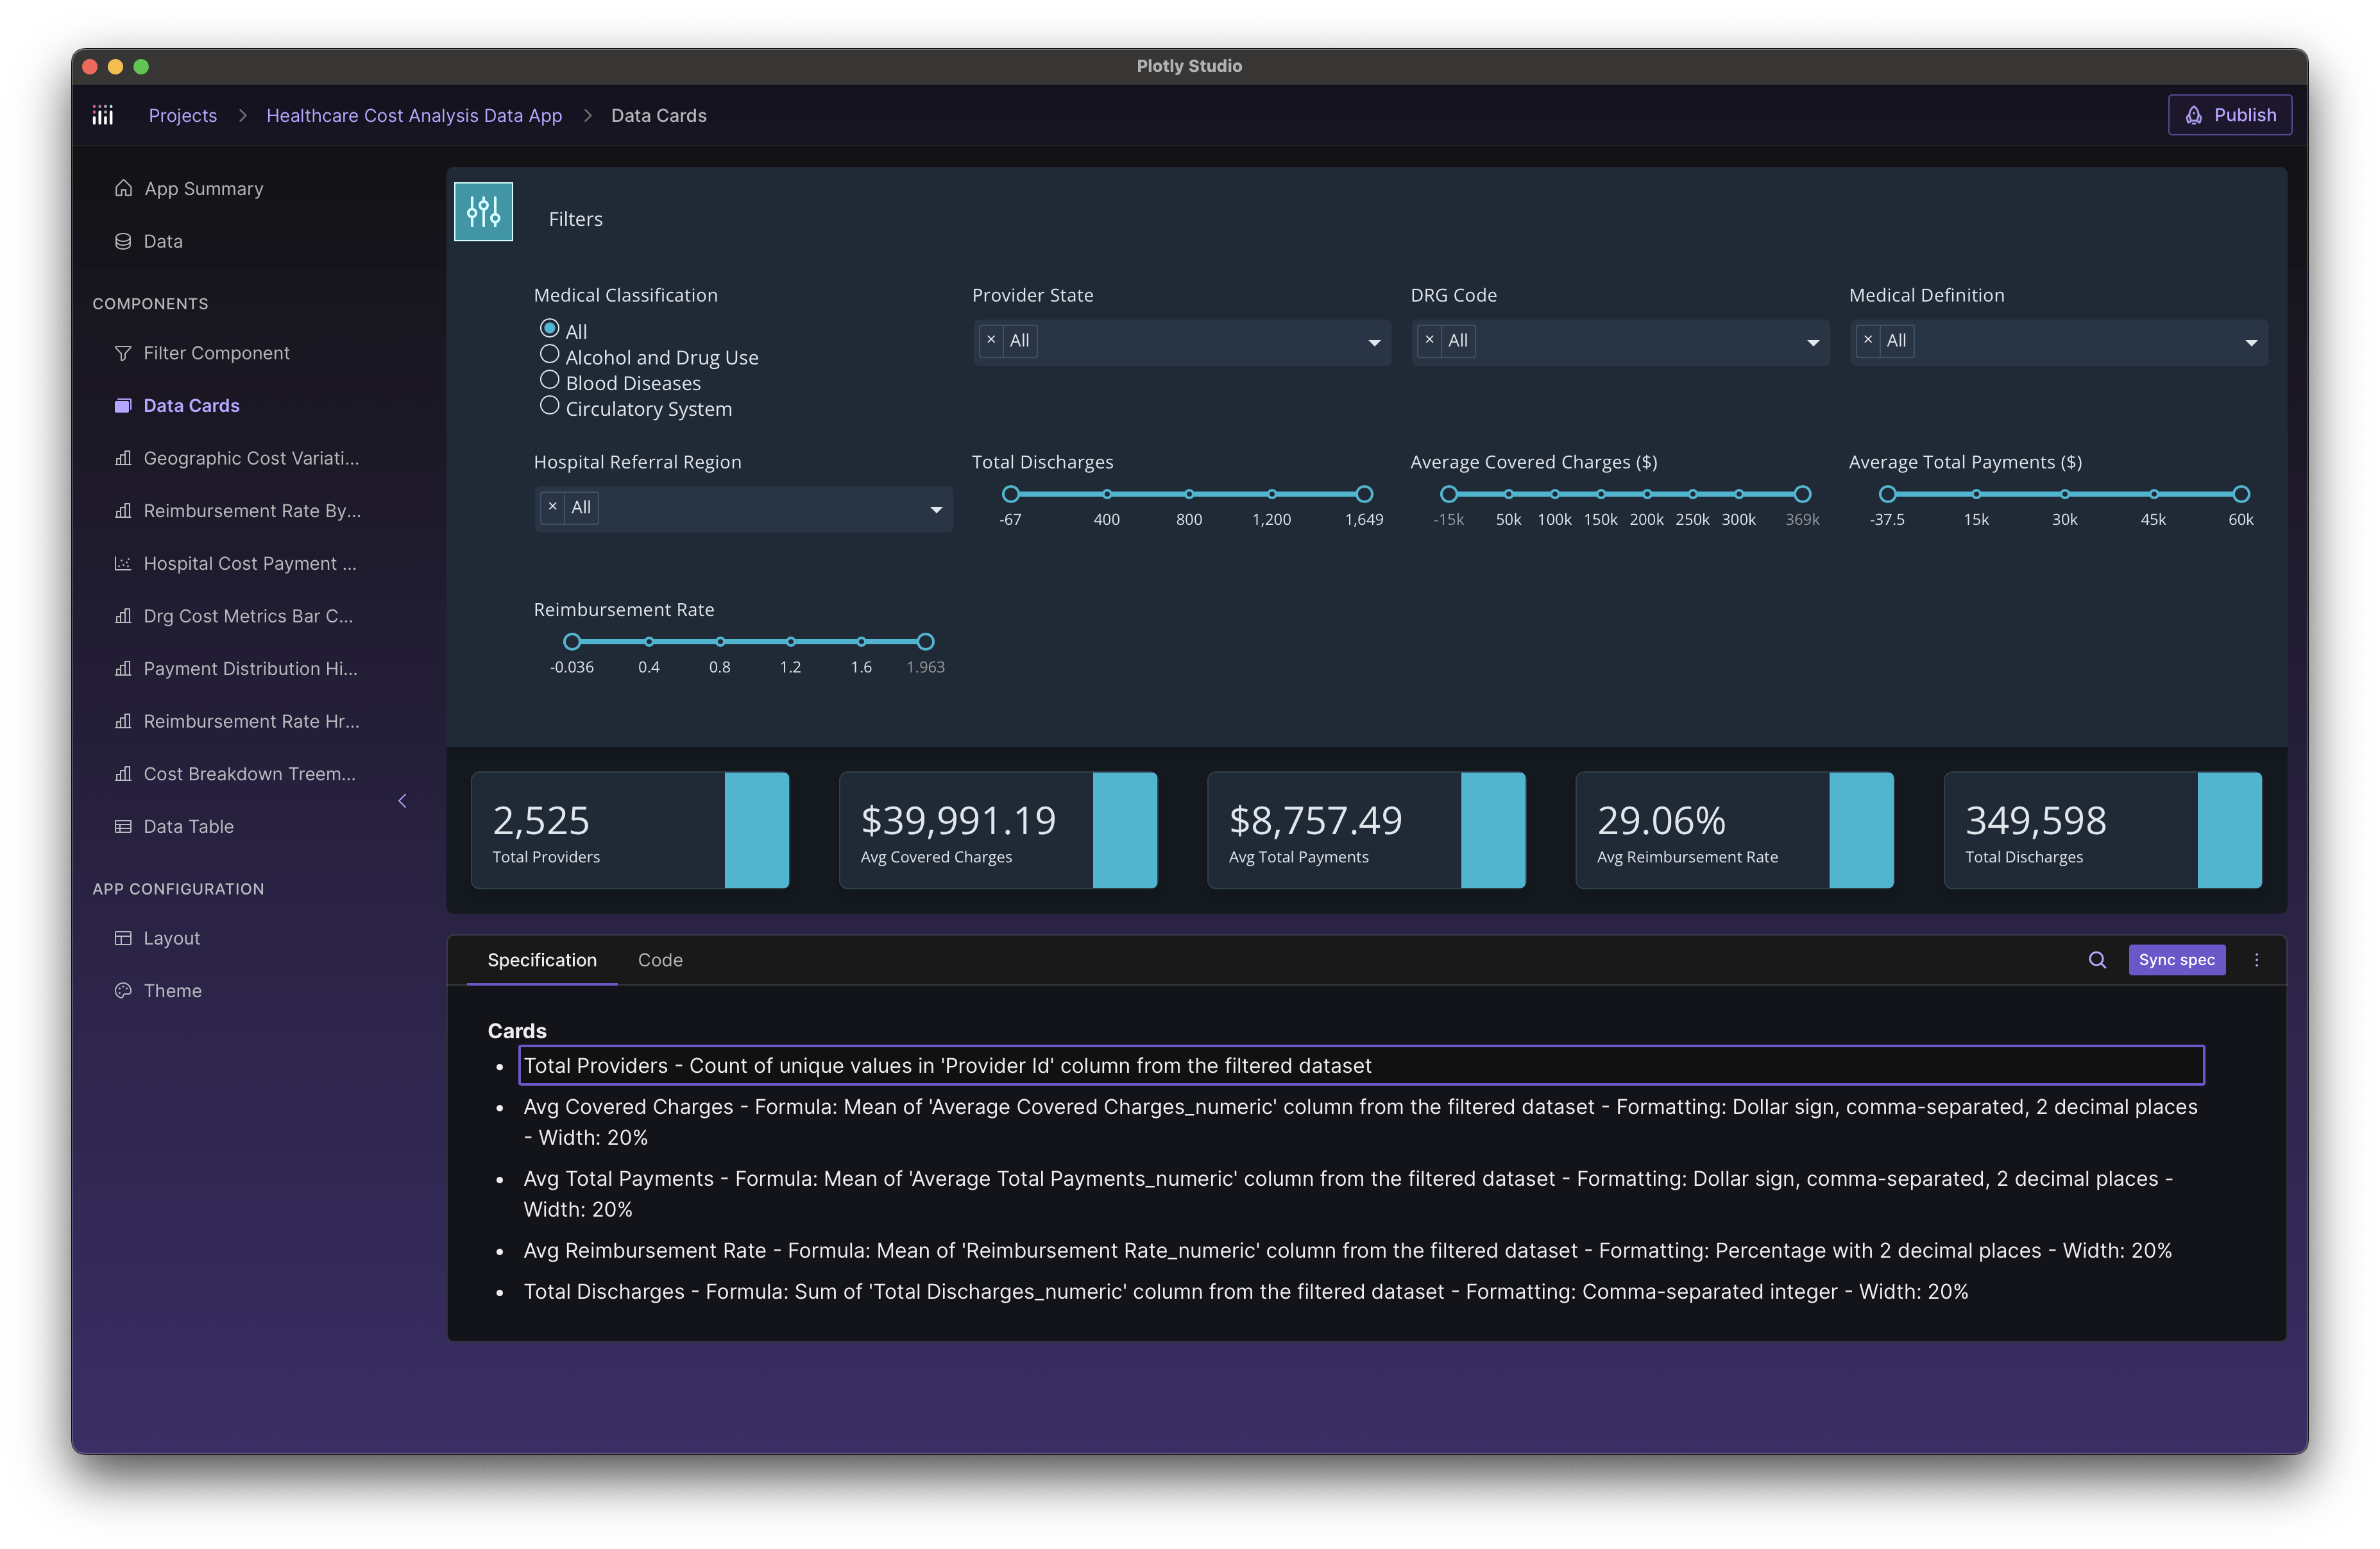
Every component and module of the app has its own specification file. For example, this specification file for the data cards includes the label of the cards, the formula ("Count of unique values in 'Provider Id' column"), and even the number formatting ("Dollar sign, comma-separated, 2 decimal places). When you edit this specification file, Plotly Studio will patch the code to reflect your changes.
The apps themselves include helpful indicators here and there to show you exactly how many rows are filtered and other errors that can pop up.
And we’re designing many more experiences to manually verify the intermediary computations as the code steps through the analytics. It’s data workflows like these that differentiate Plotly Studio from a traditional code editor, chatbot, or spreadsheet.
Plotly Studio is a desktop application
The code runs and the data is processed on your machine. These days, a single consumer-grade laptop can process gigabytes of data; orders of magnitude more than what was possible 10 years ago.
Desktop enables our customers, big and small, to easily and affordably scale analytical compute within their organization using the workstations and network policies that they already have available; no additional compute capital expenditure required.
Getting started with real data is easy and doesn’t require any complex server installation or management. And with our Enterprise LLM integrations, no data will leave the firewall. It’s private by design.
Our Plotly Python libraries are downloaded over 28M times a month. To add to this momentum, our desktop app will enable an entirely new audience who has never touched our open-source libraries to benefit from more than a decade of innovation in advanced data analytics and visualization.
Apps not transcripts
The value of Plotly Studio is that the end results are more permanent than a chat transcript or a prototype. You create working data apps you can publish, share, and iterate on as your data changes. These apps connect to live data sources, run analytics on the fly, and keep up with your operations.
Data apps matter when they get used in your day-to-day operations — checking customer health daily, testing trading strategies against current market conditions, or pulling real-time numbers from a production line. These apps become part of how organizations operate.
It’s not only about saving time
Plotly Studio lets me build data apps 10x faster than doing it manually. But for me and my team, the real value isn’t that it makes us more productive. The value lies in possibility.
The biggest shift has been seeing apps come to life that would never have been built otherwise. Internally at Plotly, I’ve watched Studio unlock projects that sat on the back burner because they were unrealistic given the time or resourcing. We know Dash better than anyone, and still, I’ve seen apps built with Studio that wouldn’t have happened without it.
Behind the Design of Plotly Studio
We started our design by mapping out the data analysis journey from start to finish. Not just the last mile of data visualization but the whole dang journey. We talked to hundreds of our customers and beta users (thank you!) and recorded hours upon hours of ourselves painstakingly dogfooding analytics projects from start to finish.
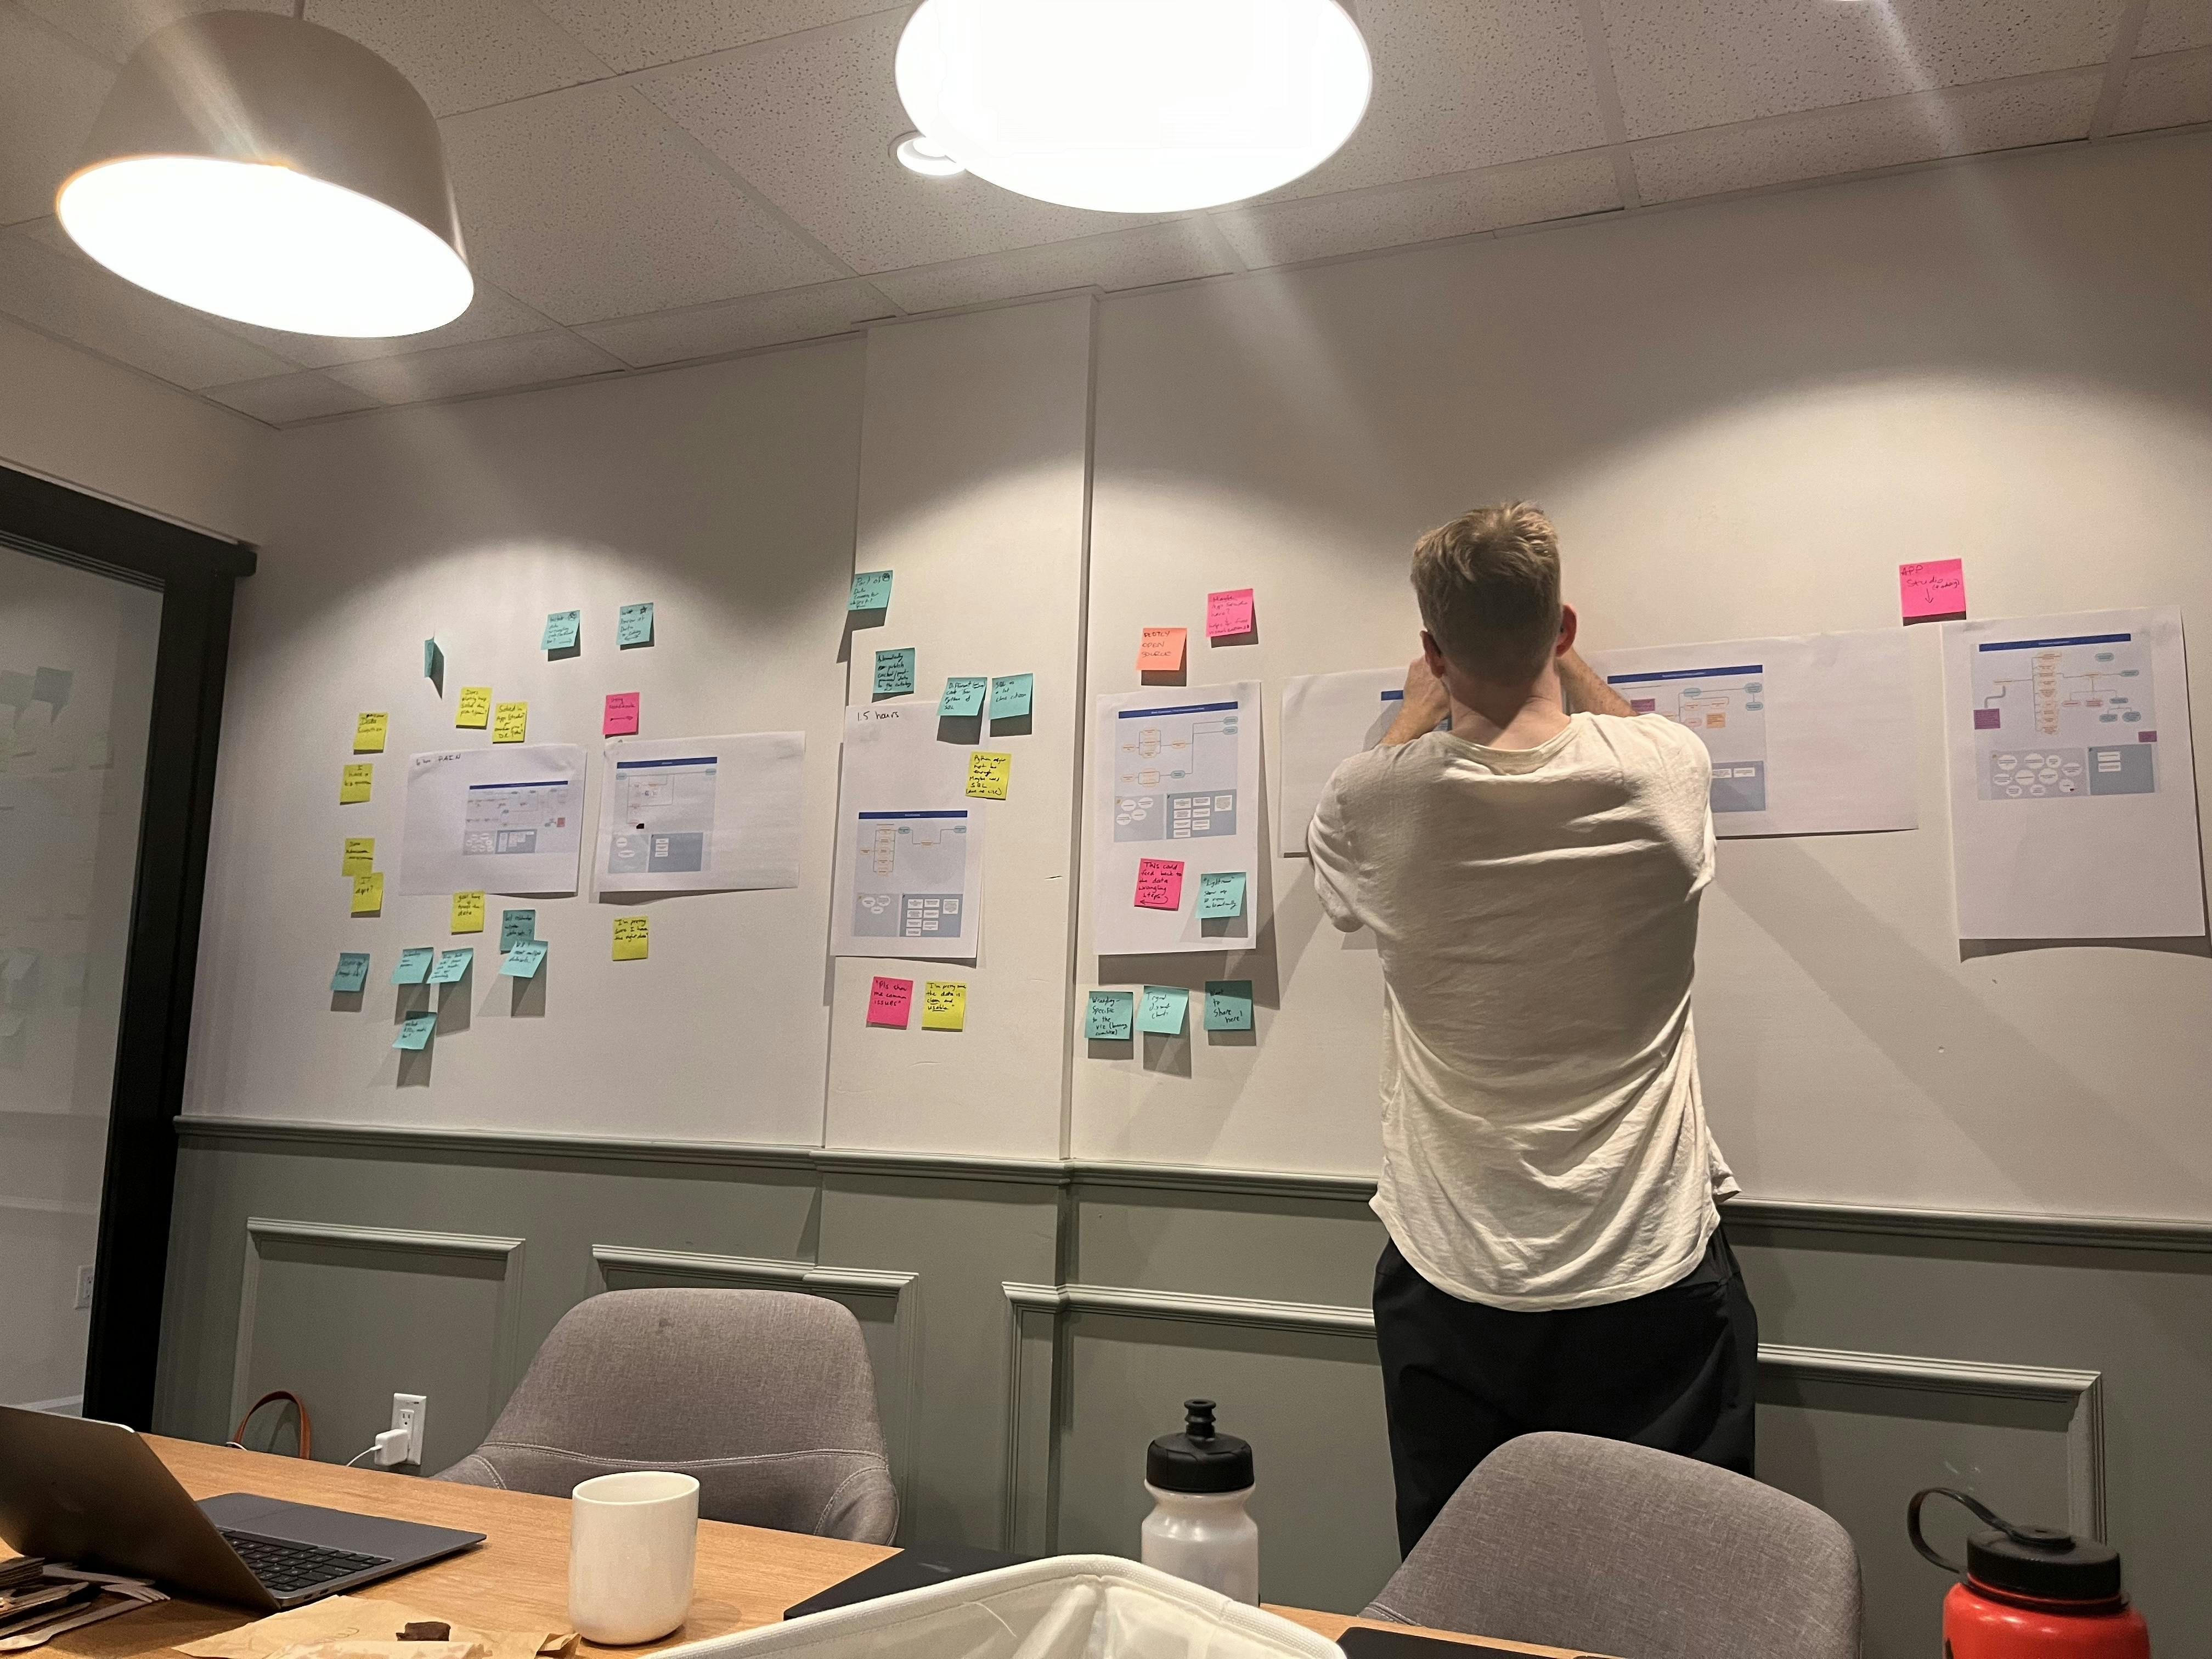
So. many. sticky notes.
Flexibility meets ease
When we talked to our beta users, every one of them is stuck between working in a BI tool that's a bit too limited and doesn't lend itself well to automation or working in code which is limitless but also highly specialized.
Fussing around
There’s a lot of fussing around in data analytics today. Installing Python, theming, annotation placement coordinates, sharing your work, debugging callbacks, parsing dates, caching data, etc, etc, etc.
Plotly Studio gets you from zero to one immediately. It'll create an app that parses, loads, schedules, analyzes, and visualizes your data. It comes batteries-included, with beautiful generative themes and pre-installed Python.
Working backwards
I find it easier to work backwards than forwards.
I've made thousands of charts and data apps over the last 10 years at Plotly and I know our libraries inside and out (I wrote a significant part of them!) and I still have a hard time imagining the right visualization in my mind's eye.
It's easier and faster to work from a first draft. And that’s that magic that we’ve designed in Plotly Studio - we show you something immediately based on your data and let you iterate from there.
BI tools have long touted their UIs as enabling exploration. But whenever I use a chart editor (and I’ve built a fair number of them myself over the years) I often feel like I’m fumbling not exploring. Data is never perfect and data viz requires a tremendous amount of wrangling, shaping, joining, pivoting, and transforming data in advance of even visualizing it. It's an advanced skill set, even if it's behind a GUI.
Plotly Studio cuts to the chase and incorporates all of that data transformation logic in addition to encoding the visualization to show you something immediately that you can iterate on. And not just one thing, but half a dozen charts with controls and callbacks for your dataset. It's a tremendous leap forward in how I explore data and there's no going back.
The future of AI won’t be a chatbot.
The current LLM era can feel like it's for power users. Coveted prompts, plans, and pro tips can make you feel like you’re either in on AI or you’re out.
As I built apps with AI, I found the results to be both breathtaking and inconsistent. When I looked at the apps that the LLMs created — whether through ChatGPT, Claude Code, or Cursor — I found myself thinking “that’s not how I would have done it.” It can get pretty unwieldy pretty quickly and it's easy to get over your skis.
Chatbots are kind of chaotic. So we put it on rails. Plotly Studio isn't as wildly open ended as a chatbot but the results are consistent and high quality. It's a balancing act between finding the places that need to be flexible and open, and the other places that can and need structure.
A little bit more structured
We wanted to offer a new type of AI experience to the world. Something structured and modular.
Plotly Studio produces apps that incorporate a ton of the best practices that we’ve learned and improved over the last 10 years servicing our customers. Our house style.
The app code is organized into well-structured and modular folders and files. A data/ folder handles preloading, processing, and ultimately caching and scheduling data extracts. Each chart and its associated controls are also in their own files and are independently testable and preview able. It’s the same structure that we teach in customer workshops.
You can regenerate components with open-ended prompts or edit components through the specification files. We’ve designed a specific structure and information hierarchy for each of the types of specification files. For example, charts include information about the mapping between the data columns and the axes, the style overrides, the annotations and shapes (if available!), the exact text displayed within the app, and all of the underlying formulas.
Whereas the theming file organizes the theme into its main components, highlighting where styles are inherited or open ended. Even the application layout is described declaratively in a specification file. These files are just plain text, so they can easily be shared and reused between projects and colleagues.
Getting started
We’re co-releasing this product with Plotly Cloud, a new offering for deploying Dash apps, and Plotly Studio apps that are powered by Dash, on Plotly’s infrastructure. Early access includes access to Plotly Cloud as well.
Plotly Studio will be available under monthly or yearly subscriptions with options that span from free tiers to get started to enterprise tiers for large deployments and private LLM integration. It’s compatible with Dash Enterprise, our PaaS offering for deploying and managing Dash apps.
We're so excited for this next chapter. Over the last 10 years, we've developed and maintained open core software that has been downloaded over one billion times. Plotly Studio and Plotly Cloud presents an incredible new workflow for our existing community and opens up these capabilities to a vast new audience. I can't wait for you to give it a try and let us know what you think.


