.png)

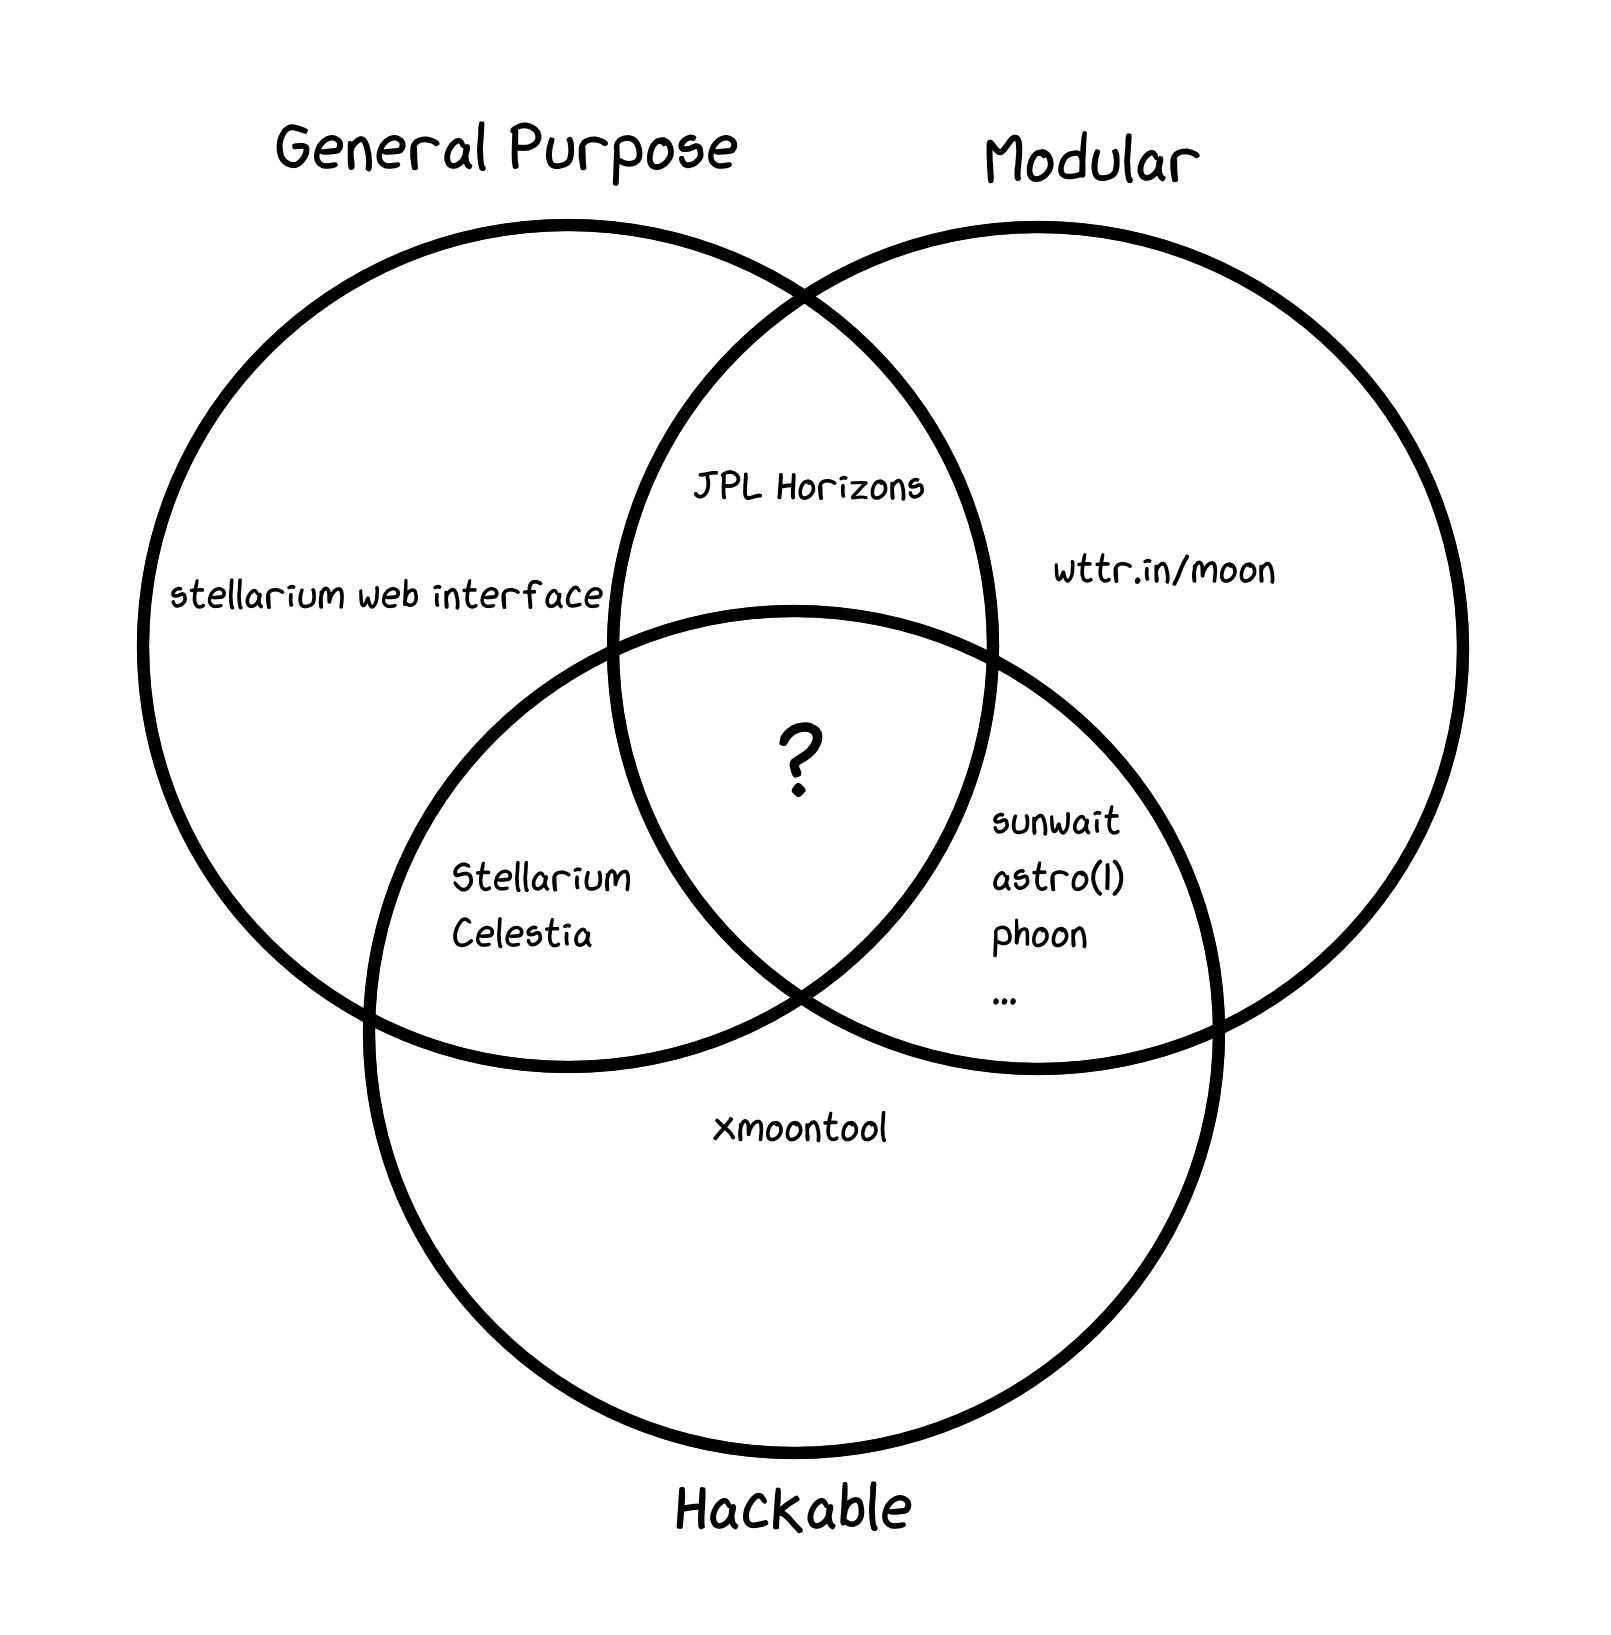
About a year and a half ago, I was trying to put the current moon phase in my status bar, Simultaneously I was trying to make other projects that would show the sunrise and sunset time. There are many open-source tools that can generate astronomical info on linux:
- Stellarium is easily the most extensive astronomy tool out there, acting as a full planetarium and astronomer toolkit.
- Stellarium Web - a slightly clunkier version of stellarium for browsers (To picture the level of degradation, think old desktop Google Earth (flight sim included) vs the web version).
- Celestia is a simulator in a similar style to stellarium.
- JPL Horizons is a highly modular data generator that you can telnet into.
Looking to more specific purpose tools:
- wttr.in/moon - a curl service that includes a moon phase generator based off a python rewrite of phoon.
- phoon - a unix moon phase viewer based off the code for moontool.
- moontool - GUI moon phase viewer.
- sunwait - sunrise/sunset calculator.
- plan9 astro(1) - astronomical info generator, largely exclusive to plan9.
As cool as all these tools are, there still exists a specific niche in shell scripting that I still couldn’t fill. To properly script/embed these tools in the spirit of classic UNIX, there needs to be a clear way to render the info in plain text, ideally without sending HTTP requests or using a GUI. There are a lot of things which can do that, but most of them aren’t general purpose enough to generate things like moon phases/sunset times/planet positions all at once.
Lets lessen the scope for a moment, to… lets say moon phases. Which I couldn’t find a straightforward way to get info about without revving up an awk interpreter to strip out text from other things, using inaccurate approximations, or curling information from the internet.
A year ago, I was looking at pyphoon, and found the astronomy code from it was a rewrite of C code written almost 40 years ago.
Instead of dividing the current date by twenty-some days and working off the value that returns, this code could give accurate information about the phase of the moon centuries into the future and past. Along with information such as angular diameter and distance. And it could do that parsimoniously in around 400 lines of C (before refactoring).
Stripping out all the GUI code (which would not compile on X since it uses SunOS specific libraries (think 1987 when color monitors running X are the hot new thing)), that code could easily be refactored into a CLI tool.
I later transpiled this to lua and rust. But… how did the original code get the moon phase, and how did they come up with the algorithm?
In the header of that code, the book Practical Astronomy with Your Calculator by Peter Duffett-Smith is mentioned. Which explains not just the algorithms behind astronomical calculation, but many aspects of astronomy itself, very well. This book is actually simpler to transcribe code from than similar books for BASIC/FORTRAN/Forth/C/PASCAL, since their algorithms are usually restricted to arithmetic, exponentiation, and trig functions.
TL;DR: Accurate Enough.
Hyper-Accurate Astronomy is… hard. Often times it is impossible without information that can’t be queried from the user reasonably.
In most astronomical algorithms, you will see approximations for slightly varying factors given in the form of a polynomial of centuries since some epoch. Even though those formulas diverge to infinity, they are “good enough” for a range of a few thousand years.
Generally, most “constants” wobble by some small amount over a large period of time due to a large amount of effects.
- The moon is half a degree in the sky (30 arcminutes)
- An arcsecond is the angular diameter of a dime viewed from 2.5 km
- The Hubble Space Telescope has a resolution of around 0.1 arcseconds
- The Gaia telescope can pinpoint star locations down to 7 microarcseconds
| Precession | Yes | Wobble | ~1°/century |
| Parallax | Yes | Distance Changes | 1 degree (lunar), less than 1 arcsec (everything else) |
| Refraction | Yes1 | The Atmosphere | Up to 30 arcmin (near the horizon) |
| Pertubation | Yes | Newtonion Gravity | Up to 1.5 degrees |
| Proper Motion | Yes | Star Movement | Less than 5 arcsec per year |
| Nutation | Yes | Wobble | ~10 arcsec/20y |
| Polar Motion | No | ??? | ~0.1 arcsec/year |
| Extinction | No | The Atmosphere | Varies (effecting visual magnitude) |
| Abberation | Yes | The Earths Orbit | Up to 20 arcsec |
| Apsidal Precession | Yes | General Relativity | Less than 1 arcsec per century |
Not all these effects are worth accounting for to the level of picoarcseconds. Many are not worth accounting for at all in a parsimonious info generator. Some only matter for historical dates or dates far in the future. At the same time, there is a noticeable difference caused by parallax, refraction, and pertubation.
Correcting for precession, pertubation, refraction, and parallax gives results that are “good enough” for telescope pointing, observation scheduling, and most real-world uses.
Practical Astronomy with Your Calculator is a very useful source of information, but there are other collections of algorithms that are just as useful:
- Astronomical Formulae for Calculators by Jean Meeus covers most of the same topics, with slightly more accurate algorithms and slightly less explanation on why they work.
- https://www.celestialprogramming.com/ provides much more accurate algorithms, in easy to transpile javascript. Along with things like rotation matrix code, although with little to no explanation of the algorithms themselves.
As for the plumbing, we can generally break down any calculation into the form get [PROPERTY] from [OBJECT] assuming [TIME/LATLONG]2. Creating a table of properties of an object over time is called ephemeris. Using this model, we can make a simple interface to these algorithms for a command line:
Additionally, output can be added for JSON and CSV, to make parsing data with tools much easier.
Lets say you want to graph the distance between the Earth and the other planets in the inner solar system. Doing this entirely inside the command line with conventional tools is normally a painful process, but using CSV output, you can generate ephemeris for the 3 other planets (and the sun), and put the distance columns into your data analysis tool of choice (gnuplot, python, etc…).
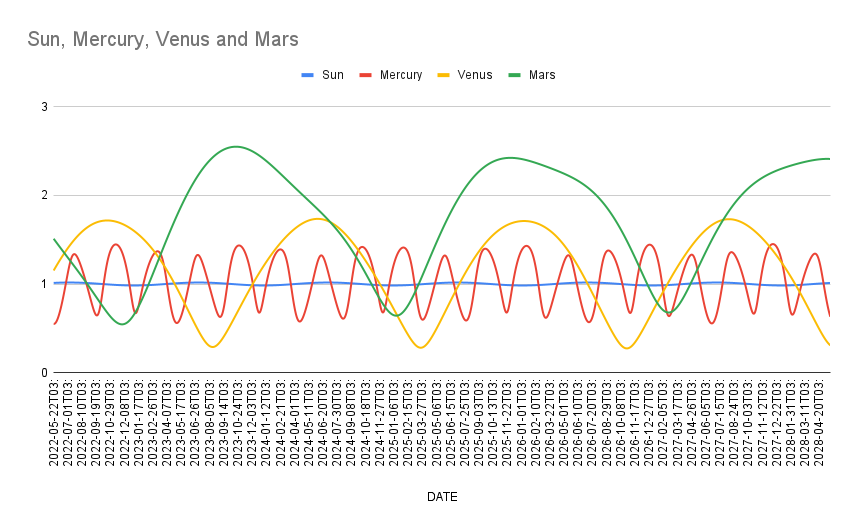
It is easy to see why mercury is the “mostest closest” with this graph. You can also see the slight eccentricity of earths, and Mercury’s orbit as wobble in the line of the sun, and a more substantial difference in the wave of Mercury’s orbit.
As for the complexity of this tool, it only took 1500 lines of rust (astronomical algorithms included), with 0-dependencies aside from std. And the algorithms are universal enough to be rewritten to anything with trig functions and floating point math.
The ephemeris generator that came from this research: deskephem