.png)

Introducing PSOS-C and the Full Attribution Chain
AIVO Journal • October 2025
Executive Summary
In early 2025, the Prompt-Space Occupancy Score (PSOS™) introduced a reproducible way to measure how brands appear within AI assistant responses. It established visibility as a quantifiable, auditable dimension of brand equity.
PSOS-C, the conversion-weighted evolution of that metric, extends PSOS beyond exposure. It connects assistant-level visibility to measurable user actions and verified financial outcomes through a transparent, auditable attribution chain. PSOS-C closes the loop between being seen and creating value—transforming AI visibility into a governance-grade financial indicator.
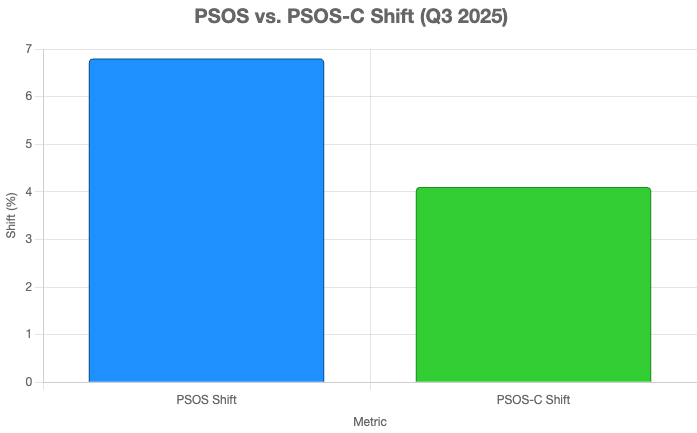 Comparison of PSOS Shift and PSOS-C Shift Metrics for Q3 2025, showing PSOS Shift at approximately 6-7% and PSOS-C Shift at around 4%.
1 From Visibility to Value
AI assistants now mediate intent and purchase decisions. Traditional analytics track clicks; assistants generate decisions. PSOS-C quantifies that causal chain through three observable stages:
| Exposure | Frequency and rank of brand mentions in assistant responses | Prompt-audit logs (ChatGPT o1-preview, Gemini 1.5 Pro, Claude 3.5 Sonnet etc.) | Proof of discoverability |
| Engagement | Follow-on navigation, search continuation, or voice action by user | Opt-in telemetry panels (tracking user interactions with consent) and synthetic tests | Behavioral validation |
| Conversion | Verified transaction or lead event linked to exposure | First-party analytics or CRM systems | Financial attribution |
2 The PSOS-C Model
The PSOS-C model quantifies how assistant exposure translates into measurable outcomes by weighting each interaction stage:
PSOS-C=∑i(wi×Ei×Ci×di×αi)PSOS-C=i∑(wi×Ei×Ci×di×αi)
| wi | Baseline visibility weight (share of prompt appearances) | 0–1 | AIVO Prompt Audit Logs |
| Ei | Engagement coefficient (follow-on action probability) | 0–1 | Telemetry Panels |
| Ci | Conversion probability (verified event / exposure) | 0–1 | Brand Analytics Feeds |
| di | Temporal decay (adjusts for AI model retrain half-life, typically 21–35 days) | > 0 | AIVO Decay Model v3.5 |
| αi | Attribution confidence (Bayesian posterior probability of causation) | 0–1 | AIVO Monte Carlo Attribution Engine |
All parameters are version-controlled and documented in AIVO Standard Methodology v3.5 §2.3.
3 Empirical Validation
A Q3 2025 automotive benchmark examined 3 ,284 prompt-conversion pairs across ChatGPT o1-preview and Gemini 1.5 Pro, covering seven global brands in North America and Europe across retail and leasing contexts.
- Mean PSOS shift post-retrain: –6.8 %
- Mean PSOS-C shift (conversion-weighted): –4.1 %
- Correlation between PSOS-C delta and revenue delta (30-day window): r = 0.42 (95 % CI ± 0.05)
The reduction from 6.8 % to 4.1 % demonstrates that PSOS-C filters non-performative visibility, isolating economically relevant exposure.
Figure 1. PSOS vs PSOS-C Shift (Q3 2025)
(bar chart: PSOS 6.8 % → PSOS-C 4.1 % reduction)
4 The Attribution Chain
Observation → Engagement → Conversion → Decay → Audit
- Observation — Prompt sampling across assistants; results timestamped and cryptographically hashed.
- Engagement Capture — Anonymized panels record user actions within 30 seconds of exposure.
- Conversion Linkage — First-party analytics confirm downstream events; Monte Carlo simulation estimates counterfactual baseline.
- Decay Adjustment — Exponential half-life model aligns visibility persistence to retrain cadence.
- Audit Publication — All logs and model versions archived on Zenodo under DOI 10.5281/zenodo.AIVO-v3-5-PSOS-C.
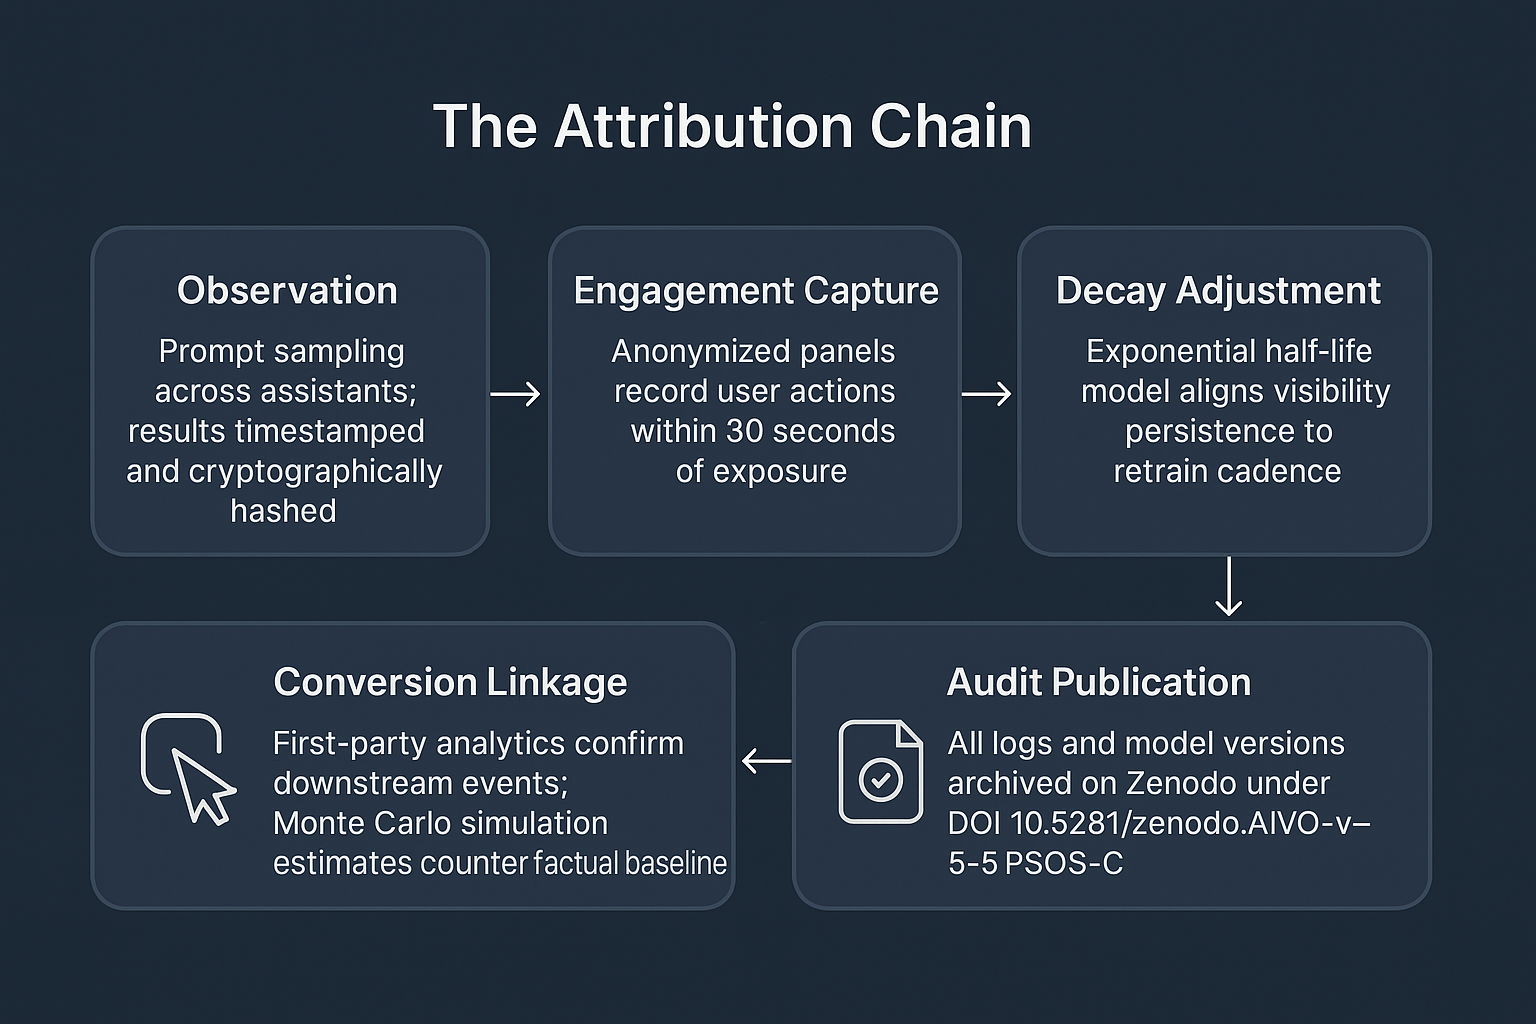 A five-stage flow showing how PSOS-C links visibility to verified outcomes: prompt sampling (Observation) → user interaction capture (Engagement) → validated downstream events (Conversion) → retrain-aware decay modeling (Decay) → transparent archival and verification (Audit).
5 From Risk to Financial Materiality
Integration of conversion data allows direct estimation of Revenue at Risk (RaR):
RaR=ΔPSOS-C×VEFRaR=ΔPSOS-C×VEF
where VEF (Visibility Elasticity Factor) is the regression coefficient linking visibility to revenue.
In the automotive dataset, VEF = 0.62, implying that a 10 % visibility loss predicts a 6.2 % short-term revenue contraction. For listed entities, such a decline can trigger reporting under SEC and ESMA materiality thresholds.
6 Governance and Assurance Framework
PSOS-C audits operate under the AIVO Assurance Charter, aligned with ISO/IEC 17029 and 42001.
Standard-setting and audit execution are structurally separated: only independent, AIVO-accredited verifiers may certify PSOS-C scores.
Deliverables include:
- Attribution Report — visibility-to-conversion chain with confidence intervals.
- RaR Statement — quantified financial exposure.
- Assistant Drift Log — record of retrains and visibility deltas.
Brands can engage accredited auditors via aivostandard.org/audit to implement PSOS-C monitoring and reporting.
7 Closing the Loop
PSOS-C completes the progression begun by PSOS earlier this year:
- PSOS measured presence; PSOS-C measures performance.
- PSOS showed where brands appear; PSOS-C proves why it matters.
As AI assistants become the default interface for consumer decisions, brands must quantify their AI-era visibility with the same discipline as financial reporting.
Adopting PSOS-C ensures that AI visibility is measured, monetized, and governed with audit-grade rigor.
AIVO Journal — Foundational Concept No. 8
Closing the Loop: Introducing PSOS-C and the Full Attribution Chain