.png)

Introduction
Transitioning to a low-carbon future is likely to strain bulk electric power systems, especially when paired with increasing demand1; nevertheless, decarbonizing electricity is one of several key pillars for achieving global sustainable development objectives, such as limiting climate change and its impacts2. System planners in countries overseeing such a transition must make long-term infrastructure planning decisions in the face of uncertainty about the future3,4. Navigating national decarbonization pathways will require robust strategies to utilize diverse, intermittent, and unevenly distributed resources5. In many low- and middle-income economies (categorized by the World Bank through gross national income per capita), achieving emissions reductions while balancing cost, reliability, and energy security will continue to be a critical challenge. At the same time, large-scale (international to global) decarbonization efforts will hinge on more fragmented national- and subnational-scale infrastructure investments and decisions6,7,8. In many regions, neighboring electricity systems have natural complementarities in renewable (namely, wind and solar) and hydropower potential, built infrastructure, and demand patterns9,10. In some cases, such differences can emerge as competitive advantages. Often, especially in the Global South, there is an opportunity for greater regional coordination of electricity grid planning and operation, with the potential for economic, environmental, and societal co-benefits10 (see Supplementary Note 1). To fully enable these benefits, investments in future grids should explore the value of expanding interregional transmission in addition to optimizing investments in generation capacity11,12,13.
However, assessing the complementarity of one country’s renewable resource endowment with another’s is sensitive to numerous uncertainties, which may emerge differently across scales14,15,16,17. Adopting finer-scale spatiotemporal representations of wind and solar photovoltaic (PV) buildout, for example, can lead to larger uncertainty in distributional outcomes among individual countries, even when the aggregated system’s sensitivity to uncertainty remains small16,18,19,20; this adds to the difficulty in providing robust planning decisions across scales21,22. Separately, uncertainty surrounding the techno-economic performance of wind and solar PV technologies can also drive future capacity expansion outcomes23,24. It is important, then, to understand how uncertainty in spatially resolved modeling inputs may impact larger-scale regional infrastructure decisions and coordinated grid outcomes25,26,27 (see Supplementary Note 2). Further, assessing the degree to which country-level burdens and benefits may be distributed within a decarbonizing regional system subject to these uncertainties is needed to justify coordination.
Previous studies evaluating the benefits of regional electricity coordination vary in their treatment of specific, isolated uncertainties and the level of detail in model structure11,12,22,28,29 (see Supplementary Note 1). As such, there are gaps in our understanding of how regionally coordinated grid infrastructure planning may be influenced by spatially explicit resource potentials under techno-economic uncertainty, and how the impacts will be distributed across scales. It is thus an open question how regional electricity systems can better utilize finer-scale representations of resource potentials to cooperatively design robust, co-optimized generator fleets and transmission expansion pathways. We help address these gaps by exploring a broad range of scenarios to glean insights on the tradeoffs and synergies stemming from regional grid coordination under uncertainty, using a model with a highly detailed spatial resolution of resource endowment.
Here, we use an open-source optimization-based capacity expansion model (GridPath30) to assess the role of full regional coordination on electricity capacity expansion and deep decarbonization pathways among five countries in South America: Argentina, Brazil, Chile, Paraguay, and Uruguay (Fig. 1). This region is actively developing economically while simultaneously working to further decarbonize its electricity system. While our modeling does not explicitly account for institutional and political complexities surrounding regional coordination (see “Discussion” section), this region’s history of shared binational hydroelectric projects and regional economic integration through the Mercosur or Southern Cone trade bloc31 positions these countries favorably for longer-term, coordinated electricity planning (Supplementary Note 3). Historically a hydro-dominated grid, Mercosur has also adopted other forms of clean electricity to meet growing demand (and balance its hydroelectric generation) while avoiding future emissions32. Our analysis reveals insights into the ability of coordination and electricity trade to cost-effectively insulate against deep uncertainties in the energy transition, and the emergence of substantial but potentially uneven economic benefits under a range of possible futures. The modeling and experimental setup can be adapted to any region with the potential for regional grid coordination, while the insights articulated here are particularly pertinent to groups of countries with geographically variable resource endowments and diversity in size and demand patterns.
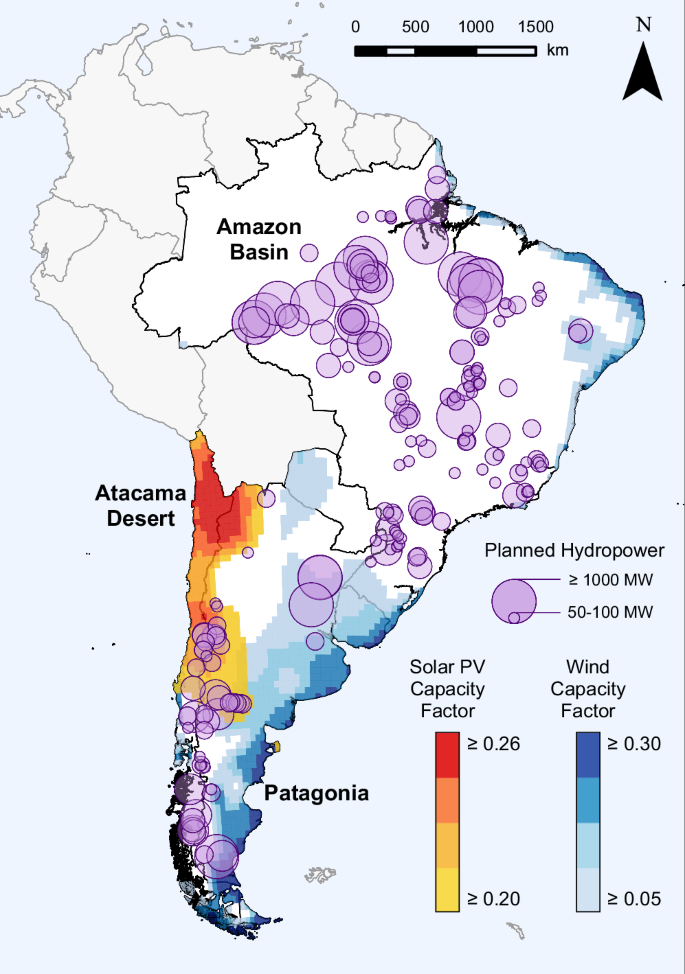
Discretized site-specific capacity factors for some wind and solar sites are shown, along with the location and capacity of future candidate hydropower projects (see “Methods” section). Labeled regions represent areas of particularly rich resource endowment.
Results
We explore an ensemble of 80 scenarios (Table 1) that vary across four levers: level of regional electricity coordination, mid-century emissions policy, wind turbine characteristics, and solar tracking type (see “Methods” section). For the level of regional electricity coordination, we consider a Full Coordination assumption in which countries trade openly while co-optimizing international transmission investments as part of the capacity expansion problem, and a Limited Coordination assumption in which trade and transmission capacity are limited to 2020 levels. For emissions policy, we consider the Mitigation assumption in which carbon dioxide (CO2) emissions from the electricity system are reduced 90% relative to 2020 levels, and the Reference assumption in which emissions are assumed to be unconstrained. For wind turbine characteristics and solar tracking type, we vary the hourly capacity factors and capital costs of candidate wind and solar projects throughout the region at 0.5-degree resolution, considering assumptions from ten wind turbines and fixed vs. 1-axis solar tracking.
System costs and the benefits of coordination
We start by evaluating the system-wide costs of electricity decarbonization under a range of techno-economic uncertainties. Comparing Mitigation and Reference scenarios, Fig. 2a shows that across a range of technology assumptions and levels of coordination, decarbonization can be achieved with cost increases ranging from ~5 to 18%. Here, scenario technology assumptions in the choice of wind turbine and solar tracking drive the range of outcomes shown, and can make a significant difference in subsequent planning decisions. Full Coordination alleviates this cost burden of decarbonization (Fig. 2b), while also slightly reducing the overall uncertainty in the cost premium. Figure 2c disaggregates individual components of cumulative system costs, computed as differences between pairs of Mitigation scenarios that differ only by the coordination policy. These cost components are broken out from the Mitigation box in Fig. 2b, which in turn reflects the difference (on a cost basis) between the two boxes in Fig. 2a.
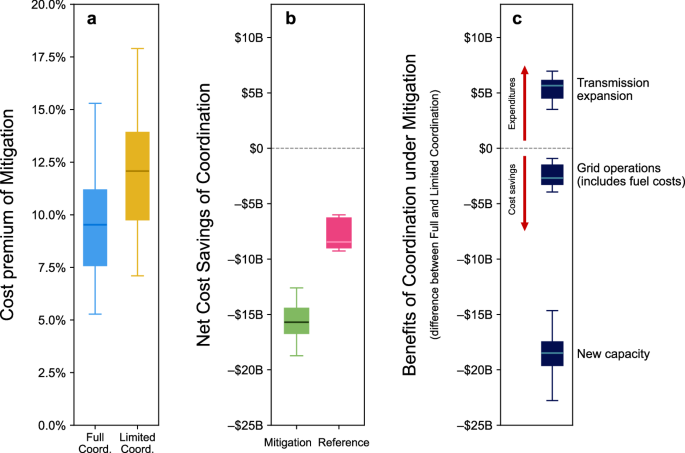
a Increase in cumulative total system costs (2020–2050) due to Mitigation (90% CO2 Cut), computed as the percent difference compared with the corresponding Reference scenarios, where the spread of the boxplots represents variability under the techno-economic assumptions for solar PV and onshore wind (40 data points in each box). Coord. stands for Coordination. b Net savings in cumulative total system costs due to Full Coordination, computed as the difference compared with the corresponding Limited Coordination scenarios (20 data points in each box). c Economic benefits of regional coordination under Mitigation, computed as differences in the three components of system costs between pairs of Mitigation scenarios which differ by coordination policy (20 data points in each box). The system costs consist of costs for building new generation capacity, grid operations (including fuel costs), and transmission expansion. Positive values indicate extra investments required under Full Coordination, while negative values indicate cost savings. Boxes span the interquartile range of the data, while whiskers span to the minimum and maximum.
Limiting coordination results in a net increase in total costs (sum of the individual components), primarily driven by the costs of newly installed capacity (Fig. 2c). This suggests an overbuilding of new generation capacity in limited coordination scenarios compared to allowing full and open trade (Supplementary Fig. 1). This capacity requires over triple the investment than the costs of expanding transmission capacity in Full Coordination scenarios (14.7–22.8 vs. 3.5–7.0 billion USD ($B)). Investment in new transmission capacity enables countries to access variable renewable resources in neighboring regions, allowing for potential cost savings through more optimal placement of wind and solar projects.
The reduced investment requirement for new generating capacity under Full Coordination is primarily due to the increased efficiency in grid balancing achieved by integrating a larger system of generators. Figure 3a shows the effect of Full Coordination on capacity investments under Mitigation. System-wide investment in new generating capacity is lower for most technologies under most conditions, except for fossil generators built mainly in Chile (as well as wind and hydropower for a few scenarios). Figure 3b shows differences in the generation mix in 2050 between Full and Limited Coordination scenarios, revealing a different trend: total wind generation tends to be substantially more under Full Coordination, even though investments in wind capacity tend to decrease. This system-wide trend comes mainly from new wind installations in Chile under Limited Coordination. These capacity additions are required to meet growing demands with zero-carbon energy and complement Chile’s diurnal solar generation, but have lower capacity factors than more productive sites in Argentina and Brazil. Even though solar PV is the dominant renewable resource in Chile, a point is reached at which the most favorable wind projects become economically viable compared with the remaining unbuilt solar PV sites (and the battery storage needed to complement them). Refer to Supplementary Figs. 1–4 for country-level outcomes.
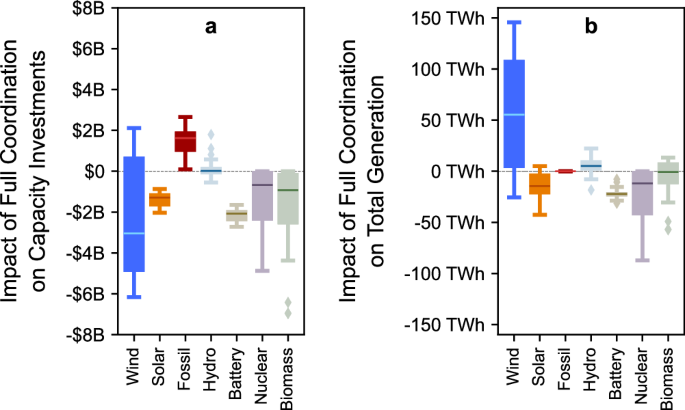
a New generation capacity investments by 2050. b Total generation in 2050. The spread of the boxplots represents variability under the techno-economic assumptions, while positive values indicate a metric that is greater under Full Coordination. Wind, solar PV, and fossil-based thermal generation (including all gas, coal, and diesel generators) are emphasized. Boxes span the interquartile range of the data, while whiskers span to the minimum and maximum.
Figures 2 and 3 show that under Mitigation and Limited Coordination, clean generating capacity is overbuilt to meet the emissions policy, which also results in more curtailment of the intermittent wind and solar (see Supplementary Fig. 4). This is supplemented only slightly by additional investments in battery storage, nuclear, and biomass, deployed in later periods. Higher curtailment and storage deployment reflect a relative deterioration in grid efficiency when limiting coordination; battery storage is deployed to mitigate this impact when economically viable. The temporal mismatch between intermittent generation (which increases under Mitigation) and demand on sub-daily scales can be dampened through a more efficient utilization of resources across a wider region, and by aggregating load from individual countries exhibiting different diurnal load profiles (see Supplementary Fig. 5). This reduces reliance on grid-scale battery storage, decreases total curtailment, and lowers the use of more expensive peaking plants to prevent supply shortfalls (see Supplementary Figs. 6 and 7). Electricity trade plays a critical role in facilitating this efficiency, which we evaluate in the next section.
Trade under a generation portfolio uncertainty
We find that Full Coordination facilitates a substantial increase in total bilateral electricity exchanges (Fig. 4a); Mitigation scenarios experience the largest growth in all but one interconnection (Argentina–Uruguay). This consistently higher trade with increased variability suggests that trade has a role in dampening cost burdens that may arise from techno-economic uncertainty and emissions policy, by enabling more efficient adoption of renewables. In other words, Full Coordination can facilitate emissions reduction by providing protection against techno-economic uncertainty and system-wide fluctuations in costs through investment in transmission expansion (Fig. 2 and Supplementary Fig. 8). In the case of Argentina–Uruguay, higher trade in Reference scenarios is mainly due to fossil fuel exports from Argentina providing reliable and low-cost grid balancing for Uruguay’s intermittent renewables in a few scenarios in which the future techno-economic characteristics of wind power are unfavorable (Supplementary Fig. 2). Under Mitigation, because emissions are a binding constraint, Uruguay installs more domestic renewable capacity to meet and balance its load, rather than importing it from larger countries.
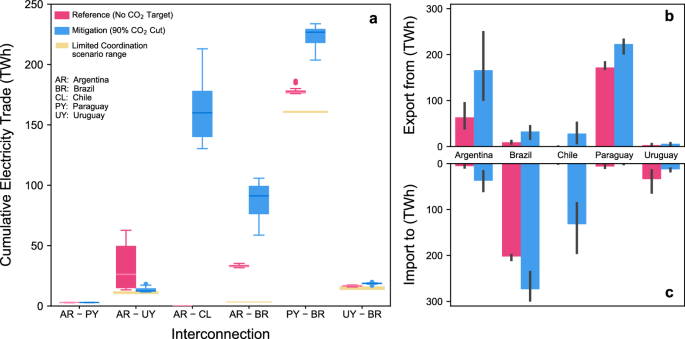
a Total trade from 2020 to 2050 in six modeled interconnections for Full Coordination scenarios. The country listed first in each axis label denotes the net exporter for each interconnection. Orange boxes show the range of values seen in Limited Coordination scenarios, which are not prohibited from electricity trade, but rather restricted to not exceed 2020 levels (some are zero and not shown). Boxplots show data between the 5th and 95th percentile, with outliers shown as dots. b Total exports from each country under Full Coordination. c Total imports to each country under Full Coordination. Uncertainty bars give the full range of outcomes across techno-economic scenarios.
Figure 4b, c shows each country’s cumulative exports and imports, respectively, for the 2020–2050 horizon. As the largest country, Brazil’s high demand and capacity additions (Supplementary Fig. 1) relative to other Mercosur countries proportionally drives system-level outcomes, even as it becomes increasingly reliant on imported power. Argentina and Paraguay are net exporters, with Paraguay continuing to export hydropower to Brazil. Hydropower, though shown to increase in nominal capacity over time, decreases in share in the system’s generation mix, suggesting a shift from a hydro-dominated system to a more balanced mix of complementary clean technologies (Supplementary Fig. 2). Still, no countries switch roles from net exporter to net importer (or vice-versa) across our scenarios. Argentina plays a central role in connecting and balancing the Mercosur grid, due not only to its size, central geographical position, and wind resource potential, but also its use of natural gas in complementing the growing share of renewables across the system, even as it is phased out over time under Mitigation. Thus, in addition to a heterogeneity in resources (including bridge fuels), more interconnections to neighboring load zones could help position Argentina to benefit from providing ancillary services to a regional grid.
The net exporters in this system under Mitigation and Full Coordination (Argentina and Paraguay, Fig. 4) experience higher total costs, due to the additional generating capacity installed to serve export demand (Supplementary Fig. 3). This cost increase does not reflect the revenue from the additional exports or ancillary services. Further, allocating the costs of building new transmission capacity between countries can impact relative outcomes; here, these costs are assumed to be shared equally by the two countries represented in each expanded interconnection. Additionally, increased investment in these countries for building export capacity is a favorable outcome for bringing high-quality jobs and spurring further domestic development, the value of which is left for future work to quantify. Brazil, on the other hand, must build new generating capacity mainly to meet its own demand growth, and increase reliance on imports from Paraguay and Argentina to dampen the overall cost burden from mitigation. Thus, while increased regional coordination can lower costs system-wide through grid balancing, countries capable of outpacing domestic demand growth with clean electricity deployment may capture additional economic benefits in a decarbonization policy environment.
For Chile, allowing Full Coordination under Mitigation increases newly installed fossil fuel generating capacity (Supplementary Fig. 1) and its overall generation share by 2050 (Supplementary Fig. 2). This suggests that a coordinated regional emissions policy optimizing for cost may also influence the siting of new fossil-based generators throughout the system. Such a shift in where fossil-based generation occurs, even under deep decarbonization, could have negative local environmental and health impacts not captured by the model33. Regarding the adoption of renewables, capturing Chile’s full potential for solar PV is particularly limited by the ability to integrate its diurnal variability into the larger grid. Because Chile’s wind potential is mostly concentrated in the far south of the country, far from existing transmission, its capacity expansion pathway under Mitigation relies on producing large amounts of solar during the day, while importing wind and hydropower from Argentina at night. Under Limited Coordination, Chile instead relies on battery storage to integrate its solar resources (Supplementary Fig. 4), and must supplement with wind capacity (Supplementary Fig. 1). Thus, through trade, Full Coordination can exploit the complementarity of diverse portfolios of renewables to smooth out seasonal and diurnal swings associated with resource intermittency (Supplementary Figs. 9 and 10); this in turn enables more strategic deployment of the most economic and highest-quality wind and solar resources throughout the region. However, although the system is able to manage increasing levels of solar generation through Full Coordination, countries deploying substantial solar PV capacity could become dependent on transnational electricity trade for balancing diurnal intermittency, especially under Mitigation (Supplementary Note 4). Additionally, without further cost declines in battery storage, we find significant amounts of solar generation could still be curtailed even under Full Coordination (Supplementary Figs. 4 and 5).
Uncertainty in renewables deployment
Mercosur’s future electricity portfolio is strongly tied to the presence of an emissions reduction policy, which shapes the uncertainty surrounding the deployment of different technologies. Further, a fully coordinated system seeking to decarbonize has a more flexible set of country-level pathways to choose from in order to manage techno-economic uncertainty. This, however, can heavily impact the optimal generator fleet at the country scale, adding to the relative uncertainty in a country’s infrastructure development pathway even while hedging against technological uncertainty system-wide. Examining this uncertainty in Fig. 5, we explore a measure of how the variability in a technology’s capacity share changes across our scenarios. We find that in almost all cases, both country-level and system-wide, Mitigation reduces deployment uncertainty associated with wind, solar PV, and hydropower (IQR ratio <1). In other words, a deep decarbonization policy greatly narrows the range of system-wide capacity outcomes for each of these generation technologies; however, the region-wide results do not consistently reflect any one country. Fossil plants do not exhibit this same pattern (Fig. 5d). Although these generators are dispatched much less under Mitigation, new reserve capacity is still built throughout the region, subject to the demands of different wind and solar PV technology characteristics. As such, system-wide capacity mix uncertainty is higher for fossil generators under Mitigation.
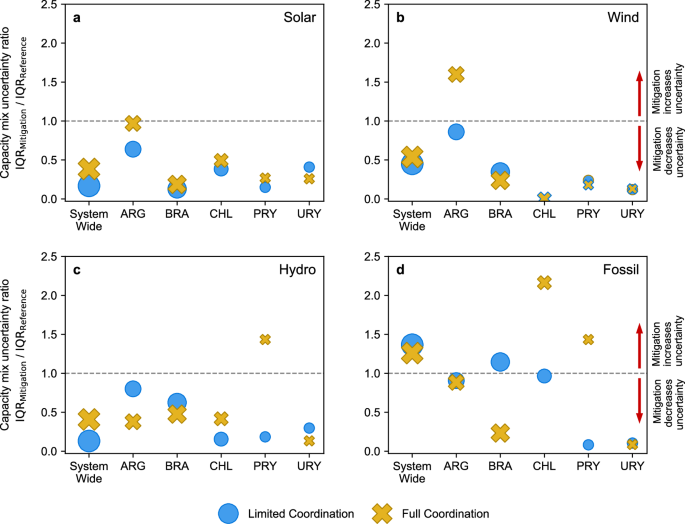
Panels show uncertainty ratios in the capacity share (fraction of total system capacity made up of each technology) for a solar; b wind; c hydropower; and d fossil fuel generators (gas, coal, diesel), for Mercosur and for individual countries. Values are computed as a ratio of the interquartile range (IQR) for Mitigation scenarios to the IQR of Reference scenarios; arrows describe the directions of change. In b the IQR ratio for Chile under Limited Coordination is undefined due to division by zero. Marker sizes correspond to each country’s relative size. A similar plot computing the IQR ratio between Full and Limited Coordination is shown in Supplementary Fig. 11. Countries shown are Argentina (ARG), Brazil (BRA), Chile (CHL), Paraguay (PRY), and Uruguay (URY).
In most cases under Full Coordination, the decarbonization policy drives more modest reductions or even increases in clean energy deployment uncertainty; the flexibility afforded by a larger interconnected system allows for a broader range of outcomes in the region’s capacity mix. One notable case is wind capacity uncertainty in Argentina (Fig. 5b), due to Argentina’s central balancing role in Mercosur, increasing its sensitivity to wind technology under Mitigation. Uncertainty in fossil fuel capacity under Full Coordination again shows less stability than other technologies, and country-level findings further diverge from the Limited Coordination scenarios (Fig. 5d). This further illustrates how policy levers and regional coordination can cause heterogeneous subregional impacts to emerge, but that the underlying techno-economic uncertainty driving grid outcomes can also be exacerbated or ameliorated across these scales.
Uncertainty in country-level capacity expansion decisions within a larger coordinated grid helps reveal how regional decarbonization pathways may evolve under uncertainty, and if key vulnerabilities or consistent burdens are experienced by particular countries. Full Coordination can allow individual countries undergoing deep decarbonization (i.e., Mitigation) to exploit more of the broader region’s highest-quality renewable resources (Supplementary Figs. 12 and 13) while utilizing trade for balancing intermittency and load patterns. For example, Chile, a country known for its excellent solar resource potential, must install some wind capacity to meet its Mitigation target under Limited Coordination, but deploys only solar PV under Full Coordination while Argentina and Paraguay invest more in wind (Supplementary Fig. 1). Regarding country-level emissions, the nature of the impacts of Full Coordination are again dependent on the presence of an emissions target (Supplementary Fig. 4, bottom row). Because Mitigation is implemented as a region-wide emissions cap, the emissions pathways are quite narrow when aggregated to the full system; however, individual countries show some variability. Thus, by developing cooperative strategies for the larger interconnected system, countries may be able to implement emissions reduction plans that are more cost-effective and robust to techno-economic uncertainties. At the same time, Full Coordination may not be able to spur emissions reduction on its own without further cost declines. Additional analysis in future work is needed to quantify and characterize the effects of different strategies.
Discussion
This study contributes a regional analysis with globally generalizable insights describing the opportunity and value of grid coordination in long-term regional electricity systems planning. We construct 80 future development pathways using GridPath-Mercosur, a five-node electricity system model co-optimizing generating capacity and transmission expansion decisions for the Mercosur region of South America. This framework extends previous analyses by combining broad spatiotemporal coverage with techno-economic uncertainty in variable renewable energy to examine implications of regional coordination (or a lack thereof) under a deep decarbonization policy target.
Region-wide, we find consistent and substantial benefits in planning and operating under Full Coordination, through increased electricity trade and unrestricted internodal transmission expansion. Under a deep decarbonization Mitigation target, a three-fold savings in new capacity costs is achieved through relatively modest investment in transmission expansion (Fig. 2). These savings are even greater when considering the further reduction in grid operating costs (which includes fuel costs). In addition to reducing the cost premium of decarbonizing, Full Coordination also decreases uncertainty in total system costs (Fig. 2a). Through open electricity trade between countries (Fig. 4, Supplementary Fig. 9), regional coordination provides flexibility to respond to regional advantages and disadvantages in resource utilization, which hedges against technological uncertainty in the energy transition. Future work could examine the capital cost or duration of storage technologies to explore where the economic viability of storage competes with the benefits of coordination in facilitating a low-carbon energy transition. Further, the Mitigation target in this work represents just one possible emissions trajectory for this system; additional modeling efforts are needed to explore alternative pathways in more detail, including countries’ Nationally Determined Contributions as well as economy-wide and non-CO2 emissions reductions.
Although region-wide intermittencies and uncertainty in variable renewable energy technology may be mitigated through coordination, benefits to the region can be distributed differently among the five constituent countries, due to their relative size, advantages in natural resource availability, and modeled technology characteristics. Uncertainty surrounding the relative deployment of various generation technologies (and thus the economic development) varies across countries and policy environments (Fig. 5). In other words, differences in installed wind and solar PV capacities in each country tend to offset region-wide, but different countries may stand to benefit or sacrifice across scenarios. These benefits may emerge as gains in both short- and long-term employment, reduction in local air pollution, and a greater ability to attract private capital investments. Thus, when planning a Mercosur-wide electricity decarbonization pathway, balancing country-level impacts must be considered in relation to the system-wide benefits of coordination and increased trade34.
Internationally coordinated grid planning, with diverse objectives beyond cost minimization, must navigate deep uncertainties and competing interests among stakeholders. Increasing overall electricity trade to target a smaller number of only the highest-quality renewables sites relies on developing, maintaining, and using an expanded transmission network to realize the full benefits. A multinational electricity grid designed for cooperative international trade may experience notable negative effects if there are barriers to transmission expansion or transnational electricity trade (Supplementary Note 4). These potential risks, including substantial levels of unmet demand, curtailment, and stranded assets, suggest that Full Coordination could increase participating countries’ energy dependence on each other. This effect may be especially troublesome for net importers but could be mitigated through a cap on imports or requiring domestic reserve margins. Future work could explore the impacts of being locked into an integrated system in terms of countries’ relative bargaining power. Additionally, calculations of unmet demand and curtailment are first-order estimates, owing to the aggregated representation of the transmission network, load centers, and distribution of storage capacity within countries. This aggregation omits detailed subnational treatment of physics-constrained power flows and the spatial siting of storage, which could contribute to over- or underestimation of country-specific reliability outcomes. However, though the transmission topology is simplified, a detailed map of existing lines is used as a cost adder for potential project sites (Supplementary Fig. 14). Using the spatial distribution of favorable wind and solar PV project sites, future work could incorporate additional detail into the transmission topology to explore occurrences of, e.g., finer-scale locational marginal prices, the grid value of storage, or transmission bottlenecks35. This added detail could be especially important for exploring a future buildout of offshore wind generation, which we do not consider here. In areas like northeastern Brazil, integrating abundant offshore wind potential could reduce the country’s reliance on electricity imports in the future.
Geopolitical relations and governance among Mercosur countries, though outside the scope of this work, could significantly impact the feasibility of full and open electricity trade on an expanded transmission network36. The five countries considered here each operate under slightly different market structures and system operators, including a mix of public and private entities controlling the generation, transmission, and distribution systems (Supplementary Table 5). Existing compensation structures, such as benefit-sharing, transaction costs, and congestion revenues, may disincentivize trade or create institutional or regulatory barriers to cooperation37,38. The decision of how to allocate the costs of new transmission lines between countries could further complicate matters39. These and other issues make the political and regulatory environment a critical driver of the feasibility of coordination40. Recent work analyzing African power pools similarly advocates to “mitigate non-cooperative strategies … and incentivise a shift in national agendas to build confidence in regional trade”21. However, the institutional complexities related to cooperative planning are beyond the scope of this study, which seeks to quantify the relative benefits of coordination and, in this context, characterize techno-economic uncertainties in a decarbonizing power system. Thus, we do not include institutional friction or other barriers to coordination; Supplementary Table 5 and Supplementary Note 4 provide additional discussion and analysis around the regional context and potential institutional vulnerabilities.
Our results can provide insights relevant to other regions seeking to achieve emissions reduction goals with potential opportunities for regional coordination with neighboring grids, especially grids that may be early on in their energy transition or simultaneously working to expand energy access. System planners in these situations can benefit from using the framework described here to assess potential advantages and disadvantages of increased regional grid coordination. The Mercosur region of South America, though already operating a relatively clean electricity system, will still need additional renewables deployment to reduce current emissions levels and avoid future emissions. We show that regional coordination of the electricity system provides substantial economic benefits through more efficient capacity deployment and grid operations, benefits which accrue differently to individual countries but are economically advantageous to all. If potential energy dependence can be cost-effectively mitigated and political feasibility successfully navigated, aggregating regional grids such as South America’s southern cone could become building blocks of larger synchronous grids, spanning the continent and beyond.
Methods
Electricity system modeling framework
We apply an open-source modeling framework developed in ref. 30 using the electricity system modeling platform GridPath41, informed by spatially resolved, time-varying potentials of wind, solar, and hydropower. GridPath-Mercosur, used in this study, solves five-year time steps from 2020 to 2050, using 2020 as a historical calibration baseline. The model co-optimizes capacity investment decisions for generation, storage, and transmission infrastructures, as well as grid operation, which is simulated for 288 representative month-hourly time-slices for each model year. We represent the Mercosur study region with a single demand node for each of the five countries, interconnected by bilateral high-voltage transmission lines. All generation resources within each country are connected to its respective demand node, aligned with some real-world practices of accessing geographically distributed resources at the national level. However, we do not incorporate the costs and losses for intra-country transmission systems. By varying model parameters and operating conditions to construct an ensemble of scenarios, this framework is used to explore the value of full regional coordination under a stringent emissions reduction target and techno-economic uncertainty in wind turbines and solar PV. We use the outputs of 80 unique model realizations to assess the resulting variability in system-wide and country-level costs, as well as the new generation and transmission capacity required to meet emissions goals. GridPath is written in Python and uses Gurobi as the solver.
Capacity expansion
The capacity expansion problem in GridPath is constructed as a mixed-integer linear program (MILP), which optimizes all infrastructure investments (i.e., generating capacity, storage capacity, and cross-border transmission) to meet demand at the lowest cost, subject to, e.g., reserve requirements, emissions constraints, and planned retirements. The total cost is computed as a net present value, which sums both capital and operating (including fuel) costs over the model horizon. Dispatchable thermal generating capacity is selected by the model at the country scale, while wind and solar capacity are chosen from among spatially distributed project sites of different quality and potential capacity. Hydropower deployment similarly uses spatially distributed project sites but is based on a binary decision to build (or not), rather than a variable amount of capacity being chosen. Key outputs include new capacity costs, capacity mix, and transmission investments. Other input data, including historical load, demand growth rates, existing generation capacity, technology capital costs, and existing cross-border transmission capacity, are obtained following ref. 30.
Hourly grid operations
For each of seven model periods, electricity is cost-optimally dispatched to meet each node’s demand for 288 representative month-hourly time-slices throughout a year (24 h × 12 months); each time-point contains the average demand for that month-hour and is weighted by the number of days in each month to construct a full year of operation. Similarly to country-level demand, energy supply from wind and solar PV is determined by the month-hourly average at each spatially distributed site. Peak demand is addressed via a 15% planning reserve margin, constrained to be supplied primarily by dispatchable generators. Dispatchable generators are subject to various constraints and operating characteristics; these include heat rates and ramping limits, as well as seasonal and/or daily energy availability (for hydropower and battery storage). Key outputs include total operating costs, generation mix, trade, and emissions.
Wind and solar PV
An added advantage of the model is the spatiotemporal resolution of variable renewable energy potential and project sites, which vary capacity factor and installation costs of candidate wind and solar PV projects throughout the region and according to modeled technology characteristics. Potential sites for wind and solar PV capacity deployment are estimated at 0.5-degree resolution (roughly 55 km) throughout the study period and described by the technical potential available within each site42, less any existing capacity located there43. The technical potential represents a maximum total capacity of wind and solar PV that is suitable to be built within each grid cell, following ref. 42. It can be interpreted as a percentage of each grid cell on which a project could be built based on land competition, excluding the fractions of each grid cell covered by, e.g., environmentally sensitive areas, protected areas, and water bodies, and further derated by availability factors of aggregated land cover types. An additional constraint sets the potential to be zero if the fraction of a grid cell covered by protected areas is greater than 15%. These technical potentials are initial upper limits on buildout potential, from which existing installations are subtracted (using ref. 43) to obtain the maximum technical potentials used to constrain the model. To improve computational tractability, high-quality sites were pre-selected from the full set to include in the model, resulting in a total of 978 wind and 1650 solar PV sites, each with a minimum of 50 MW capacity potential and 10% average annual capacity factor (Supplementary Table 7, Supplementary Figs. 15 and 16). For each gridded site, historical hourly capacity factors were obtained using Renewables.ninja44,45, which uses the Modern-Era Retrospective analysis for Research and Applications, Version 2 (MERRA-2) bias-corrected reanalysis data of solar irradiance, temperature, and wind speed to simulate the power output of wind and solar PV and calibrate it against historical power output at specific sites with empirically derived bias correction factors. Their calibration starts by spatially interpolating gridded satellite data to the coordinates of existing solar PV and wind farms. For solar44, power output is simulated by first computing in-plane irradiance, taking the tilt angle and solar tracking configuration as inputs and accounting for temperature-dependent efficiency loss and inverter losses. For wind45, power output is simulated using the turbine’s power curve and hub height, provided as inputs by specifying the turbine model. The reference scenario in ref. 30, for example, uses single-axis solar tracking and a tilt angle equal to latitude for solar PV, and a 100 m hub height Vestas V90 2 MW turbine for wind. We obtained historical, technology-specific hourly capacity factor data for each high-quality site we identified, in order to construct month-hourly time series of energy availability for use with GridPath. By replicating these steps for ten different wind turbines and two solar PV types over each potential site, we produced a suite of model inputs with which to construct our scenario ensemble. We estimate capital costs using available aggregate data (Supplementary Table 6), which is scaled to the cost trajectory of the reference case in ref. 30, as specific wind turbine cost data is not generally reported publicly. The combination of month-hourly resource potential, capital cost, and distance to the nearest transmission line describes the spatially resolved wind and solar PV sites available in the model. Although new transmission lines and flows within a country are not modeled, the distance from wind and solar PV projects to the nearest existing line is used to further inform site feasibility by computing a levelized cost of installing new lines, as a cost adder to the project’s overnight capital cost. Note that only onshore wind is considered in this study. The Mercosur region has strong offshore wind potential (especially off of Brazil’s northeastern coast46), which could be a promising source of renewable electricity in the future. However, available onshore wind potential was not a limiting factor in our capacity expansion scenarios. The inclusion of offshore wind is left to future work.
Hydropower
Future expansion of hydropower is constrained to choosing only from a set of projects based on ref. 47. Like wind and solar PV, only projects with a minimum of 50 MW capacity are made available to the model (leaving 201 total candidate projects), which covers over 90% of the total planned hydropower capacity in the region. The seasonality of hydropower production is incorporated following the methodology in ref. 30 and summarized here. The inputs to GridPath are monthly hydropower availabilities estimated using the global hydrologic model Xanthos48, which is forced with the WATCH Forcing Data methodology applied to ERA-Interim data (WFDEI) bias-corrected reanalysis dataset49. The resulting monthly historical hydropower simulations are used to estimate average monthly capacity factors for existing hydropower plants in the Mercosur region. These monthly capacity factors are assumed to be stationary and do not change over time. Note that for planned (future) hydropower projects, capacity factors are estimated using the capacity factors of the nearest existing hydropower facility within the same river basin. Hourly hydropower generation is dispatched by the model subject to these seasonal capacity factors.
Scenario ensemble
The highest-quality wind and solar resources in Mercosur do not always form the most economically attractive projects, as particular areas may be protected, inaccessible, far from existing transmission, or crowded out by existing projects42. The technical potential of these resources is also subject to the characteristics of the technologies themselves, i.e., the power curve of a wind turbine or the solar tracking technology. Under regional coordination of the electricity grid, the locations of the best (most economical) candidate wind and solar PV projects may change and even cross international borders due to this uncertainty, affecting the trade dynamics of the system. As more renewable electricity capacity is built to meet decarbonization plans, the uncertainty in potential capacity expansion outcomes grows. Table 1 describes the 80-member scenario ensemble developed to explore this uncertainty, which configures GridPath-Mercosur along four dimensions: level of regional electricity coordination, mid-century emissions policy, solar tracking type, and wind turbine characteristics.
The mid-century emissions policy achieves a 90% reduction in the annual CO2 emitted by the electricity system between 2020 and 2050; this policy is compared with a Reference case with no CO2 emissions target. The Mitigation (90% CO2 Cut) case represents a deep decarbonization scenario generally consistent with reaching established end-of-century mitigation targets50, for which net-zero is achieved shortly after 2050. Specifically, in our scenarios, Mitigation represents a reduction from roughly 100MtCO2 to 10MtCO2 in annual emissions over the model horizon; the Reference case is a counterfactual representing a lack of abatement policy. The level of coordination in each realization is modeled as either Full Coordination (transnational interconnection expansion is co-optimized in the capacity expansion problem; electricity trade is unrestricted) or Limited Coordination (no new investment in transmission interconnections; gross electricity trade cannot exceed 2020 levels). Thus, the level of coordination represents both a willingness to invest in transmission and the overcoming of institutional barriers preventing increased trade. Wind and solar PV technology characteristics are used to estimate spatially resolved hourly capacity factors of candidate wind and solar projects throughout the region at 0.5-degree resolution45,46, and to estimate project-specific capital costs51. Two types of solar tracking technology are included (Fixed vs. 1-axis tracking); the tradeoff between cost, efficiency, and land requirement among solar tracking technologies has been broadly identified in the literature, with individual case studies differing in their optimal selection of solar tracking type depending on the local context52,53,54. Similarly, wind turbine output is also technology-specific and dependent on characteristics such as hub height and the turbine’s swept area. Here, we include hourly capacity factors of ten wind turbines to explore cost-performance tradeoffs. Refer to Supplementary Tables 6 and 7 for further details.
Data availability
The scenario outputs generated in this study have been deposited in Zenodo55. Model input data and processed model output data, which can be used to fully reproduce all analyses presented in this research, have been deposited in Zenodo56. The data used to generate the figures in this study are provided in the Source Data file.
Code availability
GridPath is an open-source model accessible at https://doi.org/10.5281/zenodo.5822994; the version utilized in this work is located at https://github.com/blue-marble/gridpath/releases/tag/v0.8.1. All original code for data processing, analysis, figure generation, and reproducing the experiment is available in the meta-repository56.
References
Clarke, L. et al. Energy systems. In IPCC 2022 Climate Change 2022 - Mitigation of Climate Change: Working Group III Contribution to the Sixth Assessment Report of the Intergovernmental Panel on Climate Change https://doi.org/10.1017/9781009157926.008 (Cambridge Univ. Press, 2022).
Sachs, J. D. et al. Six Transformations to achieve the Sustainable Development Goals. Nat. Sustain. 2, 805–814 (2019).
Luss, H. Operations research and capacity expansion problems: a survey. Oper. Res. 30, 907–947 (1982).
Stanton, M. C. B. & Roelich, K. Decision making under deep uncertainties: a review of the applicability of methods in practice. Technol. Forecast. Soc. Chang. 171, 120939 (2021).
Fodstad, M. et al. Next frontiers in energy system modelling: a review on challenges and the state of the art. Renew. Sustain. Energy Rev. 160, 112246 (2022).
Blair, N., Zhou, E. & Getman, D. Electricity Capacity Expansion Modeling, Analysis, and Visualization: A Summary of Selected High-Renewable Modeling Experiences. https://www.nrel.gov/docs/fy16osti/64831.pdf (2015).
Mulugetta, Y. et al. Africa needs context-relevant evidence to shape its clean energy future. Nat. Energy 7, 1015–1022 (2022).
Tröndle, T., Lilliestam, J., Marelli, S. & Pfenninger, S. Trade-offs between geographic scale, cost, and infrastructure requirements for fully renewable electricity in Europe. Joule 4, 1929–1948 (2020).
Bowen, B. H., Sparrow, F. T. & Yu, Z. Modeling electricity trade policy for the twelve nations of the Southern African Power Pool (SAPP). Util. Policy 8, 183–197 (1999).
Remy, T. & Chattopadhyay, D. Promoting better economics, renewables and CO2 reduction through trade: a case study for the Eastern Africa Power Pool. Energy Sustain. Dev. 57, 81–97 (2020).
Wu, G. C. et al. Strategic siting and regional grid interconnections key to low-carbon futures in African countries. Proc. Natl. Acad. Sci. USA 114, E3004–E3012 (2017).
Brown, P. R. & Botterud, A. The value of inter-regional coordination and transmission in decarbonizing the US Electricity System. Joule 5, 115–134 (2021).
Guo, F. et al. Implications of intercontinental renewable electricity trade for energy systems and emissions. Nat. Energy 7, 1144–1156 (2022).
Moret, S., Gironès, C. V., Bierlaire, M. & Maréchal, F. Characterization of input uncertainties in strategic energy planning models. Appl. Energy 202, 597–617 (2017).
Yue, X. et al. A review of approaches to uncertainty assessment in energy system optimization models. Energy Strategy Rev. 21, 204–217 (2018).
Santos da Silva, S. R. et al. The implications of uncertain renewable resource potentials for global wind and solar electricity projections. Environ. Res. Lett. 16, 124060 (2021).
Schyska, B. U., Kies, A., Schlott, M., von Bremen, L. & Medjroubi, W. The sensitivity of power system expansion models. Joule 5, 2606–2624 (2021).
Haller, M., Ludig, S. & Bauer, N. Decarbonization scenarios for the EU and MENA power system: considering spatial distribution and short term dynamics of renewable generation. Energy Policy 47, 282–290 (2012).
Poncelet, K., Delarue, E., Six, D., Duerinck, J. & D’haeseleer, W. Impact of the level of temporal and operational detail in energy-system planning models. Appl. Energy 162, 631–643 (2016).
Mallapragada, D. S., Papageorgiou, D. J., Venkatesh, A., Lara, C. L. & Grossmann, I. E. Impact of model resolution on scenario outcomes for electricity sector system expansion. Energy 163, 1231–1244 (2018).
Elabbas, M. A. E., de Vries, L. & Correljé, A. African power pools and regional electricity market design: taking stock of regional integration in energy sectors. Energy Res. Soc. Sci. 105, 103291 (2023).
Sasse, J.-P. & Trutnevyte, E. A low-carbon electricity sector in Europe risks sustaining regional inequalities in benefits and vulnerabilities. Nat. Commun. 14, 2205 (2023).
Rinne, E., Holttinen, H., Kiviluoma, J. & Rissanen, S. Effects of turbine technology and land use on wind power resource potential. Nat. Energy 3, 494–500 (2018).
Caglayan, D. G. et al. The techno-economic potential of offshore wind energy with optimized future turbine designs in Europe. Appl. Energy 255, 113794 (2019).
McCalley, J. & Zhang, Q. Macro Grids in the Mainstream: An International Survey of Plans and Progress. https://cleanenergygrid.org/macro-grids-mainstream/ (Americans for a Clean Energy Grid, 2020).
Santos da Silva, S. R. et al. Power sector investment implications of climate impacts on renewable resources in Latin America and the Caribbean. Nat. Commun. 12, 1276 (2021).
Wessel, J., Kern, J. D., Voisin, N., Oikonomou, K. & Haas, J. Technology pathways could help drive the U.S. West Coast Grid’s exposure to hydrometeorological uncertainty. Earths Future 10, e2021EF002187 (2022).
Siala, K., Chowdhury, A. K., Dang, T. D. & Galelli, S. Solar energy and regional coordination as a feasible alternative to large hydropower in Southeast Asia. Nat. Commun. 12, 4159 (2021).
Timilsina, G., Deluque Curiel, I. & Chattopadhyay, D. How Much Does Latin America Gain from Enhanced Cross-Border Electricity Trade in the Short Run?. https://doi.org/10.1596/1813-9450-9692 (The World Bank, 2021).
Chowdhury, A. F. M. K., Wessel, J., Wild, T., Lamontagne, J. & Kanyako, F. Exploring sustainable electricity system development pathways in South America’s MERCOSUR sub-region. Energy Strategy Rev. 49, 101150 (2023).
MERCOSUR. MERCOSUR in brief. MERCOSUR https://www.mercosur.int/en/about-mercosur/mercosur-in-brief/ (2024).
IEA. Latin America Energy Outlook 2023 https://doi.org/10.1787/fd3a6daa-en (2023).
Huang, X., Srikrishnan, V., Lamontagne, J., Keller, K. & Peng, W. Effects of global climate mitigation on regional air quality and health. Nat. Sustain. 6, 1054–1066 (2023).
Yarlagadda, B. et al. Trade and Climate mitigation interactions create agro-economic opportunities with social and environmental trade-offs in Latin America and the Caribbean. Earths Future 11, e2022EF003063 (2023).
Cao, K.-K., Metzdorf, J. & Birbalta, S. Incorporating power transmission bottlenecks into aggregated energy system models. Sustainability 10, 1916 (2018).
Wang, C.-N., Nguyen, H.-K. & Nhieu, N.-L. Integrating prospect theory with DEA for renewable energy investment evaluation in South America. Renew. Energy 247, 123018 (2025).
Stoilov, D., Dimitrov, Y. & François, B. Challenges facing the European power transmission tariffs: The case of inter-TSO compensation. Energy Policy 39, 5203–5210 (2011).
Stoilov, D. & Stoilov, L. Improving inter-transmission compensation in EU. Energy Policy 62, 282–291 (2013).
Chen, Z. et al. Overview of transmission expansion planning in the market environment. Energy Rep. 8, 662–670 (2022).
Ochoa, C., Dyner, I. & Franco, C. J. Simulating power integration in Latin America to assess challenges, opportunities, and threats. Energy Policy 61, 267–273 (2013).
Mileva, A. et al. blue-marble/gridpath: GridPath v0.14.1. Zenodo https://doi.org/10.5281/zenodo.6678436 (2022).
Gonzalez-Salazar, M. & Poganietz, W. R. Evaluating the complementarity of solar, wind and hydropower to mitigate the impact of El Niño Southern Oscillation in Latin America. Renew. Energy 174, 453–467 (2021).
Dunnett, S., Sorichetta, A., Taylor, G. & Eigenbrod, F. Harmonised global datasets of wind and solar farm locations and power. Sci. Data 7, 130 (2020).
Pfenninger, S. & Staffell, I. Long-term patterns of European PV output using 30 years of validated hourly reanalysis and satellite data. Energy 114, 1251–1265 (2016).
Staffell, I. & Pfenninger, S. Using bias-corrected reanalysis to simulate current and future wind power output. Energy 114, 1224–1239 (2016).
Gorayeb, A. et al. Emerging challenges of offshore wind energy in the Global South: Perspectives from Brazil. Energy Res. Soc. Sci. 113, 103542 (2024).
Zarfl, C., Lumsdon, A. E., Berlekamp, J., Tydecks, L. & Tockner, K. A global boom in hydropower dam construction. Aquat. Sci. 77, 161–170 (2015).
Vernon, C. R. et al. A global hydrologic framework to accelerate scientific discovery. J. Open Res. Softw. 7, 1 (2019).
Weedon, G. et al. The WFDEI meteorological forcing data. UCAR/NCAR - Research Data Archive https://doi.org/10.5065/486N-8109 (2018).
Kikstra, J. S. et al. The IPCC Sixth Assessment Report WGIII climate assessment of mitigation pathways: from emissions to global temperatures. Geosci. Model Dev. 15, 9075–9109 (2022).
NREL. 2019 Annual Technology Baseline. https://atb-archive.nrel.gov/electricity/2019/about.html (2019).
Bahrami, A. & Okoye, C. O. The performance and ranking pattern of PV systems incorporated with solar trackers in the northern hemisphere. Renew. Sustain. Energy Rev. 97, 138–151 (2018).
Honrubia-Escribano, A. et al. Influence of solar technology in the economic performance of PV power plants in Europe. A comprehensive analysis. Renew. Sustain. Energy Rev. 82, 488–501 (2018).
Vaziri Rad, M. A., Toopshekan, A., Rahdan, P., Kasaeian, A. & Mahian, O. A comprehensive study of techno-economic and environmental features of different solar tracking systems for residential photovoltaic installations. Renew. Sustain. Energy Rev. 129, 109923 (2020).
Wessel, J. et al. Model outputs associated with Mercosur regional coordination. Zenodo https://doi.org/10.5281/zenodo.15096838 (2025).
Wessel, J. Processed data and code repository for Mercosur regional coordination: LamontagneLab/wessel_et_al_mercosur_2025. Zenodo https://doi.org/10.5281/zenodo.16429355 (2025).
Acknowledgements
This material is based upon work supported by the National Science Foundation under Grant No. 1855982. The authors acknowledge the Tufts University High Performance Compute Cluster (https://it.tufts.edu/high-performance-computing), which was utilized for the research reported in this paper. T.W. and G.I. are also affiliated with Pacific Northwest National Laboratory, which did not provide specific support for this paper.
Ethics declarations
Competing interests
The authors declare no competing interests.
Peer review
Peer review information
Nature Communications thanks Milad Shadman and the other anonymous reviewer(s) for their contribution to the peer review of this work. A peer review file is available.
Additional information
Publisher’s note Springer Nature remains neutral with regard to jurisdictional claims in published maps and institutional affiliations.
Supplementary information
Rights and permissions
Open Access This article is licensed under a Creative Commons Attribution-NonCommercial-NoDerivatives 4.0 International License, which permits any non-commercial use, sharing, distribution and reproduction in any medium or format, as long as you give appropriate credit to the original author(s) and the source, provide a link to the Creative Commons licence, and indicate if you modified the licensed material. You do not have permission under this licence to share adapted material derived from this article or parts of it. The images or other third party material in this article are included in the article’s Creative Commons licence, unless indicated otherwise in a credit line to the material. If material is not included in the article’s Creative Commons licence and your intended use is not permitted by statutory regulation or exceeds the permitted use, you will need to obtain permission directly from the copyright holder. To view a copy of this licence, visit http://creativecommons.org/licenses/by-nc-nd/4.0/.
About this article
Cite this article
Wessel, J., Chowdhury, A.K., Wild, T. et al. Regional coordination can alleviate the cost burden of a low-carbon electricity system. Nat Commun 16, 9033 (2025). https://doi.org/10.1038/s41467-025-64093-8
Received: 22 April 2025
Accepted: 08 September 2025
Published: 10 October 2025
DOI: https://doi.org/10.1038/s41467-025-64093-8