.png)

Adding up the weight of very different materials doesn’t tell us about their scarcity, environmental, or socioeconomic impacts.
What do a tonne of potatoes, gravel, coal, and copper have in common? Not much, except that they all weigh the same, and are treated exactly the same in a metric called the “material footprint”.
The material footprint sums up the weight of all the resources used within an economy. So if a country’s material footprint is 60 million tonnes, it extracts 60 million tonnes of “stuff” per year. This includes both non-renewable resources like metals and fossil fuels, and “renewable” ones like crops and wood. The scarcity or environmental impact of different resources is not considered, so every kilogram of stuff is considered just as important as every kilogram of something else.1
Some readers may not be familiar with this metric, but it has gained increasing popularity in environmental discussions and international policy. It’s included as a key metric in the United Nations’ Sustainable Development Goals, which is why we have charts on it in our SDG Tracker. This metric is tracked in per capita terms and is shown in the chart below.
It is also used in the planetary pressures index by the UN Development Programme, and you’ll find many reports on it by the OECD, European agencies, and others.2
However, for reasons I’ll explain in this article, I don’t find this metric helpful in understanding the sustainability of resource use or its environmental impacts. I fear that rather than helping us tackle some of our biggest environmental and resource challenges, it obscures our understanding and takes our focus away from the most pressing problems.

There are at least three reasons why we should be measuring and monitoring our resource use:
- To see if we risk running out of a particular resource. If we’ve depleted the world’s copper, cobalt, or lithium and are at risk of running out, then we need to know about it. But to assess this, we need to know how much of that specific material we’re using, and how much is left. We’d need to know how much copper, cobalt, or lithium we use each year and the state of our global reserves. To do that, we need to look at specific mineral datasets (which exist and are published by organizations such as the US Geological Survey or British Geological Survey). We have a lot of this data on Our World in Data. This is also true for “natural” ecosystems or populations we’re depleting. If we’re concerned about the depletion of Atlantic bluefin tuna, we must look at how much of that population or species we’re catching, how many are left, and how quickly populations regenerate. Our team also shows this data on fish catch and depletion for specific species. Looking at a metric that throws the weight of tuna together with wood, coal, and gravel does not help understand the scarcity of any of them.
- To measure the environmental impact of extracting and consuming resources. Mining uses land, can disrupt landscapes, and cause pollution. Burning fossil fuels generates carbon emissions and air pollution. Beef production can drive deforestation and biodiversity loss. These impacts are extremely important to monitor (we cover most, if not all, of them here on Our World in Data). But material footprints don’t tell us much about the environmental impact. The production of a tonne of gravel does not have the same impact as a tonne of uranium or pork.
- To measure the socioeconomic consequences of extracting and consuming resources. Mining can be associated with unsafe working practices, and some supply chains rely on exploitative labor. But, again, the material footprint does nothing to help us identify and improve these conditions. Cobalt and gold mining are associated with poor working conditions in countries like the Democratic Republic of Congo, but material footprints don’t tell us that. In fact, many of these precious minerals are extracted in relatively small quantities, so they barely show on a whole-economy material footprint. Some of the most documented exploitative practices have been in textile supply chains. In terms of material footprint, clothing has a very low “material intensity”, so judging by this metric, it would be deemed a more “responsible” way to spend your money.
Resource use does matter for these reasons, but the material footprint, at best, captures them poorly and, at worst, hides some of the most negative impacts.
The chart below shows the breakdown of the European Union's material footprint. More than 70% is made up of biomass (our food and wood for industry and construction) and non-metallic minerals for construction and infrastructure.
This should already raise some questions.
Biomass is a renewable resource (if managed sustainably). I can grow and harvest potatoes, tomatoes, and wheat today and then replant them for next year. The “net” change in the biomass we produce is often zero over longer timescales; it’s not being depleted like other resources. To compare this in terms of weight to fossil fuels and other minerals, which are not renewable, mixes materials that are too different to be bundled together.
Non-metallic minerals, such as gravel — which dominate Europe’s footprint — do not have zero environmental impact. Mining for materials such as sand can disrupt ecosystems, disturb riverbeds, and affect natural flood defenses. However, they tend to have a much lower environmental impact than the other categories. As the European Environment Agency puts it:
“Non-metallic minerals account for a large part of the total material footprint, yet they have less environmental and climate impact than metals and fossil fuels. This is because they are mostly composed of inert materials such as gravel, limestone.”
If we consider a large material footprint problematic, then it follows that we should focus on using less sand, gravel, wood, and limestone. However, this would achieve far less in addressing most of the resource constraints and environmental and social impacts that we care about than tackling other (smaller) categories like fossil fuels and particular metal ores.
Since non-metallic minerals and biomass dominate the EU’s material footprint, we shouldn’t be surprised that housing and food have the biggest impact when we look at the footprint by the end-use sector.
The chart below shows this breakdown: more than half (52%) of the total footprint is linked to housing, and 19% to food. These two sectors alone account for almost three-quarters of the material footprint. Again, most of this is from non-metallic minerals like gravel and sand, and biomass for food (mostly crops).
A lot of the things some might classify as “non-essential” goods, such as cars, stuff we buy for our homes, and clothing, are small by comparison.3
It’s interesting to read the European Environment Agency’s analysis of what this breakdown means for policy and action.
On housing, the agency states:
“The very high material footprint of housing means that no significant reduction in the EU’s material footprint can be achieved without addressing our built environment. On the other hand, the environmental benefit from avoiding extraction of non-metallic minerals is relatively small.”
So, to substantially reduce our material footprint, we need to rethink our homes — maybe the materials we use to build or their size — but the environmental benefits of doing so are pretty small. Again, that raises the question of why we would make this the focal point of action if there are few benefits.
On food, the policy implications are also unclear:
“The potential for a radical reduction of the food sector’s material footprint is rather low as it is composed of food items essential to our societies. However, dietary shifts and the management of food waste can contribute to reducing the food sector’s material footprint”.
We need food to eat, so substantially cutting back is hard. The two obvious proposals are reducing food waste and shifting to more plant-based diets (less material-intensive, because you don’t have to produce food for the animals first). These are both strong recommendations that I have written a lot about before.
But what’s crucial is that there is already a long list of reasons why we would want to make these changes: the fact that food is responsible for up to one-third of the world’s greenhouse gas emissions; that it uses half of the world’s habitable land; that it’s the leading driver of water use, water pollution, biodiversity loss, and deforestation; and the fact that we raise and slaughter more than 70 billion land animals for food every year. All these problems can be improved by shifting to more plant-based diets and reducing food waste.
Of all the arguments to make this shift, the “material footprint” is the least convincing. When it comes to sustainability, it’s much less obvious why I should care more about the weight of the amount of wheat, corn, or lentils we grow than I do about the ecosystems destroyed, forests cut down, animals raised under cruel conditions, or the rivers polluted.
A common explanation for measuring material footprints is that many of us overconsume and need to do so less. On a personal level, I am also very conscious of my consumption. I think carefully about what I buy and its impact. I still wear clothes that are many, many years old, and I hold on to my mobile phone for as long as I can.
When I speak to others about this, they often mention the same items and industries: consumer technology and “fast fashion” are always in the spotlight.
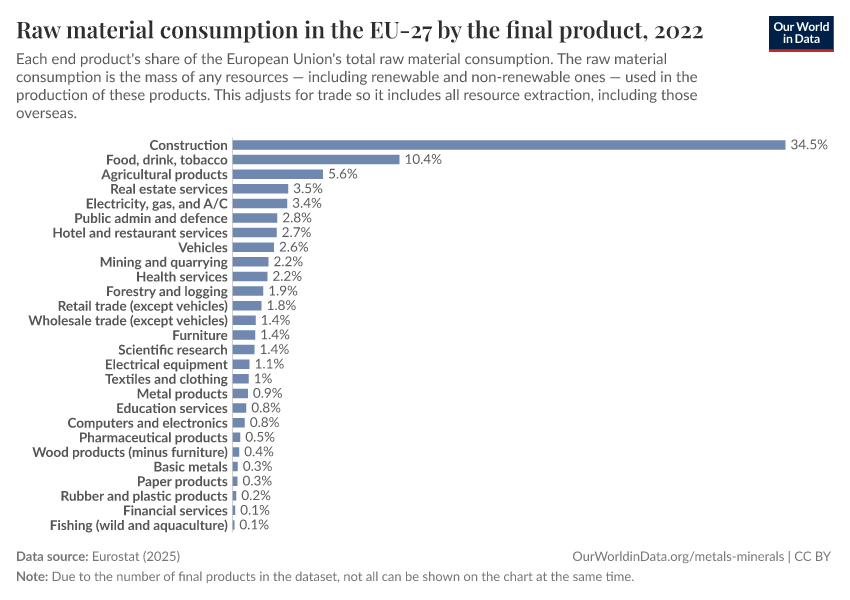
But, surprisingly, thinking carefully about these purchases is not advice that follows from looking at material footprints. The chart below shows the breakdown of the EU’s material consumption, this time by final product. We see that these consumer products account for a very small fraction of the total footprint.4
Textiles and clothing (which includes footwear and non-clothing textiles) account for only 1% of the total. Computers and consumer electronics are just 0.8%. Surprisingly, rubber and plastic products are just 0.2%.
Dramatically reducing our use of items traditionally associated with excess consumption would barely change our material footprint. My sense is that most people are unaware of this.
The material footprint leads us to counterintuitive policy recommendations that many environmentalists would strongly object to. Here’s the European Environment Agency again:
“Services require the lowest material use per euro spent among all domains, followed by clothing and household goods. Therefore, consumption patterns directly affect the EU’s material footprint and one way to reduce it is to promote expenditure patterns that are less material intensive.”
Spending more money on services than physical “stuff” makes sense if we want to reduce our material footprints. However, since clothing and households also have a low material intensity, we could also reduce our footprint by spending much more on clothes, televisions, phones, and other consumer goods and less on essentials such as food and housing.
“Spend more of your money on clothes and iPhones” to minimize your environmental footprint is not advice I’ve heard before (and is not advice I’d give either). Yet this is what the European Environment Agency implies when it suggests “promoting expenditure patterns that are less material-intensive”. That advice comes directly from the results of material footprints.
One motivation for measuring material footprints was to extend the focus of sustainability beyond carbon footprints. I share this sentiment. I wrote a book about seven environmental problems, and climate change was just one of them.
However, there are better ways to understand these environmental concerns than summing up the weight of the different resources we use.
I have written many articles on measuring sustainability and environmental impacts that go beyond carbon emissions. At Our World in Data, we have deliberately made our environment section extensive (see our list of topics below). We’ve covered land use, water use, eutrophication, deforestation, fertilizer overuse, biodiversity loss, food waste, and much more.
Resource use matters, and we need to monitor issues such as the risk of running out of some materials or the mining and socioeconomic impacts of others. There is a lot that we can do to make our economies more material-efficient and to shift from a model of continual extraction to a more circular one where we reuse materials.5 I’ve written about this opportunity before as we shift from fossil fuels to low-carbon energy.
Many metrics — like the ones listed in the screenshot above — do a better job at capturing the negative impacts. If we’re concerned about the scarcity of copper, we should be tracking how much we use and how much is available. If we’re worried about the environmental and social impacts of mining — water use, pollution, exploitation in supply chains — then we should be tracking these directly. However, the material footprint can downplay these issues because metal ores and fossil fuels make up a small fraction of the total in regions like the EU.
Despite the many limitations of the material footprint, almost all of the underlying individual indicators are useful. To calculate the final material footprint, researchers need to know the tonnes of copper, gold, cobalt, gravel, wood, and Atlantic tuna. On their own, these datasets are extremely valuable and could help us focus on specific resource challenges. It’s when they’re combined into a single number that this value is lost.
Comparing resource quantities within a common context can also be informative. For example, knowing how much mined materials we’ll need for different energy sources can help us understand some of the implications of the energy transition. The same applies to the amount of crops (including feed) required for different dietary choices.
Knowing how much uranium the world uses each year is useful. Creating a metric that suggests it should be treated the same as bananas is not.
Acknowledgments
Thank you to Max Roser and Edouard Mathieu for their valuable comments and suggestions on this article and its visualizations.
Cite this work
Our articles and data visualizations rely on work from many different people and organizations. When citing this article, please also cite the underlying data sources. This article can be cited as:
BibTeX citation
![]()
Reuse this work freely
All visualizations, data, and code produced by Our World in Data are completely open access under the Creative Commons BY license. You have the permission to use, distribute, and reproduce these in any medium, provided the source and authors are credited.
The data produced by third parties and made available by Our World in Data is subject to the license terms from the original third-party authors. We will always indicate the original source of the data in our documentation, so you should always check the license of any such third-party data before use and redistribution.
All of our charts can be embedded in any site.


![Braid groups are cool [pdf]](https://news.najib.digital/site/assets/img/broken.gif)
