.png)

Introduction
Inspired by biological systems, solid-state nanochannels have been functionalized with function elements to improve their performance. During ion and molecule transport through the nanochannels, six distinct regions are encountered (Fig. 1A): (1) bulk solution, (2) the real first interface (RFI) between the bulk solution and the outer surface, (3) outer surface, (4) inner wall, (5) outer surface, and (6) bulk solution. Each region plays a significant role in regulating ionic currents. However, previous studies have often treated the nanochannel as a whole when exploring the role of function elements in ionic current signals1,2, without distinguishing outer surface and inner wall3,4. As a result, the contributions of function elements at the inner wall have received significant attention5,6,7,8, while the influence of function elements at the outer surface has often been overlooked9.
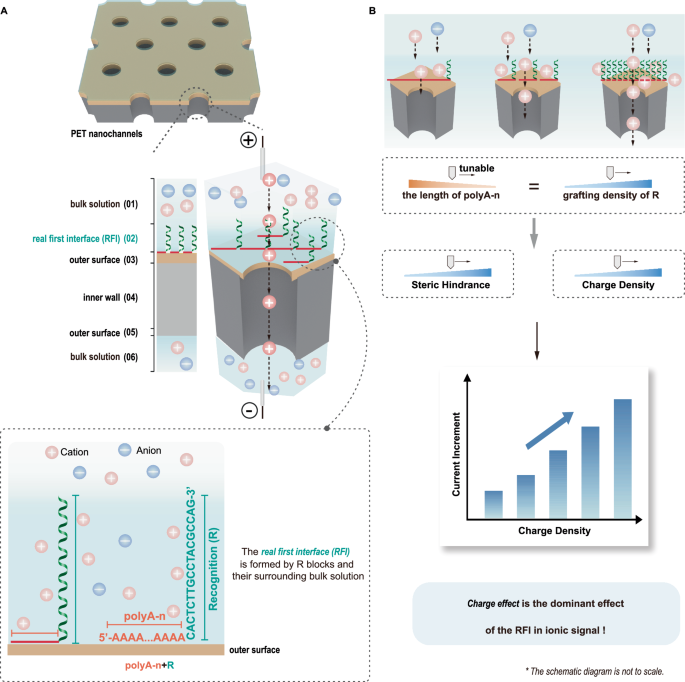
Abbreviations: RFI refers to the real first interface; polyA-n + R refers to diblock DNA, containing a polyA block and a recognition (R) block. A Scheme of ion transport through the functionalized nanochannels under an electric field. A poly(ethylene terephthalate) (PET) nanochannel membrane with explicit spatial partition of outer surface and inner wall is created by depositing Au onto one side of the membrane’s outer surface. Diblock DNA probes act as function elements, with polyA blocks adsorbing to the Au surface, while the R blocks extend into the bulk solution as R@RFI, together forming the RFI with the surrounding bulk solution. Ions are driven electrokinetically through six regions: (1) bulk solution, (2) RFI, (3) outer surface, (4) inner wall, (5) outer surface, and (6) bulk solution, generating an ionic signal. B The effect of the RFI in regulating the ionic signal can be individually investigated by tuning the length of polyA block. As the polyA length decreases, both the steric hindrance and charge density of the RFI increase. Our findings reveal that the ionic current increases with higher charge density, indicating that the primary effect of the RFI in transmembrane ionic current is due to its charge effect, rather than steric hindrance.
The structure of protein nanopores, for example, consists of multiple regions, each with distinct functions in regulating transport processes10. Without a thorough and explicit partitioning and investigation of these structural regions, it becomes challenging to fully understand the functionalities of biological pores11,12, which may subsequently hinder the development and functionalization of advanced biomimetic nanopores13,14,15,16. We have recently developed strategies to explicitly distinguish function elements located at the outer surface from those at the inner wall of solid-state nanochannels17,18, revealing that function elements at the outer surface can increase ion selectivity and block interfering molecules to adapt to target detection in complex matrices19,20,21,22,23. Through a series of studies, we have uncovered several ion regulation mechanisms, including: (1) the synergistic enhancement of function elements at the outer surface and ion gating of function elements at the inner wall19,24, (2) the anti-interference role of function elements at the outer surface combined with ion gating of function elements at the inner wall21,25, (3) the independent ion regulation of function elements at the outer surface20,26,27. The outer surface, offering more unrestricted space than the inner wall28,29, provides advantages for the immobilization of function elements, enabling precise characterization and detection of analytes ranging from nanometer to micrometer scales20,30,31,32,33.
While the roles of the five regions: (1) bulk solution, (3) outer surface, (4) inner wall, (5) outer surface, and (6) bulk solution, have been widely investigated and are relatively well understood with respect to ion regulation34,35,36, the contributions of region (2), defined as RFI, which consists of the functional elements extending into the bulk solution and their immediate surrounding bulk solution (Fig. 1A), have received comparatively limited attention. Although several studies have recognised the relevance of this interfacial region32,37,38, a systematic and independent investigation of its specific role in modulating ion transport remains lacking. A more detailed investigation of this interface could provide the final piece of the puzzle in elucidating the mechanisms of ion and molecule transport through nanochannels. Given that functional elements extending into the bulk solution are usually charged39, the presence of the RFI produces a space charge distribution, which facilitates the accumulation of surrounding carriers and their transport into the nanochannel33,40. In addition, the charged functional elements extending into the bulk solution have a certain physical size, resulting in steric hindrance29,37, which may reduce ion transport41,42. However, it remains unclear whether the dominant role of the RFI in regulating ion transport comes from the charge effect, steric hindrance, or a combination of both. Moreover, because the RFI is particularly susceptible to influences from neighboring regions, elucidating its specific role presents a significant challenge. In particular, functional elements extending into the bulk solution and those attached at the outer surface typically originate from the same function elements which are modified at the outer surface of nanochannels using the conventional surface functionalization techniques, such as thiol-gold32 and amine-carboxylic acid43 interactions, making it challenging to independently study the role of the RFI in ion transport. For example, thiol-labeled DNA probes commonly used as function elements are immobilized at Au-deposited outer surface via Au-S chemistry44. The thiol groups anchor to the outer surface as function elements attached at the outer surface, while the DNA probes extend into the bulk solution as functional elements extending into the bulk solution. These extending elements, together with their immediate surrounding solution, constitute the RFI. Varying the number of thiol groups alters the grafting density and charge of the RFI45, causing it difficult to individually study the role of RFI in regulating ionic current.
Herein, we report a targeted strategy to investigate the role of the RFI in ion transport. We utilize diblock oligonucleotides carrying consecutive adenines block with tunable numbers (polyA-n) and recognition (R) block (Fig. 1A). Our results demonstrate that polyA blocks preferentially bind to the gold surface at the outer surface of nanochannels as polyA-n@OS (corresponding to function elements attached at the outer surface), while the R blocks extend away from the outer surface and extend to the bulk solution as R@RFI (corresponding to functional elements extending into the bulk solution). Together, R@RFI and their surrounding bulk solution constitute the RFI. Regardless of the length of the polyA block, the steric hindrance and surface charge of polyA-n@OS remain nearly constant due to the near-saturation grafting density of adenines. In contrast, both the steric hindrance and charge density of the RFI decrease as the polyA block length increases, allowing for a clear investigation of the RFI’s role in regulating ionic signals. Our findings reveal that the ionic current increases with higher charge density, indicating that the primary effect of the RFI in transmembrane ionic current is due to its charge effect (Fig. 1B), rather than steric hindrance. Additionally, we demonstrate that R@RFI exhibits excellent target DNA hybridization capabilities, which can be improved 100-fold by combining with hybridization chain reaction (HCR) amplification, further underscoring the dominant role of charge effect. Our investigation to the role of the RFI in modulating ion transport within nanochannels uncovers the final piece of the puzzle in understanding the mechanism of ion and molecule transport through solid-state nanochannels, providing a foundation for the rational design of functional nanochannels.
Results
Preparation and characterization of nanochannel systems with only function elements attached at the outer surface
To fabricate a nanochannel system consisting of only function elements attached at the outer surface, we first created distinct outer surface and inner wall by the deposition of Au onto one side of a PET membrane (Supplementary Fig. 1)46. Scanning electron microscopy (SEM) images revealed the presence of gold nanoparticles on the outer surface, resulting in partial coverage of the nanochannels and a reduction in their diameter from approximately 30 nm to around 3 nm (Supplementary Fig. 2). The as-prepared Au-deposited PET membrane, termed as none@OS, served as the platform for fabricating accurate partition of function elements at the outer surface. The ionic transport properties of none@OS membrane were investigated using a two-electrode system with symmetric Ag/AgCl electrodes (Supplementary Fig. 3). Representative current-voltage (I-V) curves measured at PBS concentrations ranging from 0.001× to 10× PBS, corresponding to ionic concentrations of ~0.00016 to 1.6 M, were shown in Supplementary Fig. 4A. The corresponding ionic conductance values, derived from the slope of each I-V curve, were presented in Supplementary Fig. 4B. The results showed a nearly linear increase in conductance with concentration at high ionic strengths (0.4–1.6 M), whereas below 0.4 M, the conductance remained nearly constant, indicating a shift to a surface-charge-dominated regime47,48. Based on these findings, 1× PBS was selected as the standard electrolyte condition for all measurements in this study. Previous studies have demonstrated that polyA oligomers, which contain consecutive adenine nucleotides (dA), exhibit a high intrinsic affinity for gold surfaces49,50. Based on this, we chose polyA sequences with varied lengths as function elements for regional modification and further ionic signal regulation (Fig. 2A). Five different polyA lengths were tested: polyA-5, polyA-10, polyA-20, polyA-30, and polyA-60. These were immobilized onto gold surface of the none@OS due to the strong affinity of polyA for the gold surface, resulting in the systems polyA-5@OS, polyA-10@OS, polyA-20@OS,polyA-30@OS, and polyA-60@OS. The distribution of gold and polyA-n@OS along the nanochannels was characterized using time-of-flight secondary ion mass spectrometry (ToF-SIMS). The C6−, Au−, and CNO- signals were used to identify the PET nanochannels, the Au layer, and the polyA-n probes, respectively. A threshold 5% of the peak normalized intensity (indicated by the black dash line) in ToF-SIMS was applied to define the presence of elements within nanochannels. Based on this criterion, the depth of gold within the nanochannels was estimated to be approximately 50 nm, consistent with the deposition thickness (Fig. 2B, Supplementary Figs. 5 and 6). For polyA-30 probes, ToF-SIMS analysis showed their penetration depth into the nanochannels was estimated as 0 nm from the outermost membrane (Fig. 2B, C), indicating that the polyA-30 probes are primarily localized on the Au-deposited outer surface. Notably, ToF-SIMS also revealed that both shorter (polyA-5) and longer (polyA-60) sequences were predominantly distributed at the outer surface (Supplementary Fig. 5), further confirming the successful assembly of polyA-n@OS. X-ray photoelectron spectroscopy (XPS) was then employed to characterize the immobilization of polyA-n DNA at the gold surface of none@OS. The N 1 s spectrum exhibited two characteristic peaks at ~399 and ~401 eV (Fig. 2D), corresponding to the imine-N (–N = ) and amine-N (–NH–)51. These signals are indicative of chemisorbed dA on the gold surface, supporting the high adsorption affinity of polyA-n probes and validating their role as function elements attached at the outer surface.
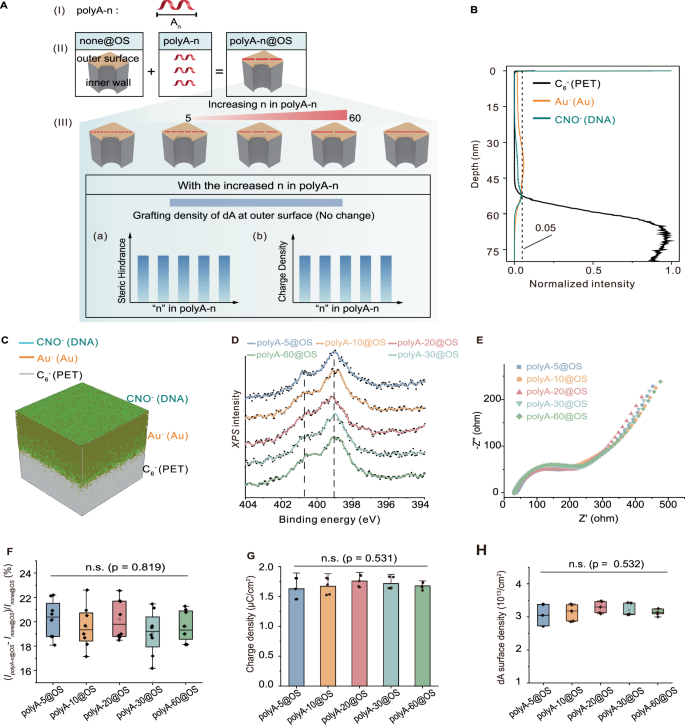
A Schematic representation of the explicit partition of function elements at the outer surface via the assembly of polyA-n, referred to as polyA-n@OS. (I) Structure of polyA-n. (II) Explicit partition of outer surface and inner wall was achieved by depositing Au onto one side of the nanochannel membrane (termed none@OS), followed by the assembly of polyA-n probes through the preferential binding of polyA to Au, forming polyA-n@OS. (III) The grafting density of dA, steric hindrance, and charge density of polyA-n@OS remained nearly constant across different polyA-n lengths. B Distribution of polyA-30@OS along the nanochannels characterized by ToF-SIMS. The black dash line indicates the 5% normalized intensity, defining the start or the end of the elements in the nanochannels55. C Corresponding 3D reconstruction of elemental distribution from ToF-SIMS data. DXPS spectra of the N 1 s region for polyA-n@OS. E EIS of polyA-n@OS. F Ionic current increase ratio after the assembly of polyA-n@OS. In box plots, box bounds represent the first and third quartiles, whiskers indicate the full range (minima to maxima), and n = 8 replicates. n.s., not significant. G Charge density remained nearly constant (mean ± SD, n = 5 replicates). n.s., not significant. H dA grafting density remained nearly constant, indicating consistent steric hindrance (n = 5 replicates). In violins, white dots represent medians, box bounds represent the first and third quartiles, and vertical black lines represent whiskers. n.s., not significant. Statistical analysis for (F–H) was performed using one-way ANOVA. All reported n values refer to independent biological replicates, where each replicate represents a separately prepared and tested nanochannel membrane under the corresponding condition.
To assess the surface accessibility of polyA-n@OS to ions, electrochemical impedance spectroscopy (EIS) was carried out to characterize charge transfer in a [Fe(CN)6]3-/4- solution52. Interestingly, EIS results showed that polyA-n probes, regardless of their length, exhibited similar charge transfer resistance, suggesting that the polyA probes effectively blocked all binding sites on the gold surface, hindering the access of [Fe(CN)6]3-/4- to the gold surface (Fig. 2E). Moreover, the larger semicircle diameter observed for polyA-n@OS compared to none@OS (Supplementary Fig. 7) further confirms the successful surface fabrication. These findings are consistent with the ToF-SIMS and XPS results, corroborating the effective assembly of polyA-n@OS via polyA-gold interactions.
The ionic transport properties of polyA-n@OS were investigated using a two-electrode system with symmetric Ag/AgCl electrodes. The modification of polyA-n probes had minimal impact on symmetric ion transport, as evidenced by the nearly linear I–V plots (Supplementary Fig. 8). Notably, polyA-n@OS exhibited higher ionic currents than none@OS (Supplementary Fig. 9). Stability assessments demonstrated that polyA-n@OS membranes maintained consistent I–V behavior during continuous measurements, even in the presence of urea (Supplementary Fig. 10 and 11), indicating that the polyA-n@OS membranes were stable, with no obvious DNA loss or Au dissolution. The current increase ratio ((IpolyA-n@OS - Inone@OS)/Inone@OS × 100% at +2 V) was consistent across all polyA-n@OS systems (Fig. 2F), suggesting that ion transport is independent of polyA length. To further explore the factors influencing ion transport, we quantified the steric hindrance and surface charge of polyA-n@OS using chronocoulometry19,53,54. The grafting density of polyA-n@OS was found to be inversely proportional to polyA length (Supplementary Fig. 12 and Supplement Table 1), while the surface charge density remained nearly identical across all polyA-n@OS samples (Fig. 2G). This uniform surface charge implies that the total amount of adsorbed dA was comparable across polyA-n@OS, resulting in equivalent steric hindrance (Fig. 2H). These findings confirm that all dA bases in the polyA blocks were fully adsorbed onto the gold surface49 and indeed acted as function elements attached at the outer surface. Compared to none@OS, the steric hindrance introduced by polyA-n@OS would be expected to slow down ion transport, while its negative charge facilitates the transport of positively charged ions. Given that polyA-n@OS exhibited higher ionic currents than none@OS, we conclude that charge density is the dominant factor governing the enhanced ionic current.
Construction and characterization of the RFI
Having established the ability to fabricate function elements attached at the outer surface with a consistent dA grafting density, we next aimed to spatially partition of function elements attached at the outer surface and those extending into the bulk solution by designing diblock DNA for assembly at none@OS. The diblock DNA contained tunable length of polyA blocks and recognition (R) blocks for DNA hybridization, and was termed polyA-n + R probes (Fig. 3A). We hypothesized that the polyA blocks would function analogously to polyA-n@OS, anchoring to the outer surface, while the R blocks would extend away from the outer surface and extend into the bulk solution, acting as R@RFI, thereby forming the RFI together with the surrounding solution. The resulting assembly of polyA-n + R probes at none@OS was designated as polyA-n@OS + R@RFI.
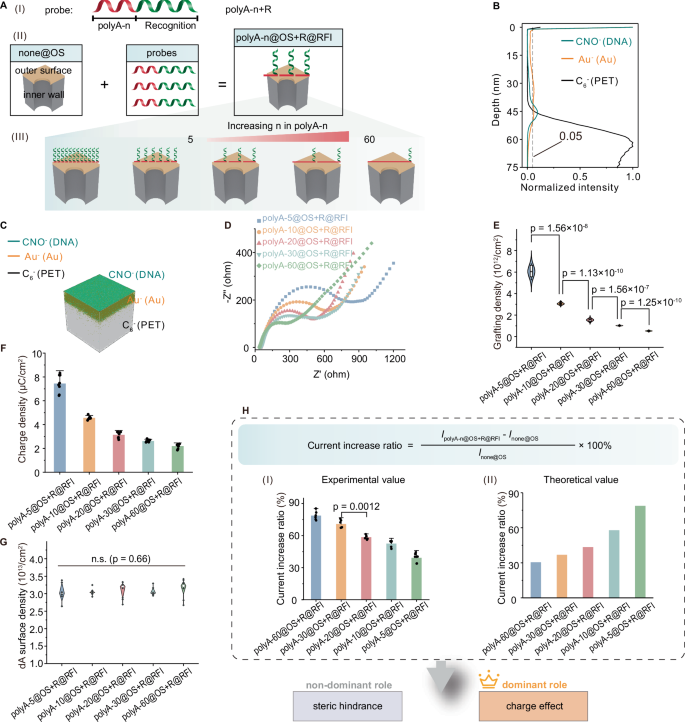
A Schematic for explicit partition of function elements attached at the outer surface and those extending into the bulk solution by assembling diblock DNA (polyA-n + R) probes at the outer surface. (I) Structure of polyA-n + R. (II) Assembly of polyA-n + R probes at none@OS relied on the preferential binding of polyA blocks with Au, promoting the extending of R blocks into the bulk solution, forming polyA-n@OS + R@RFI. R@RFI and the surrounding bulk solution formed the RFI. (III) With increasing polyA-n length, the steric hindrance and surface charge of polyA-n@OS remained constant due to stable dA grafting density. In contrast, both steric hindrance and charge density of the RFI decreased due to reduced R@RFI grafting density. B Distribution of polyA-n@OS + R@RFI along the nanochannels characterized by ToF-SIMS. The black dashed line indicated the 5% normalized intensity. C Corresponding 3D reconstruction of elemental distribution from ToF-SIMS data. D EIS of polyA-n@OS + R@RFI. E Grafting density of polyA-n@OS + R@RFI. Statistical analysis by Welch’s t-test (n = 8 replicates). F Charge density of polyA-n@OS + R@RFI (mean ± SD, n = 8 replicates). G Grafting density of dA in polyA-n@OS + R@RFI. In violin plots, white dots indicate medians, box bounds represent the first and third quartiles, and vertical black lines denote whiskers. Statistical analysis by one-way ANOVA. n.s., not significant (n = 8 replicates). H Experimental and simulated results of the ionic current increase ratio. Statistical analysis by Welch’s t-test (n = 6 replicates).
ToF-SIMS analysis confirmed that most polyA-30 + R probes were localized at the Au-deposited outer surface, with a penetration depth within the nanochannels estimated to be approximately 50 nm (Figs. 3B, C Supplementary Figs. 13 and 14), representing less than 5‰ of the total nanochannel length (12 μm). These results indicate the successful assembly of polyA-n + R probes at the outer surface55. Additionally, Nyquist plots from EIS indicated that charge transport resistance increased as the length of polyA decreased (Fig. 3D), suggesting that shorter polyA sequences led to higher grafting densities of polyA-n + R probes at the outer surface. The resulting increase in negatively charged probe density enhanced electrostatic repulsion against the [Fe(CN)₆]³⁻/⁴⁻ redox species, charged ferricyanide redox species, thereby increasing resistance and further confirming the efficient surface immobilization of polyA-n + R probes. Chronocoulometry measurements demonstrated that both the grafting density and surface charge density of polyA n + R probes decreased with increasing polyA length (Fig. 3E, F). Notably, the total grafting density of dA remained constant regardless of polyA length (Fig. 3G), indicating that all dA bases in the polyA-n + R probes were also fully adsorbed onto the gold surface, ensuring complete surface coverage. This nearly complete coverage of negatively charged polyA blocks prevented nonspecific adsorption of the R blocks at the outer surface, allowing them to extend into the bulk solution46. These results confirm the successful fabrication of polyA-n@OS + R@RFI, achieving explicit partition of function elements attached at the outer surface and those extending into the bulk solution. Thus, the steric hindrance and surface charge of the outer surface remained constant, while the properties of the RFI that was formed by R blocks and their surrounding bulk solution could be modulated by adjusting the polyA block length. As polyA length increased, both the steric hindrance and charge density of the RFI due to the reduced number of R blocks.
The polyA-30@OS + R@RFI system exhibited a significant increase in ionic current compared to none@OS across all tested PBS concentrations (Supplementary Fig. 15 A–G). The corresponding current increase ratio ((IpolyA-n@OS+R@RFI – Inone@OS)/Inone@OS) × 100% at +2 V) was shown in Supplementary Fig. 15H. The enhancement was most pronounced under low ionic strength (50–60% at 0.00016–0.16 M) and decreased with increasing ionic strength, reaching ~30% at 0.4 M and ~7.5% at 0.8–1.6 M. Based on these results, 1× PBS was selected as the standard electrolyte condition for subsequent measurements. Compared to none@OS, all polyA-n@OS + R@RFI systems exhibited elevated ionic signals (Supplementary Fig. 16), and the ionic current showed excellent stability (Supplementary Figs. 17 and 18). The current increase ratio ((IpolyA-n@OS+R@RFI – Inone@OS)/Inone@OS) × 100% at +2 V) decreased monotonically with increasing polyA length (Fig. 3H (I)). This trend arose from the trade-off between the charge effect and steric hindrance of the RFI. Moreover, simulations based on the classical Poisson, Nernst−Planck and Navier−Stokes (PNP − NS) equations55,56,57,58 (Supplementary Fig. 19) showed that the current increase ratio of the nanochannels after modification of polyA-n@OS + R@BS decreased with longer polyA lengths (Fig. 3H (II)). Both experimental and simulation results demonstrated that the role of the RFI in regulating ionic current was mainly determined by the charge effect rather than steric hindrance.
The effect of target binding to the RFI in regulating ion transport
A key feature of polyA-n@OS + R@RFI is that the R blocks adopt an upright conformation, with the spatial distance between R probes tunable by adjusting the length of polyA blocks. Given the strong dependence of hybridization efficiency on probe spacing, we investigated the hybridization capacity of the RFI and examined how target binding influences ionic current (Fig. 4A). Upon hybridization with the target DNA, a noticeable increase in ionic current was observed (Supplementary Fig. 20). Reversible hybridization and denaturation experiments further confirmed that the R blocks in polyA-n@OS + R@RFI can specifically bind to target DNA, leading to signal enhancement. Treatment with urea induced denaturation of the duplex and led to a reduction in signal (Fig. 4B). Specifically, the ionic current at bias +2 V decreased by about 35% following target removal, suggesting the dissociation of target DNA reduces ionic current. Subsequent incubation with 1 nM target DNA restored the ionic current to 99% of the original hybridization level, confirming that the signal increase originates from the hybridization of target DNA with the R blocks. Importantly, mismatched target.
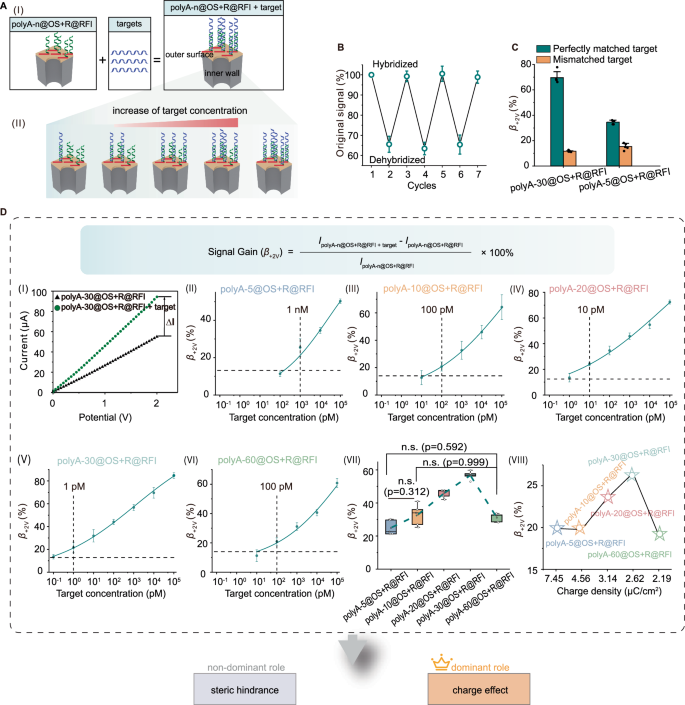
A Schematic illustration of target DNA recognition by the RFI. (I) Hybridization of target DNA with polyA-n@OS + R@RFI. (II) Upon increasing target DNA concentration, the steric hindrance and charge density of polyA-n@OS + R@RFI remained constant, while those of the target DNA both increased. B Regeneration assays of polyA-30@OS + R@RFI nanochannels performed sequentially using 1 nM target DNA (cycles 1, 3, 5, 7) and 8 M urea (cycles 2, 4, 6). Error bars represent the mean ± SD of triplicates. C Specificity analysis of polyA-30@OS + R@RFI and polyA-5@OS + R@BS for distinguishing perfectly matched target DNA from single-base mismatched sequences (mean ± SD, n = 5 replicates). D The β+2V value obtained experimentally increased with target DNA concentration (panels I–VI; mean ± SD, n = 5 replicates). Dashed lines represent the mean β+2V values of polyA-n@OS + R@RFI without target DNA plus 3 times the SD; dotted lines indicate the detection limits. (VII) Comparison of β+2V values among polyA-n@OS + R@RFI membranes after incubation with 1 nM target DNA. Statistical analysis was performed for multiple comparisons using one-way ANOVA, fellowed by Games-Howell post-hoc tests. n.s., not significant (n = 5 replicates). (VIII) Simulated β+2V values based on the classical PNP − NS equations for polyA-n@OS + R@RFI with different polyA blocks in the presence of 1 nM target DNA.
DNA exhibited a significantly lower signal gain value (β+2V) (Fig. 4C and Supplementary Fig. 21), as defined: Signal gain (β+2V) = (IpolyA-n@OS+R@RFI +target –IpolyA-n@OS+R@RFI) IpolyA-n@OS+R@RFI) × 100% at +2 V), indicating that the RFI can sensitively distinguish single nucleotide polymorphism. We further explored the effect of target DNA concentration in regulating ionic current. As target DNA concentration increased, more DNA molecules hybridized with the R blocks, leading to enhanced steric hindrance and charge density at the RFI. The resulting ionic current response was governed by a trade-off between the charge effect and steric hindrance introduced by the hybridized target DNA. Experiment results showed a progressive increase in the β+2V value with the increasing target concentration, highlighting the predominant role of the charge effect of the hybridized target DNA at the RFI in enhancing the ionic current (Fig. 4D and Supplementary Table 3-7).
We also investigated how variations in the β+2V values were influenced by the polyA block length in polyA-n@OS + R@RFI. As the polyA length increased, the detection limits of the system were programmed from 1 nM (polyA-5@OS + R@RFI) to 1 pM (polyA-30@OS + R@RFI), representing a 1000-fold increase in sensitivity. The β+2V value initially increased with increasing polyA length from polyA-5 to polyA-30, but then decreased upon further extension to polyA-60 (Fig. 4D(VII)). This behavior reflects a trade-off between the gains in charge effect and steric hindrance from the hybridized target DNA. While the gain in steric hindrance, representing by hybridization efficiency, increased with polyA length increased and saturated at polyA-30@OS + R@RFI (Supplementary Fig. 22A), resulting in a decrease in β+2V value. In contrast, with the increased polyA blocks, the gain in charge density showed the similar variation tendency as the obtained β+2V value (Supplementary Fig. 22B), indicating the charge effect from hybridized target DNA played a key role in the signal gain. In addition, simulations based on the PNP-NS equations demonstrated a similar trend: the β+2V value initially increased as charge density decreased, peaked at polyA-30@OS + R@RFI, and then decreased with further longer polyA lengths (Fig. 4D(VIII)). The consistency between experimental and simulation results confirms that the charge effect is the dominant factor influencing the change rate of the ionic current, highlighting the critical role of the RFI in regulating ion transport in these systems.
Combination the FRI with HCR amplification for regulating ion transport
To enhance the charge density at the RFI, we implemented HCR amplification by leveraging a target-triggered cascade of DNA polymerization (Fig. 5A). In this system, the target DNA acted as an initiator, alternately triggering the hybridization of two hairpin strands (H1 and H2) to form long double-stranded DNA nanowire tentacles59, as confirmed by agarose gel electrophoresis (Supplementary Fig. 23). The membrane of polyA-30@OS + R@RFI was chosen as a model platform to evaluate the sensing performance of the RFI. As the concentration of target DNA increased, a corresponding monotonic increase in the β+2V value was observed (Fig. 5B), primarily driven by the enhanced charge effect. As anticipated, the β+2V value was further elevated upon HCR amplification, due to the formation of long DNA nanowires introducing a substantial number of negative charges60. These charges likely concentrated the electrostatic field at the outer surface interface, thereby promoting ion accumulation and dissipation within the nanochannels55. This amplification led to a remarkable 100-fold increase in sensitivity, lowering the detection limit to 10 fM. Importantly, the introduction of HCR preserved the high specificity of the RFI. The system retained its ability to discriminate single-nucleotide mismatches (Supplementary Fig. 24) and demonstrated high selectivity for target DNA recognition in complex matrices, achieving high recovery rates (Supplementary Fig. 25). These results further confirm that the charge effect remaines the dominant factor in regulating ion transport in the combined RFI and HCR amplification system.
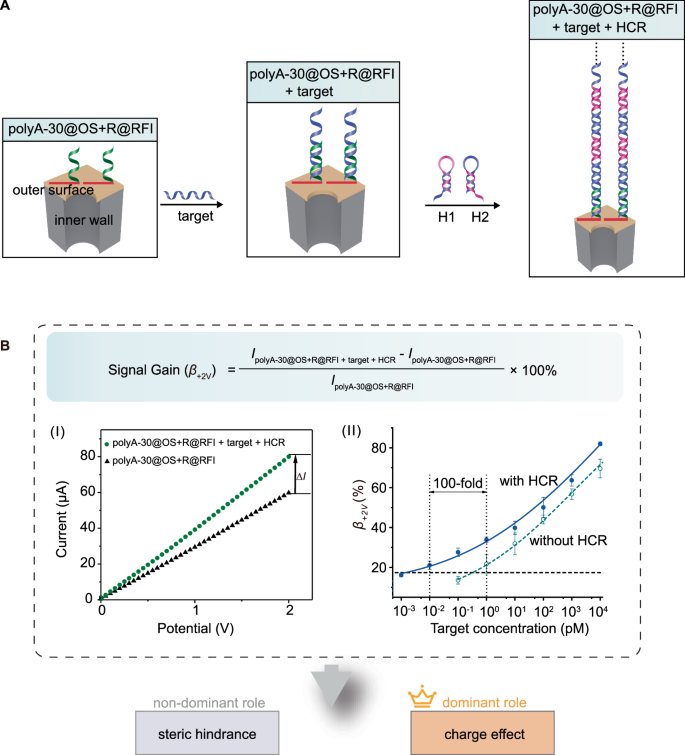
A Schematic illustration of coupling polyA-30@OS + R@BS with HCR into a nanochannel sensing platform for signal amplification. B The β+2V value increased with the concentration of target DNA (mean ± SD, n = 5 replicates), due to the dominant role of charge effect. The dashed lines represented the mean β+2V values of polyA-30@OS + R@RFI + HCR without target DNA plus 3 times the SD.
Discussion
In summary, we have successfully developed a solid-state nanochannel system with explicit partition of function elements attached at the outer surface and those extending into the bulk solution, achieved through the assembly of diblock DNA at the OS. For the first time, we investigated the role of the RFI on regulating ionic current, under conditions where the properties of (1) bulk solution, (3) function elements attached at the outer surface, (4) inner wall, and other regions remained constant. Our results show that either steric hindrance, charge density, or both can influence ionic current. Compared to other regions (Supplementary Table 2), both the numerical simulations and experimental data demonstrated the charge density of RFI plays a dominant role in regulating ion transport rather than the effect of steric hindrance. Based on programmable design of DNA sequence, it is also appropriate to integrate functional nucleic acids, such as aptamers61, into polyA blocks to construct the RFI for detection of small molecules and proteins62,63. Therefore, the study of the RFI may provide an insight into rational design of biosensors to improve the sensitivity and specificity, especially for solid-state nanopore/nanochannel-based sensors and electrochemical sensors.
In the 1st and 2nd stage, functionalized nanochannels typically incorporated both function elements at the outer surface and those at the inner wall, making it challenging to study the function of function elements in regulating ion transport19,21. In the 3rd stage, our group constructed a nanochannel system only consisting of independent function elements at the outer surface without those at the inner wall, and discovered that function elements at the outer surface could independently regulate ion transport20. Building on this, by achieving the explicit spatial partition function elements attached at the outer surface and those extending into the bulk solution, we here further revealed the regulating-ion-transport feature of the RFI formed between functional elements extending into the bulk solution and their surrounding bulk solution, thus opening the black box of the role of the RFI in regulating ionic signal. Although the current study focuses on gold-coated PET membranes, the underlying principles and methodologies are broadly applicable to a wind range of nanofluidic systems with varying materials and geometries, enabling systematic investigation of the role of RFI in ion transport across diverse nanochannel and nanopore platforms. The exploitation of the RFI uncovers the final piece of the puzzle in understanding the mechanism of ion and molecule transport through solid-state nanochannels, providing an opportunity to systematically study the process of ions and molecules passing through nanochannels, thereby further enhancing the functionality of nanochannels.
Utilization of independent functional elements extending into the bulk solution is an endeavor to separate the DNA hybridization process occurring at the RFI from the ion transport process at the outer surface. This setup allows us to assess the impact of target concentration in ionic current regulation more precisely. However, we acknowledge that the use of 12 µm-long PET nanochannels in this study inherently limits the ability to capture electric field-driven phenomena at the pore entrance, such as concentration polarization and localized ion enrichment or depletion. To address this limitation, future work will extend RFI studies to the outer surfaces of short-length nanochannels, where pore-mouth effects are more pronounced, enabling a more comprehensive investigation of the role of RFI in ion transport. In parallel, we will explore the influence of RFI length in ion transport by employing programmable DNA nanowires and nanostructures64. Moreover, the negatively or positively charged outer surface and RFI attract oppositely charged ions, forming an electrical double layer65. The electric double layer contains a strongly adsorbed Stern layer (about 0.9 nm in 0.1 M NaCl) close to the charged surface66 and a more loosely bound diffuse layer (with a Debye–Hückel screening length of about 0.75 nm in 1× PBS) farther away from the charged surface63. The ion concentrations across the Helmholtz layer, Stern layer, and the bulk solution exhibit varying trends67, impacting the transport process through the nanochannels. The RFI differs from the Debye length, which represents the electric double layer on the surfaces of electronic platforms such as electrodes, field-effect transistors, and nanochannels, with its length determined by buffer concentration68. The length of the Debye length in our system, using a 1× PBS buffer, is determined to be 0.75 nm63. In contrast, the RFI is formed by functional elements extending into the bulk solution together with their immediate surrounding solution, with its length modulated in a programmable manner by the number of DNA bases. The RFI is also more rigid than the Debye length. Therefore, achieving a clear spatial partition of these solutions and investigating their impact in ion transport is crucial. Precisely delineating these interfaces will enhance our understanding of ion transport, guide the design of high-performance devices, and support the development of strategies for regulating the sensitivity and specificity of sensors.
Methods
Materials and reagents
Track-etched polyethylene terephthalate (PET) membrane as nanochannel arrays with a 30 nm pore diameter, 12 μm thickness, and 5 × 10⁵ pores/cm2, were purchased from the it4ip company (Louvain-la-Neuve, Belgium). Hexaammineruthenium(III) chloride (RuHex) was obtained from Sigma-Aldrich (Shanghai, China). Fetal bovine serum (FBS) was purchased from Gibco. All oligonucleotides as shown in Supplementary Table 8 were synthesized and purified by Hippo Biotechnolog Co., Ltd (Beijing, China). Other chemicals were obtained from Sinopharm Chemical Reagents, Co., Ltd. (Shanghai, China) and used without further purification. All solutions were prepared with Milli-Q water with a resistivity of 18.2 MΩ/cm.
Instruments
The Leica EM ACE600 system was used to prepare gold deposited PET membrane by successive deposition of a Cr layer (20 nm) and a Au layer (30 nm) on one side of the PET membrane according to our previous work. Scanning electron microscope (SEM) (SU8010, Hitachi, Japan) was used to characterize the morphology of nanochannels. Time of flight secondary ion mass spectrometry (ToF-SIMS) (IONTOF, GmbH) was applied to characterize the distribution of diblock DNA along nanochannels. Electrochemical measurements were performed on a CHI 760e workstation (CH Instruments Inc., Shanghai, China).
Preparation of nanochannel system with explicit spatial partition of outer surface and inner wall
The metallic deposited track-etched polyethylene terephthalate (PET) membrane with a 30 nm pore diameter, 12 μm thickness, and 5 × 10⁵ pores/cm2 were prepared by consecutively depositing Cr and Au for 20 nm and 30 nm, respectively at one side of the membrane as our previous reports46,55. The deposited Cr with a rate of 0.05 nm/s was used to increase the stability of Au layer on the surface of PET. Thus, the outer surface of the membrane was Au, and the inner wall was PET, achieving explicit spatial partition of outer surface and inner wall. The prepared membrane was named as none@OS.
Modification of nanochannels with polyA-n and (polyA-n + R) probes
1 μM of polyA-n probes in PB buffer (10 mM PB, 1 M NaCl, 20 mM MgCl2, pH 7.4) was incubated with Au-deposited PET membrane (none@OS) for 12 h at room temperature. After rinsed and immersed in PBS buffer, the polyA-n@OS of nanochannels were prepared for further use. The assembly of polyA-n@OS + R@RFI was used the same protocol except using (polyA-n + R) probes.
Ionic current measurement
Before the assembly of polyA-n@OS or polyA-n@OS + R@RFI, the none@OS of PET membrane was mounted between two custom polytetrafluoroethylene cells, which were both filled with 1× PBS buffer (pH 7.4). After a pair of Ag/AgCl electrodes were separately inserted into each cell, I–V curves were recorded using a CHI 760e electrochemical workstation by linear sweep voltammetry in the potential range of –2 V to +2 V at a scan rate of 0.2 V/s. All voltages are referenced to the non-gold-deposited side of the PET membrane (counter electrode), which was held at ground. Then, the none@OS of PET membrane incubated with polyA-n probes or (polyA-n + R) probes to assemble polyA-n@OS or polyA-n@OS + R@RFI, respectively. After rinsed and immersed in PBS, the PET membrane was adopted to collect I-V curves. Thus, the increase of the ionic current after the assembly of polyA-n@OS (current increase ratio = ∆I/Inoe@OS = (IpolyA-n@OS – Inone@OS)/Inone@OS) × 100%) can be calculated. The increase of the ionic current after the assembly of polyA-n + R probes (current increase ratio = (IpolyA-n@OS+R@RFI – Inone@OS)/Inone@OS) × 100%) also can be calculated. For target hybridization, the polyA-n@OS + R@RFI of PET membrane incubated with PB buffer containing various concentrations of target DNA for 4 h at room temperature. After rinsed and immersed in PBS, the PET membrane was adopted to collect I-V curves. Therefore, the change rate of the ionic signal of each membrane before and after target hybridization, which was defined as signal gain (β+2V) = (IpolyA-n@OS+R@RFI + target – I(polyA-n@OS+R@RFI)/IpolyA-n@OS+R@RFI × 100% at +2 V), can be calculated. For HCR amplification, the polyA-30@OS + R@RFI of the PET membrane incubated with PB buffer containing 100 nM of H1 and H2 after reacted with various concentrations of target DNA, and the other procedures were the same as described above.
Measurement of grafting density and charge density
The grafting density and charge density of polyA-n@OS and polyA-n@OS + R@RFI of nanochannels were determined using chronocoulometry based on the method established by Steel et al53. Chronocoulometry was carried out by a three-electrode system, with the polyA-n@OS of PET membrane as working electrode, an Ag/AgCl as reference electrode and a platinum wire as auxiliary electrode. 7 × 7 mm polyA-n @OS of PET membrane was first immersed in tris-HCl buffer (10 mM tris, pH 7.0), and chronocoulometry was performed from +0.05 to -0.45 V for 500 ms after purged with N2 for at least 15 min. Then, chronocoulometry was performed again after added 50 µM of RuHex into the tris-HCl buffer. The measurement of grafting density and charge density of polyA-n@OS + R@RFI was used the same protocol except using polyA-n@OS + R@RFI of PET membrane as working electrode.
Estimation the grafting density and charge density of polyA-n@OS and polyA-n@OS + R@RFI
The grafting density of polyA-n@OS and polyA-n@OS + R@RFI of nanochannels can be estimated electrochemically via chronocoulometry45,53,69. The charge Q as a function of time t in a chronocoulometry test is given by the integrated Cottrell expression (Eq. 1) and the RuHex is employed as redox mediator.
$${{\rm{Q}}}=\,\frac{2{nFA}{D}_{0}^{1/2}{C}_{0}^{*}}{{\pi }^{1/2}}{t}^{1/2}+{Q}_{{dl}}+{nFA}{\varGamma }_{0}$$
(1)
where n is the number of electrons per molecule for reduction, F the Faraday constant (C/mol), A the electrode area (cm2), Do the diffusion coefficient (cm2/s), Co* the bulk concentration (mol/cm2), Qdl the capacitive charge (C), and nFAΓ0 the charge from the reduction of Γ0 (mol/cm2) of the adsorbed RuHeX. Thus, nFΓ0 is the charge density of polyA-n@OS or polyA-n@OS + R@RFI (C/cm2), namely ρpolyA@OS or ρpolyA-n@OS+R@RFI.
Chronocoulometric data is plotted as an Anson plot of Q versus t1/2. The intercept at t = 0 corresponds to Qdl + nFAΓ0. Γ0 is different in chronocoulometric intercepts for the identical potential step experiment in the presence and absence of RuHex, while Qdl keeps constant. Therefore, Γ0 can be calculated from two intercepts at t = 0 in the conditions without RuHex and with saturated concentration of RuHeX, shown as Eq. (2).
$${\varGamma }_{0}=\frac{{Q}_{{RuHeX}}-{Q}_{{dl}}}{{nFA}}$$
(2)
where Qdl is obtained from the intercept at t = 0 in the absence of RuHeX, QRuHeX is obtained from the intercept at t = 0 in the presence of saturated RuHeX.
The saturated surface excess of RuHeX can be converted to the grafting density of polyA-n@OS with the relationship, as Eq. (3).
$${\varGamma }_{{polyA}-n}=\,{\varGamma }_{0}\frac{z}{m}{N}_{A}$$
(3)
where ΓpolyA-n is the grafting density of polyA-n@OS of nanochnannels in molecules/cm2, m is the number of bases in the polyA-n probes, z is the charge of the RuHeX (z = 3), and NA is Avogadro’s number.
The saturated surface excess of RuHeX can be converted to the grafting density of polyA-n@OS + R@RFI with the relationship, as Eq. (4).
$${\varGamma }_{{polyA}-n+R}=\,{\varGamma }_{0}\frac{z}{m}{N}_{A}$$
(4)
where ΓpolyA-n+R is the grafting density of polyA-n@OS + R@RFI of nanochnannels in molecules/cm2, m is the number of bases in the (polyA-n + R) probes, z is the charge of the RuHeX (z = 3), and NA is Avogadro’s number.
Thus, ΓpolyA-n or ΓpolyA-n+R multiplied by the corresponding n could calculate the density of dA covered OS.
Measurement of hybridization efficiency of polyA-n@OS + R@RFI
After measured the grafting density, polyA-n@OS + R@RFI of nanochannels were incubated with 1 nM of target DNA in PB buffer for 4 hours. After rinsed and immersed in PBS, the hybridized polyA-n@OS + R@RFI membrane was put into tris-HCl buffer for chronocoulometry measurements as described above.
Estimation the hybridization efficiency of polyA-n@OS + R@RFI of nanochannels
A similar strategy was employed to estimate the hybridization efficiency of polyA-n@OS + R@RFI of nanochannels53,54. As the same process of estimation of grafting density, the grafting density of the hybridized target DNA can be calculated as Eq. (5).
$${\varGamma }_{{target\; DNA}}=\left(\frac{{Q}_{{dsDNA}}-\,{Q}_{{RuHeX}}}{{nFA}}\right)\frac{z}{m}{N}_{A}$$
(5)
Where Γtarget DNA is the grafting density of target DNA at RFI, QRuHeX and QdsDNA are obtained from the intercept at t = 0 in the presence of saturated RuHeX before and after target DNA hybridization, z is the charge of the RuHeX (z = 3), m’ is the number of bases in target DNA, and NA is Avogadro’s number. (QdsDNA - QRuHeX)/A is the charge density of the hybridized target DNA (C/cm2) at RFI, namely ρtarget. Therefore, the hybridization efficiency can be calculated as equation (6).
$${{\rm{Hybridization\; efficiency}}}=\,\frac{{\varGamma }_{{traget\; DNA}}}{{\varGamma }_{{polyA}-n+R}}\,{{\boldsymbol{\times }}}100\%$$
(6)
Where Γdiblock DNA and Γtarget DNA are the grafting density of polyA-n@OS + R@BS probes and hybridized target DNA, respectively.
Electrochemical impedance spectroscopy (EIS)
EIS was carried out by a three-electrode system, with the polyA-n@OS or polyA-n@OS + R@BS of PET membrane as working electrode, an Ag/AgCl as reference electrode and a platinum wire as auxiliary electrode. The EIS measurement solution was 5 mM Fe(CN)63−/4− containing 0.1 M KCl (pH 7.0). The AC voltage amplitude was 5 mV, and the voltage frequencies ranged from 0.01 Hz to 100 kHz.
Time-of-Flight Secondary Ion Mass Spectrometry (ToF-SIMS)
The surface of the deposited PET membranes functionalized with polyA-n or polyA+R probes was analyzed using a ToF-SIMS V instrument (IONTOF GmbH). A liquid metal ion source generating Bi ions was employed, directing the primary Bi3+ ion beam at a 45° incidence angle relative to the sample surface, with an energy of 30 keV. For each measurement, a fresh area of 100 × 100 µm was sputtered. The time-of-flight analyzer was positioned perpendicular (90°) to the sample surface. Negative secondary ion spectra were acquired. Calibration of the mass spectra was performed following standard protocols, achieving a mass resolving power greater than 5000.
X-ray Photoelectron Spectroscopy (XPS)
XPS analyses were carried out using a Thermo, ESCALAB250Xi equipped with a monochromatic Al Kα X-ray source (150 W). Samples were mounted on conductive double-sided tape and introduced into the analysis chamber, maintained at a base pressure below 2 × 10⁻⁹ Torr. High-resolution spectra of key elements (C 1 s, P 2p, N 1 s) were recorded at a pass energy of 30 eV and a step size of 0.1 eV.
Numerical simulation
The theoretical calculations were performed by using the commercial multi-physical field software COMSOL (version 5.4), according to the previous work55,56,57,58. In this study, continuous media treatment was used, and the size of ionic and solvent molecules was ignored. Then the flux of each species ions, Ji can be described by Nernst-Planck equation:
$${{\mbox{J}}}_{{\mbox{i}}}=-{{\mbox{D}}}_{{\mbox{i}}}\left(\nabla {{\mbox{c}}}_{{\mbox{i}}}+\frac{{{\mbox{z}}}_{{\mbox{i}}}{\mbox{e}}{{\mbox{c}}}_{{\mbox{i}}}}{{{\mbox{k}}}_{{\mbox{B}}}{\mbox{T}}}\nabla \right)$$
(7)
where zi is the valence of ion, kB is the Boltzmann constant, Di is the diffusion coefficient, φ is the electrical potential and ci is the concentration of ions. In the nanochannel, φ is determined by the Poisson equation:
$${\varepsilon }_{0}\varepsilon {\nabla }^{2}{{\rm{\varphi }}}=e({c}_{+}-{c}{-})$$
(8)
where ε0 is the permittivity of vacuum, ε is the dielectric constant of the electrolyte solutions, and c+ and c− are the concentrations of cations and anions, respectively. In the present work, φ is calculated by the surface charge density measured by chronocoulometry tests. In the continuous electric field, the steady-state solution could be calculated as:
$$\nabla {{\cdot }}({ciu}+{J}_{i})=0$$
(9)
The solution is considered incompressible. Therefore, the velocity vector of the solution gradient, ∇·u is equal to zero. The complete set is the Navier-Stokes equation:
$$u\nabla \cdot u=\left[-{\nabla }_{p}+\nu {\nabla }^{2}u-\left({c}_{+}-{c}_{-}\right){{\rm{\nabla }}}{\varphi }\right]/\rho=0$$
(10)
where p is pressure, ν is the solution viscosity and ρ is the mass density of solution. In this study, it is supposed that there is no pressure gradient, which represents ∇p is equal to zero. The ionic current, I, across the nanochannel can be calculated by the Poisson, Nernst-Planck and Navier-Stokes (PNP-NS) equations:
$$I=F\int \left({\sum }_{i=1}^{2}{z}_{i}{J}_{i}\right)\cdot {dS}$$
(11)
where F is the Faraday constant.
Statistics & reproducibility
No statistical method was used to predetermine sample size. All experiments were independently repeated at least three times with similar results unless otherwise stated. No data were excluded from the analyses. The experiments were not randomized. The investigators were not blinded to allocation during experiments and outcome assessment. Data are presented as mean ± SD unless otherwise indicated. Statistical comparisons between groups were performed using Welch’s t-test or one-way ANOVA where appropriate, as specified in figure legends. A p value < 0.05 was considered statistically significant.
Reporting summary
Further information on research design is available in the Nature Portfolio Reporting Summary linked to this article.
Data availability
All data supporting the findings of this study are available within the main article, its Supplementary Information, and the accompanying Source Data file. These include all processed data and raw values underlying the graphs and statistical analyses. No datasets were deposited in public repositories as all relevant data are provided in the published materials. No custom code was used in this study. Source data are provided with this paper.
References
Wei, R., Gatterdam, V., Wieneke, R., Tampé, R. & Rant, U. Stochastic sensing of proteins with receptor-modified solid-state nanopores. Nat. Nanotechnol. 7, 257–263 (2012).
Xue, L. et al. Solid-state nanopore sensors. Nat. Rev. Mater. 5, 931–951 (2020).
Yusko, E. C. et al. Controlling protein translocation through nanopores with bio-inspired fluid walls. Nat. Nanotechnol. 6, 253–260 (2011).
Quan, J. et al. A visible-light-regulated chloride transport channel inspired by rhodopsin. Angew. Chem. Int. Ed. 60, 2892–2897 (2021).
Peinetti, A. S. et al. Direct detection of human adenovirus or SARS-CoV-2 with ability to inform infectivity using DNA aptamer-nanopore sensors. Sci. Adv. 7, eabh2848 (2021).
Sun, Y. et al. A highly selective and recyclable NO-responsive nanochannel based on a spiroring opening−closing reaction strategy. Nat. Commun. 10, 1323 (2019).
Li, M. Y. et al. Nanopore approaches for single-molecule temporal omics: promises and challenges. Nat. Methods 22, 241–253 (2025).
Wang, Y., Jin, R., Sojic, N., Jiang, D. & Chen, H.-Y. Intracellular wireless analysis of single cells by bipolar electrochemiluminescence confined in a nanopipette. Angew. Chem. Int. Ed. 59, 10416–10420 (2020).
Chuah, K. et al. Nanopore blockade sensors for ultrasensitive detection of proteins in complex biological samples. Nat. Commun. 10, 2109 (2019).
Alber, F. et al. The molecular architecture of the nuclear pore complex. Nature 450, 695–701 (2007).
Acar, E. T., Buchsbaum, S. F., Combs, C., Fornasiero, F. & Siwy, Z. S. Biomimetic potassium-selective nanopores. Sci. Adv. 5, eaav2568 (2019).
Ying, Y.-L. et al. Nanopore-based technologies beyond DNA sequencing. Nat. Nanotechnol. 17, 1136–1146 (2022).
Dai, Y. et al. Inner wall and outer surface distinguished solid-state nanopores for sensing. Anal. Chem. 94, 17343–17348 (2022).
Zhang, S. et al. Addressing challenges in ion-selectivity characterization in nanopores. J. Am. Chem. Soc. 146, 11036–11042 (2024).
Ma, H. et al. Label-free mapping of multivalent binding pathways with ligand–receptor-anchored nanopores. J. Am. Chem. Soc. 146, 28014–28022 (2024).
Peng, W. et al. High-resolution discrimination of homologous and isomeric proteinogenic amino acids in nanopore sensors with ultrashort single-walled carbon nanotubes. Nat. Commun. 14, 2662 (2023).
Gao, P. et al. Regional and functional division of functional elements of solid-state nanochannels for enhanced sensitivity and specificity of biosensing in complex matrices. Nat. Protoc. 16, 4201–4226 (2021).
Shang, Z. et al. Regulation of transmembrane current through modulation of biomimetic lipid membrane composition. Faraday Discuss 257, 73–87 (2025).
Li, X. et al. Publisher correction: role of outer surface probes for regulating ion gating of nanochannels. Nat. Commun. 9, 647 (2018).
Ma, Q. et al. Towards explicit regulating-ion-transport: nanochannels with only function-elements at outer-surface. Nat. Commun. 12, 1573 (2021).
Gao, P. et al. Distinct functional elements for outer-surface anti-interference and inner-wall ion gating of nanochannels. Nat. Commun. 9, 4557 (2018).
Shang, Z. et al. Precise control of transmembrane current via regulating bionic lipid membrane composition. Sci. Adv. 10, eadq0118 (2024).
Xu, L., Chen, L. & Xia, F. Superhydrophobicity-improved ethanol-water separation. Chem. Res. Chin. U. 39, 107–108 (2023).
Zhang, W.-Q. et al. A single set of well-designed aptamer probes for reliable on-site qualitative and ultra-sensitive quantitative detection. Angew. Chem. Int. Ed. 63, e202316434 (2024).
Liu, L. et al. Synergistic effect of bio-inspired nanochannels: hydrophilic DNA probes at inner wall and hydrophobic coating at outer surface for highly sensitive detection. Small 18, 2201925 (2022).
Ma, Q. et al. Local electric potential-driven nanofluidic ion transport for ultrasensitive biochemical sensing. ACS Nano 18, 6570–6578 (2024).
Dai, J. et al. Cell-sensing analogue nanopore for rapid detection of protein-related targets. Angew. Chem. Int. Ed. Engl. 64, e202421721 (2025).
Zhang, X. et al. DNA-functionalized solid-state nanochannels with enhanced sensing. Acc. Mater. Res. 6, 285–293 (2024).
Meng, D. et al. Tailored chiral copper selenide nanochannels for ultrasensitive enantioselective recognition and detection. Angew. Chem. Int. Ed. 60, 24997–25004 (2021).
Lou, X. et al. Enzyme and aiegens modulated solid-state nanochannels: in situ and noninvasive monitoring of H2O2 released from living cells. Small Methods 4, 1900432 (2020).
Wang, C. et al. Dendrimer-au nanoparticle network covered alumina membrane for ion rectification and enhanced bioanalysis. Nano Lett. 20, 1846–1854 (2020).
Hu, J. J. et al. Enzyme regulating the wettability of the outer surface of nanochannels. ACS Nano 17, 11935–11945 (2023).
Cai, J. et al. Polarization-sensitive optoionic membranes from chiral plasmonic nanoparticles. Nat. Nanotechnol. 17, 408–416 (2022).
Huang, Y. et al. Solid-state nanochannels for bio-marker analysis. Chem. Soc. Rev. 52, 6270–6293 (2023).
Dai, L. et al. Outer-surface functionalized solid-state nanochannels for enhanced sensing properties: progress and perspective. ACS Nano 18, 7677–7687 (2024).
Li, X. et al. Unidirectional and selective proton transport in artificial heterostructured nanochannels with nano-to-subnano confined water clusters. Adv. Mater. 32, 2001777 (2020).
Tagliazucchi, M., Rabin, Y. & Szleifer, I. Ion transport and molecular organization are coupled in polyelectrolyte-modified nanopores. J. Am. Chem. Soc. 133, 17753–17763 (2011).
Lin, C.-Y., Combs, C., Su, Y.-S., Yeh, L.-H. & Siwy, Z. S. Rectification of concentration polarization in mesopores leads to high conductance ionic diodes and high performance osmotic power. J. Am. Chem. Soc. 141, 3691–3698 (2019).
Shang, Z. et al. Programming the dynamic range of nanochannel biosensors for microRNA detection through allosteric DNA probes. Angew. Chem. Int. Ed. 64, e202417280 (2025).
Ma, Q., Chen, L., Gao, P. & Xia, F. Solid-state nanopore/channels meet DNA nanotechnology. Matter 6, 373–396 (2023).
Schmid, S., Stommer, P., Dietz, H. & Dekker, C. Nanopore electro-osmotic trap for the label-free study of single proteins and their conformations. Nat. Nanotechnol. 16, 1244–1250 (2021).
Heerema, S. J. & Dekker, C. Graphene nanodevices for DNA sequencing. Nat. Nanotechnol. 11, 127–136 (2016).
Zhao, X. P. et al. Biomimetic nanochannel-ionchannel hybrid for ultrasensitive and label-free detection of microRNA in cells. Anal. Chem. 91, 3582–3589 (2019).
Zhang, S., Du, Q., Wang, J., Huang, Y. & Xia, F. Pore-size-dependent role of functional elements at the outer surface and inner wall in single-nanochannel biosensors. Anal. Chem. 96, 7163–7171 (2024).
Liu, T. et al. Revealing ionic signal enhancement with probe grafting density on the outer surface of nanochannels. Anal. Chem. 93, 13054–13062 (2021).
Wu, X. et al. Ionic signal enhancement by the space charge effect through the dna rolling circle amplification on the outer surface of nanochannels. Anal. Chem. 93, 16043–16050 (2021).
Shao, J.-J., Raidongia, K., Koltonow, A. R. & Huang, J. Self-assembled two-dimensional nanofluidic proton channels with high thermal stability. Nat. Commun. 6, 7602 (2015).
Yeom, J. et al. Photosensitive ion channels in layered MXene membranes modified with plasmonic gold nanostars and cellulose nanofibers. Nat. Commun. 14, 359 (2023).
Opdahl, A., Petrovykh, D. Y., Kimura-Suda, H., Tarlov, M. J. & Whitman, L. J. Independent control of grafting density and conformation of single-stranded DNA brushes. Proc. Natl. Acad. Sci. USA104, 9–14 (2007).
Pei, H. et al. Designed diblock oligonucleotide for the synthesis of spatially isolated and highly hybridizable functionalization of DNA-gold nanoparticle nanoconjugates. J. Am. Chem. Soc. 134, 11876–11879 (2012).
Acres, R. G. et al. An experimental and theoretical study of adenine adsorption on Au(111). PCCP 20, 4688–4698 (2018).
Nakatsuka, N. et al. Aptamer conformational change enables serotonin biosensing with nanopipettes. Anal. Chem. 93, 4033–4041 (2021).
Steel, A. B., Herne, T. M. & Tarlov, M. J. Electrochemical quantitation of DNA immobilized on gold. Anal. Chem. 70, 4670–4677 (1998).
Lin, M. et al. Electrochemical detection of nucleic acids, proteins, small molecules and cells using a DNA-nanostructure-based universal biosensing platform. Nat. Protoc. 11, 1244–1263 (2016).
Wu, X. et al. Exponential increase in an ionic signal: a dominant role of the space charge effect on the outer surface of nanochannels. Anal. Chem. 93, 13711–13718 (2021).
Tagliazucchi, M. & Szleifer, I. Theoretical Basis for Structure and Transport in Nanopores and Nanochannels. in Chemically Modified Nanopores and Nanochannels (eds. Tagliazucchi, M. & Szleifer, I.) 27-60 (William Andrew Publishing, Boston, 2017).
Schoch, R. B., Han, J. Y. & Renaud, P. Transport phenomena in nanofluidics. Rev. Mod. Phys. 80, 839–883 (2008).
Constantin, D. & Siwy, Z. S. Poisson-Nernst-Planck model of ion current rectification through a nanofluidic diode. Phys. Rev. E 76, 041202 (2007).
Dirks, R. M. & Pierce, N. A. Triggered amplification by hybridization chain reaction. Proc. Natl. Acad. Sci. USA101, 15275–15278 (2004).
Wu, R. et al. A duplex polymerization strategy for general, programmable and high-resolution nanopore-based sensing. Angew. Chem. Int. Ed. 62, e202304891 (2023).
Shi, L. et al. Aptamer-functionalized nanochannels for one-step detection of SARS-CoV-2 in samples from COVID-19 patients. Anal. Chem. 93, 16646–16654 (2021).
Ran, X. Q., Qian, H. L. & Yan, X. P. Aptamer self-assembly-functionalized nanochannels for sensitive and precise detection of chloramphenicol. Anal. Chem. 93, 14287–14292 (2021).
Nakatsuka, N. et al. Aptamer-field-effect transistors overcome Debye length limitations for small-molecule sensing. Science 362, 319–324 (2018).
Qi, M. et al. Meta-DNA strand displacement for sub-micron-scale autonomous reconfiguration. J. Am. Chem. Soc. 145, 16812–16820 (2023).
Wu, J. Understanding the electric double-layer structure, capacitance, and charging dynamics. Chem. Rev. 122, 10821–10859 (2022).
Brown, M. A., Goel, A. & Abbas, Z. Effect of electrolyte concentration on the stern layer thickness at a charged interface. Angew. Chem. Int. Ed. 55, 3790–3794 (2016).
Zhang, L. L. & Zhao, X. S. Carbon-based materials as supercapacitor electrodes. Chem. Soc. Rev. 38, 2520–2531 (2009).
Bohinc, K., Kralj-Iglič, V. & Iglič, A. Thickness of electrical double layer. Effect of ion size. Electrochim. Acta 46, 3033–3040 (2001).
Ma, Q. et al. Revealing the critical role of probe grafting density in nanometric confinement in ionic signal via an experimental and theoretical study. Anal. Chem. 93, 1984–1990 (2021).
Acknowledgements
This work is supported by the National Natural Science Foundation of China (22090050 to F.X., 22174132 to M.L., 22204150 to J.P., 22364004 to X.Y., and 22474132 to X.Z.), the National Key R&D Program of China (2021YFA1200403 to F.X.), the Natural Science Foundation of Shenzhen (JCYJ20220530162406014 to F.X.), the Natural Science Foundation of Jiangxi Province (20224BAB216113 to X.Y.), and the Open Project Program of Key Laboratory for Analytical Science of Food Safety and Biology, Ministry of Education (Grant No. FS2504 to M.L.).
Ethics declarations
Competing interests
The authors declare no competing interests.
Peer review
Peer review information
Nature Communications thanks the anonymous reviewers for their contribution to the peer review of this work. A peer review file is available.
Additional information
Publisher’s note Springer Nature remains neutral with regard to jurisdictional claims in published maps and institutional affiliations.
Supplementary information
Rights and permissions
Open Access This article is licensed under a Creative Commons Attribution-NonCommercial-NoDerivatives 4.0 International License, which permits any non-commercial use, sharing, distribution and reproduction in any medium or format, as long as you give appropriate credit to the original author(s) and the source, provide a link to the Creative Commons licence, and indicate if you modified the licensed material. You do not have permission under this licence to share adapted material derived from this article or parts of it. The images or other third party material in this article are included in the article’s Creative Commons licence, unless indicated otherwise in a credit line to the material. If material is not included in the article’s Creative Commons licence and your intended use is not permitted by statutory regulation or exceeds the permitted use, you will need to obtain permission directly from the copyright holder. To view a copy of this licence, visit http://creativecommons.org/licenses/by-nc-nd/4.0/.
About this article
Cite this article
Lin, M., Zhao, J., Yi, X. et al. Role of the real first interface in regulating ionic signal of nanochannels. Nat Commun 16, 8360 (2025). https://doi.org/10.1038/s41467-025-62077-2
Received: 22 January 2025
Accepted: 10 July 2025
Published: 24 September 2025
DOI: https://doi.org/10.1038/s41467-025-62077-2