.png)

Main
The Southwest Iberian Margin lies along the Africa–Eurasia plate boundary zone1 (Fig. 1). The region is characterized by WNW–ESE oblique convergence of ~4 mm yr−1 (ref. 2). The resulting deformation is accommodated on the seafloor by a set of visible WNW–ESE strike-slip faults and NE–SW thrusts, which control the uplift of seamounts that separate abyssal plains3. The Southwest Iberian Margin has generated the highest-magnitude earthquakes in Europe4,5. These include the M8.5–8.7 Great Lisbon Earthquake of 1755, whose ground motion, tsunami and fires caused widespread destruction in Portugal and killed tens of thousands6,7,8; the M7.5–8.5 earthquakes of 1356 and 1761 (ref. 9); and the more recent M7.9 earthquake of 1969, located ~200 km SW off Cape St. Vincent4 (Fig. 1).
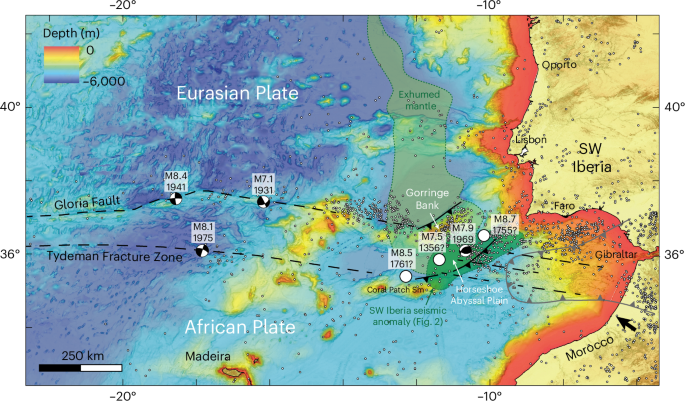
To the west, it is possible to recognize two main structures: the Gloria Fault, which is generally considered the main trace of the present-day plate boundary, and the seemingly less active Tydeman Fracture Zone (although this segment of the plate boundary is often referred to as diffuse1,48). Both these structures have experienced high-magnitude earthquakes. To the east, their linear morphological traces gradually give way to thrust fault systems that uplift the seafloor, forming two major bathymetric highs, the Coral Patch Seamount and the Gorringe Bank, that delimit the Horseshoe Abyssal Plain (see also Extended Data Fig. 1). This region has unleashed some of the major historical and instrumental earthquakes in the Atlantic region. Although the precise location of the historical earthquakes is unknown, probable locations are given. For the instrumental earthquakes, the circles roughly correspond to the uncertainties in their locations1,4,5,6,7,16. A more detailed structural map of the Horseshoe Abyssal Plain and surrounding areas is provided in Extended Data Fig. 2. The black arrow indicates the Africa–Eurasia convergence direction in the SW Iberia region for a fixed Eurasian plate48. The West Iberian margin is a classic example of a hyperextended magma-poor margin in which the continental and oceanic crusts are separated by a stripe of exhumed serpentinized mantle (light green)12,24,49. The projection of the seismic anomaly of Fig. 2a is depicted in darker green. Basemap created with the ArcGIS® software by Esri using data available from GEBCO (https://www.gebco.net/). Seismicity data are available at http://www.isc.ac.uk.
The 1356, 1755 and 1761 earthquakes are poorly understood given their offshore location and occurrence within the historical period5. However, the more recent M7.9 1969 earthquake has been instrumentally recorded. Remarkably, it occurred ~30 km below the flat Horseshoe Abyssal Plain, away from mapped major tectonic faults (Fig. 1 and Extended Data Fig. 2). Although of limited quality, aftershock locations were used to argue that the event occurred on a north-dipping thrust structure4,10. The same authors proposed that the 1969 earthquake was generated by a large trans-lithospheric thrust fault beneath the Horseshoe Abyssal Plain, responsible for the consumption of oceanic lithosphere10. However, the expression of such a major north-dipping lithospheric thrust was never detected by high-resolution bathymetry or seismic reflection surveys3,11. All mapped faults at shallower crustal levels have an overall south-dipping vergence, such as the NE–SW Gorringe Northern Thrust that uplifts a 5-km-high seamount (Gorringe Bank in Fig. 1). Besides, what mechanism could explain the existence of such a trans-lithospheric fault, capable of generating seismic events of very high magnitude, typical of subduction zones, below a flat abyssal plain overlain by almost undisturbed sediments?
Over the past 50 years, several multibeam and seismic surveys have searched for the elusive sources of the 1755 and 1969 earthquakes. These surveys mostly focused on major morphotectonic features, such as the Gorringe Bank, leaving parts of the Horseshoe Abyssal Plain poorly mapped3,11. An exception is a seismic refraction profile that cuts across the Horseshoe Abyssal Plain12 that imaged a step in the lithospheric structure, interpreted as a blind south-dipping thrust. However, this step occurs right at the intersection of a major strike-slip fault, rendering this structure’s interpretation non-unique. Numerous conceptual models involving different tectonic sources for high seismicity were proposed8,13,14,15,16,17, but no consensus has emerged. Here, we integrate recent seismic and geological observations to propose a novel geodynamic interpretation for the region supported by new numerical models that can explain the generation of high-magnitude earthquakes and can be reconciled with the upper mantle structure.
Seismic tomography evidence for oceanic plate delamination
High-resolution teleseismic P-wave travel-time tomography covering the Southwest Iberian Margin and encompassing ocean bottom seismometer (OBS) data has confirmed the existence of a previously imaged high-velocity anomaly below the Horseshoe Abyssal Plain14,18,19 (Figs. 1 and 2 and Extended Data Figs. 3–5; see also the Methods). This anomaly extends down to a depth of 250 km and has been proposed to correspond to a small slab that would be the expression of subduction initiation18. However, this model would imply >200 km of crustal shortening accommodated offshore SW Iberia, along a NW–SE direction (Extended Data Fig. 1). Such an amount of convergence contradicts palinspastic restorations that show a maximum tectonic shortening of 20–50 km at crustal levels20,21,22. A possible explanation for this mismatch would be the existence of decoupling levels within the lithosphere. This would result in different amounts of shortening being accommodated between the deep lithosphere and the shallow crust.
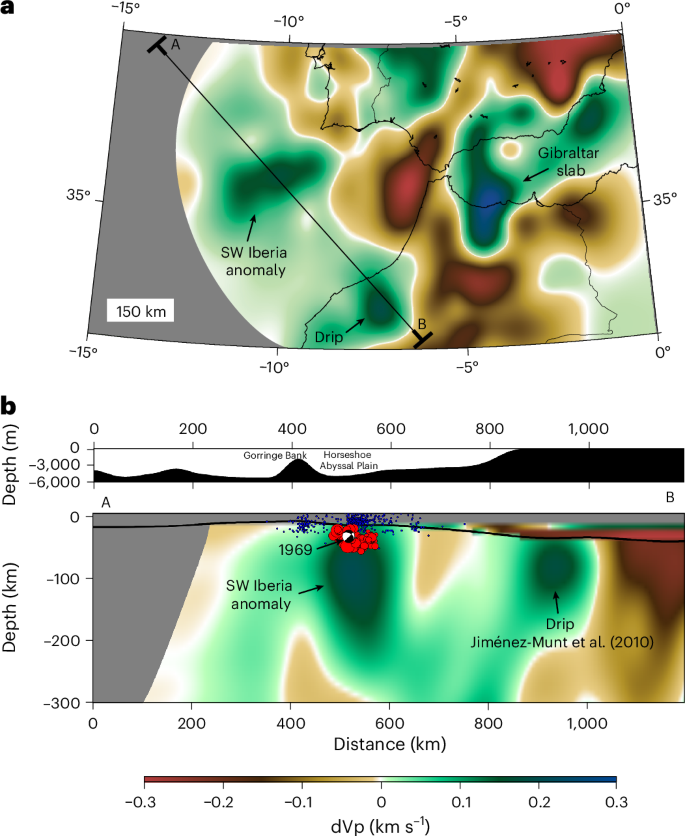
a, Slice at a sublithospheric depth of 150 km. b, Cross-section A–B cutting across the high-velocity anomaly off SW Iberia (dVp is the P-wave velocity anomaly). Strikingly, this anomaly is located precisely below the flat Horseshoe Abyssal Plain, the region where the 1969 earthquake occurred (‘beach-ball’), which was the strongest instrumental thrust event ever registered in Europe and Africa. In this region, there is also a cluster of relatively deep hypocentres (down to 60 km depth; red circles) that were recorded during the NEAREST OBS experiment (Extended Data Fig. 3). Note that the Gorringe Bank is located to the NE of this feature. Blue dots are the background seismicity recorded by the IPMA land seismic network between 2000 and 2015, which underestimates the depth of the hypocentres (see ref. 23 for a discussion). A resolution test is provided in Extended Data Fig. 5. We also identified a second object below the continental lithosphere in Morocco that could correspond to a drip discussed in ref. 22, although the authors discuss the existence of only one drip, while our new tomographic model suggests the existence of two. Tomography basemap and profile were generated using FMTOMO and GMT (https://nickrawlinson.com/fmtomo/; https://www.generic-mapping-tools.org/) with data available at https://ds.iris.edu/ds/products/emc-ibem-p18ibem-s19/. Seismicity data are available at http://www.isc.ac.uk.
More recently, a cluster of earthquakes located below the Horseshoe Abyssal Plain was characterized in detail using the NEAREST OBS experiment18,23. These earthquakes occur at depths of 20–60 km, within the lithospheric mantle (Fig. 2 and Extended Data Fig. 2). The small number of earthquakes above 20 km suggests mechanical decoupling between the unserpentinized lithospheric mantle (below 20 km) and a roofing serpentinized mantle layer and crust23. A seismic refraction study12 further revealed that the basaltic oceanic crust is missing in the Horseshoe Abyssal Plain and that the sedimentary cover lies directly on top of serpentinized lithospheric mantle (varying between 5 km and 10 km in thickness), while to the south of the plate boundary, the African domain is made of a thin basaltic oceanic crust (Extended Data Figs. 1 and 6). This is because the West Iberia margin is a hyperextended non-volcanic rifted margin that underwent mantle exhumation during the first stages of seafloor spreading, without the generation of pervasive melts and the formation of a proper basaltic crust12,24 (Fig. 1). To the west, the Gloria Fault also shows signs of serpentinization up to depths of 12 km in a segment where the crustal age is 60 Ma (ref. 25). A recent study in the equatorial Atlantic also showed that relatively young segments of oceanic transform faults (for example, Romanche) can have serpentinization fronts that can extend down to depths of 16 km (ref. 26). This suggests that deep serpentinization is not confined to the margin but may extend along the oceanic transform faults and fracture zones.
A mechanism that would explain these observations is the mechanical decoupling and removal of the lithospheric mantle, in a process akin to delamination or peeling, comparable to what is sometimes observed under continental orogens and/or collision zones27,28,29,30. In our case, delamination is triggered by plate convergence, as in the classical delamination model by Peter Bird31. We propose that the weak serpentinized lithospheric mantle acts as a layer that decouples the positively buoyant sedimentary crust from the underlying negatively buoyant lithospheric mantle. The fact that the delaminating block is vertically limited by two weak zones (Gloria and Tydeman) leads to the downward extraction (delamination) of a lower lithospheric mantle block. Such a process would explain why shortening at crustal levels is substantially less than would be implied by the existence of a typical subduction-related lithospheric slab penetrating the asthenosphere to depths of more than 200 km. Besides, if the delaminating block is still attached to the surface, it may continue to pull the crust down, explaining the sag of the Horseshoe Abyssal Plain and the formation of the thick sedimentary infill.
Simulations of oceanic plate delamination
To test this hypothesis, we carried out two-dimensional (2D) numerical models using the code Underworld32. The models include two oceanic lithospheric plates simulating Africa and Eurasia (Methods and Extended Data Fig. 7). A far-field convergence velocity of 8 mm yr−1 was imposed on the African lithosphere (Fig. 3); this value is higher than the present-day 4 mm yr−1 to account for the faster velocities during the Cenozoic33. The Eurasian plate lacks a well-developed basaltic crust, which is instead replaced by a weak 10-km-thick serpentinized layer, mimicking the structure obtained by refraction data12 (Extended Data Fig. 7). We tested the existence of either a single boundary separating the two plates (a weak fault zone) or a plate boundary zone limited by two main vertical fault zones, which more closely resembles the structure of the less compressionally deformed plate boundary zone that is observed further to the west (mimicking the Gloria Fault and the Tydeman Fracture; Fig. 1). A full parametric study is provided in the Supplementary Information (Supplementary Figs. 1–10 and Supplementary Table 2).
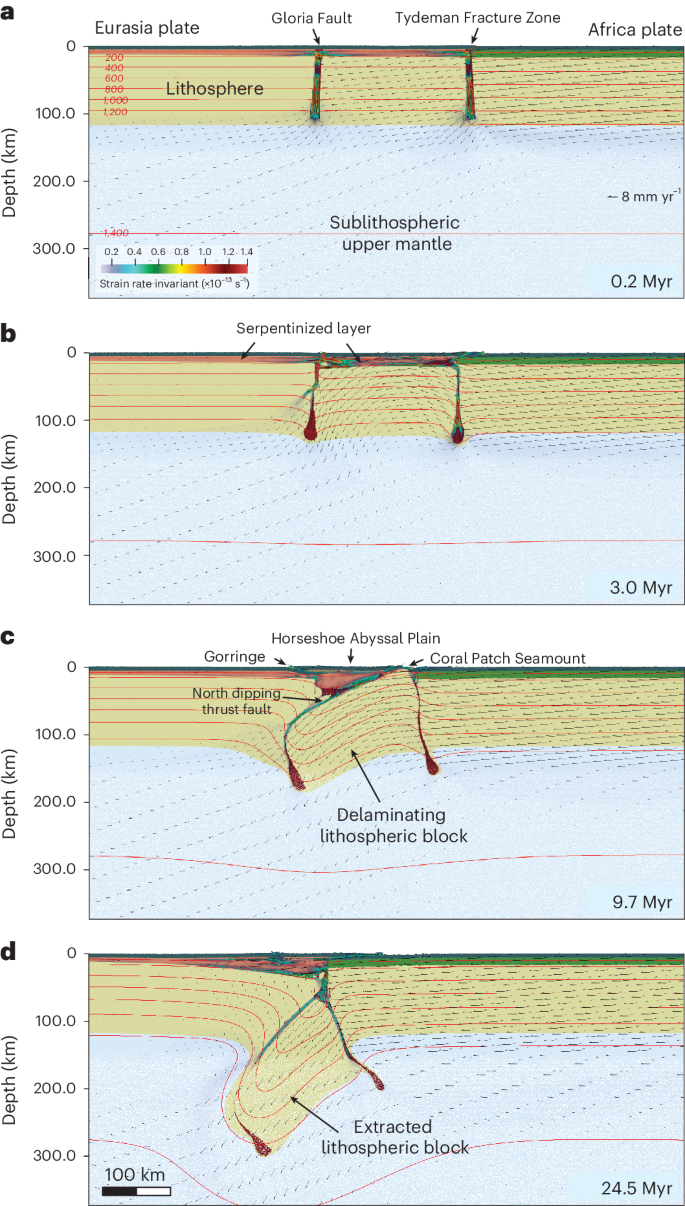
The modelling section aims at investigating processes occurring along a NW–SW direction (profile in Fig. 2). a, Initial stage of the model. b, Model evolution after 3.0 Myrs. c, Model evolution after 9.7 Myrs, corresponding to present-day conditions. d, Model evolution after 24.5 Myrs, corresponding to future conditions. Note the formation of a flake-like structure in c with a Gorringe-like south-dipping thrust at crustal levels and a deeper lithospheric north-dipping fault below a flat region comparable with the Horseshoe Abyssal Plain, where a 1969-like event may have occurred (see schematic illustration in Fig. 4). This model shows that under these circumstances the oceanic lithospheric mantle may delaminate and be extracted, leading to unexpected lithospheric configurations similar to the ones observed offshore Southwest Iberia. The black arrows represent velocity vectors, and the red lines indicate isotherms in degrees Celsius. Strain rate for values higher than 0.1 × 10⁻¹³ s−1 are also shown. Beige colour: lithospheric mantle; light green: basaltic oceanic crust; salmon: serpentinized mantle; dark green: sedimentary crust; reddish: weak zones. Model outputs were generated using ParaView (https://www.paraview.org/); data and scripts are available via Zenodo at https://doi.org/10.5281/zenodo.15846292 (ref. 50).
In the model with one plate boundary, the vertical weak zone is converted into an incipient subduction zone, with the thinner (Eurasia) plate subducting under the thicker one (Africa) (Supplementary Fig. 6 and Supplementary Video 1). In this case, the weaker serpentinized mantle on the Iberian side is converted into a subduction channel with the overlying crust accommodating about 200 km of displacement, which is not observed in the natural example. In the model with two vertical weak zones, something different and unexpected occurs. The block limited by the two weak zones sinks to the north under the Eurasian plate (Fig. 3, Supplementary Video 2 and Supplementary Fig. 9), facilitated by the second weak zone and the thinner Eurasian plate. The subhorizontal weak serpentinized layer thickens and accommodates most of the shortening, noticeably decoupling the bulk deep deformation from the crust. A new main north-dipping fault forms at the contact between a detaching lithospheric mantle block and the overlying serpentinized mantle (and crust). Right above this main fault, the sedimentary crust remains relatively flat. Surface deformation is accommodated mostly at the limits of the detaching block. Interestingly, a south-dipping low-angle thrust forms in the sedimentary cover (in a Gorringe-like location; Figs. 3c and 4). Deformation (shortening) at crustal levels is less pervasive than that at deeper levels because most of the shallower deformation is accommodated within the weak serpentinized mantle. The overall geometry of the body resembles a case of flake tectonics10,27, with a block of lithospheric mantle descending into the asthenosphere, driven by the plate’s motion and its own negative buoyancy. To test whether the sinking lithospheric block was partially driven by its weight, we ran an additional model similar to the one shown in Fig. 3, but in which the convergence was stopped after 18 Myrs (Supplementary Fig. 10). The results showed that the block continued to sink independently. The full parametric study also revealed that lithospheric delamination and extraction occur only in models featuring a 10 km-thick serpentinized layer and two vertical weak (fault) zones (Supplementary Figs. 1–9).
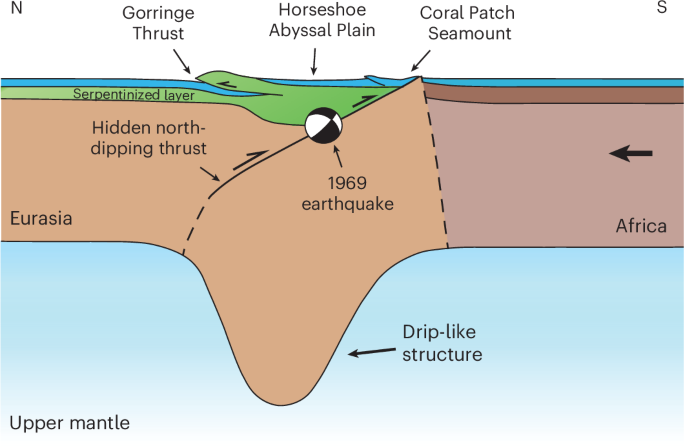
A delaminating block could reproduce the structure observed in the tomography model. The serpentinized layer decouples the crustal deformation from the one occurring at deeper lithospheric levels, giving rise to a flake-like structure, forming the south-dipping Gorringe thrust and the north-dipping fault associated with the 1969 earthquake.
At first order, the numerical model with the two weak fractures explains most of the observations (Fig. 4): (1) the existence of a fast seismic velocity anomaly that could reach depths of ~200 km below the flat Horseshoe Abyssal Plain limited by two deforming regions (that could mimic the Gorringe Bank, to the north, and the Coral Patch Ridge, to the south; Fig. 1); (2) the decoupling of the less deformed crust, with the formation of a major low-angle fault dipping to the south (mimicking the Gorringe northern thrust), from the underlying unserpentinized lithosphere; (3) the existence of a blind large north-dipping fault separating the delaminating block from the overriding block; (4) this fault would be responsible for the observed low-to-moderate seismicity at depths of 20–60 km and could have been the elusive source of the 1969 earthquake.
It is important to note that, although our model fits a number of observations, we cannot fully rule out alternative scenarios12,17,18 involving ongoing subduction initiation with the development of a proper slab. Notwithstanding, in such scenarios, the 200-km-deep block imaged by the tomography is difficult to reconcile with the relatively low amount of shortening observed at crustal levels. A more complex structure is necessary to explain the observations10. A previous work12 detected a potentially blind subcrustal structure below the Horseshoe Abyssal Plain, which has been interpreted as a SW dipping thrust fault. However, the profile crosscuts the structure near the intersection with a major strike-slip fault, and it is unclear how this would affect their model and interpretation. Nonetheless, it cannot be ruled out that the natural structure may have a more complex three-dimensional (3D) geometry with various levels of decoupling. Further work is needed to image the internal structure of the lithosphere (for example, refraction and teleseismic data) and clarify what tectonic processes are occurring in the area. Available seismic reflection data provide only a glimpse of the lithospheric structure (up to a depth of 10 km), in a region where the major seismogenic structures are located at depths of around 30 km.
Even though we do not yet fully comprehend what the expression of oceanic delamination would be, we can gain insight from what we know about continental delamination. In continents, a thermal anomaly is expected to be observed 10 Myrs after the process has started31. However, in the study region, the ongoing convergence may close any lithospheric gap, preventing the hot asthenosphere from rising. This may explain why there is no evident thermal anomaly in the region, although more detailed work would be needed to confirm it. Furthermore, in a scenario of spontaneous delamination driven solely by gravity, a positive Bouguer anomaly would be expected31. However, in the case of forced delamination, where a lithospheric block is being pushed down and the asthenospheric gap is being closed, a negative anomaly just above the sinking block would be expected instead. Meanwhile, a positive anomaly should be detectable where the serpentinized mantle is protruding (in the Gorringe Bank). This is precisely what the data show4,10: a positive Bouguer anomaly in the Gorringe Bank and a negative Bouguer anomaly in the Horseshoe Abyssal Plain. Finally, other evidence of a sinking lithospheric block is the 3–4-km-thick Cenozoic sedimentary layer flooring the Horseshoe Abyssal Plain. Such a layer requires accommodating space and is indirect evidence that the Horseshoe Abyssal Plain is being pulled down as a whole.
Implications for seismicity and subduction initiation
We have estimated a potential rupture area of ~20,000 km2 for a fault based on the along-strike length of the tomographic anomaly (~160 km) and the dip angle obtained from 1969 focal mechanism4 (Supplementary Figs. 11 and 12). According to our calculations, this fault would generate an M8.6 event (with an average fault slip of 8.7 m) in case of a full rupture and an M8 earthquake (with an average slip of 3.7 m) for a partial rupture of 80 km, which is the rupture length proposed for the 1969 event4. This would solve the long-lasting problem of the apparent inexistence of a fault with the characteristics necessary to explain the occurrence of very high-magnitude events in the region, including the Great Lisbon Earthquake of 1755.
Our identification of what could be the first example of oceanic lithosphere delamination also has important geodynamic implications. In the studied case, delamination is forced by the convergence between Africa and Eurasia, facilitated by a serpentinization front that mechanically decouples the crust from the underlying lithospheric mantle, located between two fracture zones. The lack of other obvious examples worldwide suggests the process may occur only under very specific conditions: it may require an old, thick and serpentinized oceanic lithosphere, with preexistent weak zones subject to a minimum amount of convergence. These conditions may occur only at old, hyperextended magma-poor margins and/or diffuse plate boundaries. There is also an observational challenge: the process is not easily detectable at the surface.
Although oceanic delamination may be rare in the present-day Earth, it might have been more common in periods over which wider areas of older and unstable oceanic lithosphere covered the Earth’s seafloor (for example, during late stages of oceans’ Wilson cycles) and potentially earlier in the Earth’s history (for example, in the Archaean). Recent geodynamic models34 suggested the early Earth’s lid might have been covered by a 50-km-thick serpentinized layer. Such early serpentinization was probably facilitated by the fracturing of the crust and exposure of mantle rocks by meteoritic impacts35. There is also evidence that early Earth delamination had an important role in the differentiation of the first continental blocks, before the kickstart of proper subduction zones36,37.
Although, currently, delamination of oceanic lithosphere does not seem to be a widespread mechanism for the recycling of oceanic plates, it may still have an important role in the early stages of subduction initiation. Subduction initiation in Atlantic-type oceans requires the fracturing and bending of a plate, conditions that may not be easy to achieve in the interior of Atlantic-type oceans38,39,40,41,42. Even when the lithosphere is already prefractured (for example, along a fracture zone), forces of sufficient magnitude to bend and pull down the lithosphere typically do not exist until subduction becomes self-sustaining38,40,43. Therefore, a forcing (for example, a preexistent convergence and/or a far-field stress), as well as additional weakening mechanisms (for example, hydration of the oceanic lithosphere/serpentinization), might be required to initiate subduction. These are precisely the conditions observed in the study region. There is ongoing oblique convergence between Africa and Eurasia, and compressive stresses might be propagating from the Gibraltar subduction system3. In addition, there is an old segment of serpentinized lithosphere between two active fracture/fault zones that corresponds to the limit of a hyperextended magma-poor margin. The evidence here presented, including (1) relatively deep high magnitude seismicity, (2) limited shortening at crustal levels, (3) lack of a trench and (4) evidence for a sinking lithospheric block, suggests we are dealing with oceanic plate delamination. Previous work31 comparing the processes of delamination and subduction, two modes of lithospheric recycling, suggests that delamination may require less mechanical work than subduction. This may explain why, under specific conditions, delamination may precede (and even facilitate) subduction initiation. Once part of the lithosphere starts to sink by delamination, subduction may be easily initiated (model 9 in Supplementary Fig. 9).
Conceptual model of oceanic plate delamination
A possible evolutionary model for the region is as follows (Fig. 5). The continued convergence between Africa and Eurasia, and the peak of the Betics orogeny around 10 Ma related to the formation of the Gibraltar Arc33, led to the reactivation in compression of two Atlantic fracture zones located offshore SW Iberia: Gloria and Tydeman (Fig. 5a). In the Horseshoe Abyssal Plain region, the presence of a serpentinized layer and absence of a proper basaltic oceanic crust led to the separation of the lithospheric mantle from the overlying sedimentary crust (Fig. 5b). The two fracture zones isolated a lithospheric block undergoing delamination that began sinking northwards, leading to the formation of a major thrust fault at the present-day location of high-magnitude seismicity (for example, the 1969 earthquake, and possibly the 1755 Great Lisbon Earthquake). This block has been imaged using seismic tomography. Our geodynamic model suggests that, if the process continues, the block between the two fractures will eventually be extracted (Fig. 5c) and the Eurasian lithosphere will start sinking below the African plate, forming a new subduction interface (Fig. 5d). By this time, the Gibraltar Arc44 may have already reached this area, and the two systems may have coalesced into a new Atlantic subduction system that, together with the Lesser Antilles45 and the Scotia46 arcs, could lead to the consumption of the Atlantic Ocean3,47.
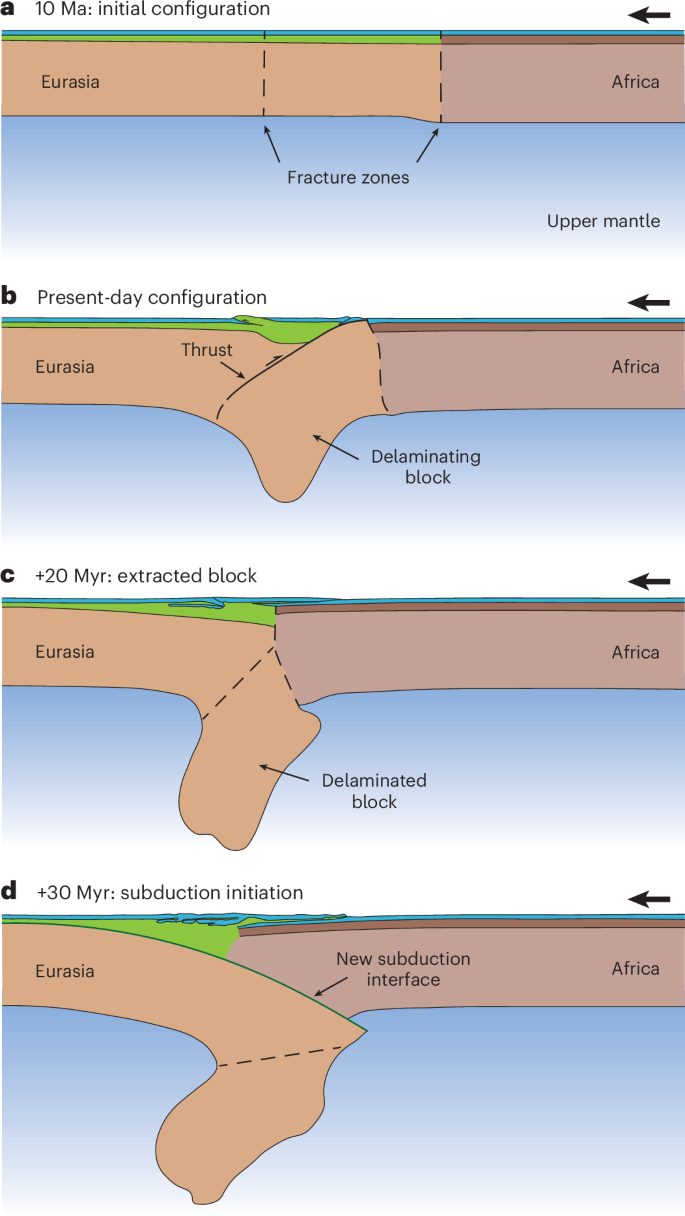
a, Initial configuration. b, Present-day situation with a delaminating block with a major thrust below the Horseshoe Abyssal Plain. c, Future evolution with the extraction of the delaminated lithospheric block. d, Initiation of a subduction zone.
Methods
Seismic tomography
The tomography model19 resulted from the integration of broadband teleseismic P-wave travel-time data, recorded between 2007 and 2013, from 387 seismic land stations deployed throughout the Ibero-Maghrebian region (Extended Data Fig. 3). To obtain good ray coverage offshore SW Iberia, 24 temporary broadband OBSs deployed during the NEAREST experiment between 2007 and 2008 were included51, which were crucial to robustly image the investigated region. Data from five additional broadband OBSs from the TOPOMED project, recorded between 2009 and 2010, were also added52.
A total of 25,644 arrival-time residuals from 451 teleseismic events, with a moment magnitude of at least 5.5, in the teleseismic epicentral distance range 30° < Δ < 95° were examined. All the recorded traces were aligned using predictions from the global reference model ak13553 and low-pass filtered at 5 Hz. The adaptive stacking procedure54 was then used to achieve final alignment, thus obtaining a set of arrival time residual estimates for each source.
The structure is represented by a regular grid of nodes spaced 0.4° in latitude and longitude and ~35 km in depth, extending from the Moho down to 800-km depth.
Relative arrival-time residuals were inverted using the FMTOMO package55 to recover the upper mantle seismic structure (https://nickrawlinson.com/fmtomo/). FMTOMO solves the forward problem of travel-time prediction using a grid-eikonal solver, known as the Fast Marching Method56,57,58. Model parameters are adjusted with a subspace inversion technique59. The forward and inverse steps are applied iteratively to address the weakly nonlinear nature of the inverse problem. Because Moho topography and crustal velocity structure can have a noticeably influence on teleseismic travel times60, an a priori 3D crust and Moho model (PRISM3D) was applied to the starting model19, which has the effect of correcting for unresolved crustal contributions to the measured arrival-time residuals60,61.
Tomography resolution test
To test the resolving ability of our dataset offshore SW Iberia, we performed a synthetic spike resolution test, where two input velocity anomalies with a width of ~100 km and an amplitude of 0.30 km s−1 were superimposed on our starting model at a depth of ~90 km (Extended Data Fig. 5). The comparison between the input and output models suggests a good resolution for high-velocity features in the uppermost mantle, although some horizontal and vertical smearing occurs. Nonetheless, the separate input anomalies can be clearly identified. This further supports that the high-velocity anomaly imaged in the tomography is a real feature and not an artefact of the inversion.
Numerical modelling
Modelling strategy
We have developed numerical models to investigate the processes of oceanic delamination that are arguably occurring in the Southwest Iberian Margin. The aim of these models was not to reproduce the natural example in all its complexity but to simulate first-order processes. Our modelling strategy was the following: (1) integrate and interpret geological and geophysical data; (2) develop a conceptual model that allows explaining the data; (3) develop a simplified numerical simulation that allows testing systematically different variables (individually and combined) that control the first-order processes encompassed by our conceptual model; (4) obtain a new physical understanding of the driving, resisting and facilitating mechanisms at stake (that is, improve our conceptual model); (5) use this understanding to improve our knowledge about the natural prototype.
Mathematical formulation
We use Underworld to solve the equations of momentum, continuity and energy and to track material properties62. The continuity and the momentum equations are given by
$$\nabla \cdot {\bf{v}}=0$$
(1)
and
$$\nabla \cdot {\bf{\upsigma }}={{\rho }}{\bf{g}}$$
(2)
in which \({\bf{v}}\) is the velocity vector, \({\bf{\upsigma }}\) the stress tensor, \({{\rho }}\) the density and \({\bf{g}}\) the gravity acceleration vector. The stress tensor is given by
$${\bf{\upsigma }}={{\bf{\upsigma }}}^{{\prime} }-{{P}}{\bf{I}}$$
(3)
in which \({{\bf{\upsigma }}}^{{{{\prime} }}}\) is the deviatoric stress tensor, P the pressure and \({\bf{I}}\) the identity tensor.
The deviatoric stress tensor (\({{\bf{\upsigma }}}^{{{{\prime} }}}\)) is defined as a function of both strain rate and effective viscosity:
$${{\bf{\upsigma }}}^{{{{\prime} }}}=2{{{\eta }}}_{{\rm{eff}}}\dot{{\boldsymbol{\varepsilon }}},$$
(4)
with \({{{\eta }}}_{{\rm{eff}}}\) being the effective viscosity and \(\dot{{\boldsymbol{\varepsilon }}}\) the strain rate tensor defined as
$$\dot{{\boldsymbol{\varepsilon }}}=\frac{1}{2}\left[\nabla {\bf{v}}+{\left(\nabla {\bf{v}}\right)^{\rm{T}}}\right].$$
(5)
The heat equation is given by
$${{\rho }}{{{C}}}_{{\rm{p}}}\left(\frac{\partial {{T}}}{\partial {{t}}}+{\bf{v}}\cdot \nabla {{T}}\right)={{\kappa }}{\nabla }^{2}{{T}}+{{{H}}}_{{\rm{s}}}+{{{H}}}_{{\rm{A}}}$$
(6)
in which \({{{C}}}_{{\rm{p}}}\) is the specific heat, T the temperature, t the time, \({{\kappa }}\) the thermal diffusivity, \({{{H}}}_{{\rm{s}}}\) the shear heating and \({{{H}}}_{{\rm{A}}}\) the adiabatic heating. The shear heating term is given by
$${{{H}}}_{{\rm{s}}}={{\bf{\upsigma }}}^{{{{\prime} }}}:\dot{{\mathbf{\epsilon}}}.$$
(7)
The adiabatic heating term is given by
$${{{H}}}_{{\rm{A}}}=\frac{-{{T}}{{\alpha }}{{\bf{v}}}_{{\bf{y}}}{\rm{g}}}{{{{c}}}_{{\rm{p}}}},$$
(8)
with \({\rm{\alpha }}\) corresponding to the thermal expansivity and \({{\bf{v}}}_{{\bf{y}}}\) representing the vertical velocity.
The effective viscosity is nonlinear and calculated according to the following model:
$${\eta }_{\rm{eff}}={A}^{-\frac{1}{n}}\,{\dot{\epsilon }}^{\frac{1}{n}-{n}}\mathrm{exp}\left(\frac{{E}_{\rm{a}}+{V}_{\rm{a}}{P}}{nRT}\right),$$
(9)
with A being the preexponential factor, n the stress exponent, \({{{E}}}_{{\rm{a}}}\) the activation energy, \({{{V}}}_{{\rm{a}}}\) the activation volume and R the universal gas constant.
Compressibility for lower crustal and mantle rheologies is achieved by relaxing the incompressible constraint of equation (1) such as
$$\nabla \cdot {\bf{v}}=-\frac{{{P}}}{{{\lambda }}}$$
(10)
in which \(\lambda\) is a parameter equivalent to viscosity.
Plastic deformation is modelled using the Drucker–Prager yield criterion, in which the material yields when the applied stress exceeds the yield strength:
$$\sqrt{{{{\bf{\upsigma }}}^{{{{\prime} }}}}_{{\bf{II}}}}={{p}}\sin \left({\rm{\phi }}\right)+{{C}}\cos \left({\rm{\phi }}\right),$$
(11)
with \({{{\bf{\upsigma }}}^{{{{\prime} }}}}_{{\bf{II}}}\) representing the second invariant of the deviatoric stress tensor, \(\phi\) the internal friction angle and C the cohesion. Strain weakening is modelled by linearly decreasing the internal frictional angle and cohesion as accumulated brittle strain increases up to 50% (Supplementary Table 1).
Model description and assumptions
The models consist of a 2,800 × 660 km 2D box with a resolution of 1,400 × 200 finite elements (Extended Data Fig. 7). The grid spacing is non-uniform along the vertical axis with an element size of 1.25 km in the lithosphere and 5.0 km in the upper mantle. The modelled region comprises a 15-km-thick air layer, and two oceanic plates embedded in a 660-km-deep upper mantle. The plate on the right represents an older (and thicker) Africa-like oceanic plate covered by a 10-km-thick basaltic crust overlaid by a 5-km-thick sedimentary layer. The plate on the left simulates a younger Eurasia-like oceanic plate in which the basaltic crust is replaced by a 10-km-thick serpentinized upper mantle layer (and eventually hydrated, but almost non-existent, basaltic crust) that tapers to the north. Note that the thickness of the plates is given by their thermal structure, with the lithosphere–asthenosphere boundary corresponding to the 1,200 °C isotherm. The crustal and upper mantle structures, including the potential extent of serpentinization, are compiled from different sources cited in the text, but particularly inspired by an existing seismic refraction profile12 (Extended Data Fig. 6).
The rheological parameters used in this study are presented in Supplementary Table 1. The initial temperature profiles of the oceanic plates are prescribed according to the half-space cooling model63. The thickness of the boundary layer is chosen to be 100 km, and the half-space cooling age is 120 and 170 Myr for the northern and southern segments, respectively.
To investigate the role of preexistent weak fracture or fault zones and the influence of a serpentinization layer in the process of delamination, we devised a parametric study. The models were run with three configurations: no vertical weak zones, one vertical weak zone and two vertical weak zones spaced by 200 km (the vertical weak zones were 90 km deep and 10 km wide). For each of these configurations, we run models without a serpentinized weak layer, with a 5-km-thick serpentinized layer and with a 10-km-thick serpentinized layer, totalling nine models (see models D1 to D9 in Supplementary Table 2). Model D9 is the one that more faithfully resembles our natural prototype and is, therefore, our reference model. For the reference model, we also tested a case in which the convergence was stopped after 18 Myr (model D10). Although convergence never ceased in our natural example, this approach allowed us to test whether the sinking of the block could include a gravity-driven component.
The boundary conditions were set to be no slip on the bottom, free slip on the sides and free surface on the top. To simulate the northward motion of the African plate, a velocity of 8 mm yr−1 was imposed on the southern oceanic plate while the northern segment was kept fixed. This velocity is representative of the Cenozoic Africa–Eurasia convergence velocity. During this period, Eurasia remained largely stationary, while Africa moved northwards, driven by subduction zones along the Tethys Ocean. However, this convergence slowed down in the last million years due to continental collisions along the peri-Mediterranean orogens (for example, Betics and Rif). Furthermore, the study region is close to the African pole of rotation, and, therefore, we opted to use a relatively slow convergence velocity of 8 mm yr−1, slightly higher than the present day, to account for slightly higher past values. Notwithstanding, we performed kinematic sensitivity tests by running the reference model at 2, 4, 6 and 8 mm yr−1. The results were similar, with only the total time required to reach the same outcome varying proportionally.
We opted for using a 2D approach for two reasons: (1) the feature interpreted as a delaminating block is elongated along a WSW–ENE direction, which is perpendicular to the convergence direction (Fig. 2 and Extended Data Figs. 2 and 4), and, therefore, the process is symmetric about a NW–SE plane; (2) the numerical model serves as a proof of concept, developed to test the feasibility of the delamination process and to identify the parameters that control it. Given the complexity of the region, a 3D model would have to incorporate many second- and third-order features that would increase the complexity of the model and decrease our capacity to learn from it.
Data availability
Bathymetry data used to produce the base maps of Fig. 1 and Extended Data Fig. 1 are available via the General Bathymetric Chart of the Oceans (GEBCO) website at https://www.gebco.net/. The base map in Fig. 1 was produced using ArcGIS software by Esri through an educational licence. The base map in Extended Data Fig. 1 was produced using The Generic Mapping Tools (GMT64) available at https://www.generic-mapping-tools.org/. The tomography data used to create the base maps and profiles in Fig. 1, Extended Data Fig. 2 and Supplementary Fig. 11 are available via the IRIS server at https://doi.org/10.17611/dp/emcibemp18s19. The maps and diagrams in Fig. 2 and Extended Data Figs. 2, 4 and 5 were created using GMT (https://www.generic-mapping-tools.org/). Figure 3 and Supplementary Figs. 1–10 were produced with ParaView, an open-source, multi-platform data analysis and visualization application (https://www.paraview.org/) with data available via Zenodo at https://doi.org/10.5281/zenodo.15846292 (ref. 50). Scripts, input files and instructions to perform the numerical simulations, process the outputs and produce the figures with ParaView are available via Zenodo at https://doi.org/10.5281/zenodo.15846292 (ref. 50). Earthquake data are available via the International Seismological Centre (ISC) at http://www.isc.ac.uk. The NEAREST OBS deployment data used in Fig. 2 and Extended Data Fig. 2 are available at http://www.isc.ac.uk/cgi-bin/agency-get?agency=INMG, http://www.isc.ac.uk/cgi-bin/serve_contribution?repid=300001482 and http://www.isc.ac.uk/cgi-bin/serve_contribution?repid=300001482.
Code availability
The tomography model was created using FMTOMO (https://nickrawlinson.com/fmtomo/), which is freely available via GitHub at https://github.com/nrawlinson/FMTOMO (refs. 55,56). The numerical simulations were performed using the open-source code Underworld, available at https://www.underworldcode.org/. Scripts, input files and instructions to perform the numerical simulations, process the outputs and produce the figures with ParaView were are available via Zenodo at https://doi.org/10.5281/zenodo.15846292 (ref. 50).
References
Grimison, N. L. & Chen, W. P. The Azores–Gibraltar plate boundary: focal mechanisms, depths of earthquakes, and their tectonic implications. J. Geophys. Res. Solid Earth 91, 2029–2047 (1986).
Nocquet, J. M. Present-day kinematics of the Mediterranean: a comprehensive overview of GPS results. Tectonophysics 579, 220–242 (2012).
Duarte, J. C. et al. Are subduction zones invading the Atlantic? Evidence from the southwest Iberia margin. Geology 41, 839–842 (2013).
Fukao, Y. Thrust faulting at a lithospheric plate boundary: the Portugal earthquake of 1969. Earth Planet. Sci. Lett. 18, 205–216 (1973).
Custódio, S., Lima, V., Vales, D., Cesca, S. & Carrilho, F. Imaging active faults in a region of distributed deformation from the joint clustering of focal mechanisms and hypocenters: application to the Azores–Western Mediterranean region. Tectonophysics 676, 70–89 (2016).
Baptista, M. A., Miranda, P. M. A., Miranda, J. M. & Victor, L. M. Constrains on the source of the 1755 Lisbon tsunami inferred from numerical modelling of historical data on the source of the 1755 Lisbon tsunami. J. Geodyn. 25, 159–174 (1998).
Martinez Solares, J. & Lopez Arroyo, A. The great historical 1755 earthquake, effects and damage in Spain. J. Seismol. 8, 275–294 (2004).
Gutscher, M.-A. What caused the Great Lisbon Earthquake? Science 305, 1247–1248 (2004).
Stucchi, M. et al. The SHARE European Earthquake Catalogue (SHEEC) 1000–1899. J. Seismol. 17, 523–544 (2013).
Purdy, G. M. The eastern end of the Azores–Gibraltar plate boundary. Geophys. J. R. Astron. Soc. 43, 973–1000 (1975).
Zitellini, N. et al. The quest for the Africa–Eurasia plate boundary west of the Strait of Gibraltar. Earth Planet. Sci. Lett. 280, 13–50 (2009).
Martínez-Loriente, S. et al. Seismic and gravity constraints on the nature of the basement in the Africa–Eurasia plate boundary: new insights for the geodynamic evolution of the SW Iberian Margin. J. Geophys. Res. 119, 127–149 (2014).
Zitellini, N. et al. Source of the 1755 Lisbon earthquake and tsunami investigated. Eos, Trans. Am. Geophys. Union 82, 285 (2001).
Gutscher, M.-A. et al. Evidence for active subduction beneath Gibraltar. Geology 30, 1071–1074 (2002).
Grácia, E., Danõbeitia, J. J., Vergés, J. & PARSIFAL team. Mapping active faults offshore Portugal (36°N–38°N): implications for seismic hazard assessment along the southwest Iberian margin. Geology 31, 83–86 (2003).
Rosas, F. M., Duarte, J. C., Schellart, W. P., Tomás, R. & Terrinha, P. Seismic potential of thrust-wrench tectonic interference between major active faults offshore SW Iberia. Geophys. Monogr. Ser. 210, 193–217 (2016).
Martínez-Loriente, S., Sallarès, V. & Gràcia, E. The Horseshoe Abyssal Plain Thrust could be the source of the 1755 Lisbon earthquake and tsunami. Commun. Earth Environ. 2, 145 (2021).
Monna, S. et al. New insights from seismic tomography on the complex geodynamic evolution of two adjacent domains: Gulf of Cadiz and Alboran Sea. J. Geophys. Res. Solid Earth 118, 1587–1601 (2012).
Civiero, C. et al. A common deep source for upper‐mantle upwellings below the Ibero‐western Maghreb region from teleseismic P‐wave travel‐time tomography. Earth Planet. Sci. Lett. 499, 157–172 (2018).
Hayward, N., Watts, A. B., Westbrook, G. K. & Collier, J. S. A seismic reflection and GLORIA study of compressional deformation in the Gorringe Bank region, eastern North Atlantic. Geophys. J. Int. 138, 831–850 (1999).
Galindo-Zaldívar, J., Maldonado, A. & Schreider, A. A. Gorringe Ridge gravity and magnetic anomalies are compatible with thrusting at a crustal scale. Geophys. J. Int. 153, 586–594 (2003).
Jiménez-Munt, I. et al. The lithospheric structure of the Gorringe Bank: insights into its origin and tectonic evolution. Tectonics 29, TC5019 (2010).
Silva, S. et al. Micro-seismicity in the Gulf of Cadiz: is there a link between micro-seismicity, high magnitude earthquakes and active faults? Tectonophysics 717, 226–241 (2017).
Granado, C. et al. 3D crustal-scale structure of the West Iberia margin: a novel approach to integrated structural characterization of passive margins. Mar. Geophys. Res. 42, 10 (2021).
Batista, L. et al. Crustal structure of the Eurasia–Africa plate boundary across the Gloria Fault, North Atlantic Ocean. Geophys. J. Int. 209, 713–729 (2017).
Wang, Z. et al. Deep hydration and lithospheric thinning at oceanic transform plate boundaries. Nat. Geosci. 15, 741–746 (2022).
Oxburgh, E. R. Flake tectonics and continental collision. Nature 239, 202–204 (1972).
Bird, P. Initiation of intracontinental subduction in the Himalaya. J. Geophys. Res. Solid Earth 83, 4975–4987 (1978).
Moore, V. M. & Wiltscko, D. Syncollisional delamination and tectonic wedge development in convergent orogens. Tectonics 23, TC2005 (2004).
Göğüş, O. H. & Ueda, K. Peeling back the lithosphere: controlling parameters, surface expressions and the future directions in delamination modeling. J. Geodyn. 117, 21–40 (2018).
Bird, P. Continental delamination and the Colorado plateau. J. Geophys. Res. Solid Earth 84, 7561–7571 (1979).
Moresi, L.-N., Betts, P. G., Miller, M. S. & Cayley, R. A. Dynamics of continental accretion. Nature 508, 245–248 (2014).
Rosenbaum, G., Lister, G. S. & Duboz, C. Relative motions of Africa, Iberia and Europe during Alpine orogeny. Tectonophysics 359, 117–129 (2002).
Reynard, B., Ganzhorn, A.-C. & Coltice, N. Primordial serpentinized crust on the early Earth. Phys. Earth Planet. Inter. 332, 106936 (2022).
Johnson, T. E. et al. Giant impacts and the origin and evolution of continents. Nature 608, 330–333 (2022).
Zegers, T. E. & van Keken, P. E. Middle Archean continent formation by crustal delamination. Geology 29, 1083–1086 (2001).
Foley, S., Buhre, S. & Jacob, D. Evolution of the Archaean crust by delamination and shallow subduction. Nature 421, 249–252 (2003).
Cloetingh, S., Wortel, M. & Vlaar, N. Evolution of passive continental margins and initiation of subduction zones. Nature 297, 139–142 (1982).
Stern, R. J. & Gerya, T. Subduction initiation in nature and models: a review. Tectonophysics 746, 173–198 (2018).
McKenzie, D. P. The initiation of trenches: a finite amplitude instability. In Island Arcs, Deep Sea Trenches and Back‐Arc Basins Vol. 1 (eds Talwani, M. & Pitman W. C. III) 57–61 (American Geophysical Union, 1977).
Nikolaeva, K., Gerya, T. V. & Marques, F. O. Numerical analysis of subduction initiation risk along the Atlantic American passive margins. Geology 39, 463–466 (2011).
Nikolaeva, K., Gerya, T. V. & Marques, F. O. Subduction initiation at passive margins: numerical modeling. J. Geophys. Res. Solid Earth 115, B3 (2010).
Gurnis, M., Hall, C. & Lavier, L. Evolving force balance during incipient subduction. Geochem. Geophys. Geosyst. 5, 1–31 (2004).
Duarte, J. C. et al. Gibraltar subduction zone is invading the Atlantic. Geology 52, 331–335 (2024).
Riel, N. et al. Subduction initiation triggered the Caribbean Large Igneous Province. Nat. Commun. 14, 786 (2023).
Schellart, W. P., Strak, V., Beniest, A., Duarte, J. C. & Rosas, F. M. Subduction invasion polarity switch from the Pacific to the Atlantic Ocean: a new geodynamic model of subduction initiation based on the Scotia Sea region. Earth Sci. Rev. 236, 104277 (2023).
Duarte, J. C., Schellart, W. P. & Rosas, F. R. The future of Earth’s oceans: consequences of subduction initiation in the Atlantic and implications for supercontinent formation. Geol. Mag. 155, 45–58 (2018).
Palano, M., González, P. J. & Fernández, J. The diffuse plate boundary of Nubia and Iberia in the Western Mediterranean: crustal deformation evidence for viscous coupling and fragmented lithosphere. Earth Planet. Sci. Lett. 430, 439–447 (2015).
Lescoutre, R., Tugend, J., Brune, S., Masini, E. & Manatschal, G. Thermal evolution of asymmetric hyperextended magma-poor rift systems: results from numerical modelling and Pyrenean field observations. Geochem. Geophys. Geosyst. 2019, GC008600 (2019).
Duarte, J. et al. Instructions to perform reference simulation for ‘Evidence of oceanic plate delamination in the Northern Atlantic’. Zenodo https://doi.org/10.5281/zenodo.15846292 (2025).
Carrara, G. & NEAREST Team. NEAREST 2008 Cruise Preliminary Report R/V Urania (ISMAR, 2008).
Grevemeyer, I. E. A. FS Poseidon POS389 & POS393 & FS Maria S. Merian MSM15/5: TOPOMED – Topographic, Structural and Seismotectonic Consequences of Plate Re-organization in the Gulf of Cadiz and Alboran Sea (IFM-GEOMAR, 2011).
Kennett, B. L. N., Engdahl, E. R. & Buland, R. Constraints on seismic velocities in the Earth from travel times. Geophys. J. Int. 122, 108–124 (1995).
Rawlinson, N. & Kennett, B. L. N. Rapid estimation of relative and absolute delay times across a network by adaptive stacking. Geophys. J. Int. 157, 332–340 (2004).
Rawlinson, N., Reading, A. M. & Kennett, B. L. N. Lithospheric structure of Tasmania from a novel form of teleseismic tomography. J. Geophys. Res. Solid Earth 111, 1–21 (2006).
de Kool, M., Rawlinson, N. & Sambridge, M. A practical grid-based method for tracking multiple refraction and reflection phases in three-dimensional heterogeneous media. Geophys. J. Int. 167, 253–270 (2006).
Rawlinson, N. & Sambridge, M. Wave front evolution in strongly heterogeneous layered media using the fast marching method. Geophys. J. Int. 156, 631–647 (2004).
Sethian, J. A. A fast marching level set method for monotonically advancing fronts. Proc. Natl Acad. Sci. USA 93, 1591–1595 (1996).
Kennett, B. L. N., Sambridge, M. & Williamson, P. R. Subspace methods for large inverse problems with multiple parameter classes. Geophys. J. Int. 94, 237–247 (1988).
Rawlinson, N., Pozgay, S. & Fishwick, S. Seismic tomography: a window into deep. Phys. Earth Planet. Inter. 178, 101–135 (2010).
Arroucau, P. et al. PRISM3D—a three-dimensional reference seismic model for Iberia and adjacent areas. Geophys. J. Int. 225, 789–810 (2021).
Moresi, L.-N. et al. Computational approaches to studying non-linear dynamics of the crust and mantle. Earth Planet. Sci. Lett. 305, 149–168 (2007).
Turcotte, D. L. & Schubert, G. Geodynamics (Cambridge Univ. Press, 2002).
Wessel, P. et al. The Generic Mapping Tools Version 6. Geochem. Geophys. Geosyst. 20, 5556–5564 (2019).
Acknowledgements
This work is supported by the Portuguese Fundação para a Ciência e Tecnologia, FCT, I.P./MCTES through national funds (PIDDAC): UID/50019/2025 and LA/P/0068/2020 (https://doi.org/10.54499/LA/P/0068/2020). J.C.D. acknowledges funding from an FCT grant and exploratory project ref. IF/00702/2015, a CEEC Inst. 2018 contract, CEECINST/00032/2018/CP1523/CT0002 (https://doi.org/10.54499/CEECINST/00032/2018/CP1523/CT0002) and the funding from the project GEMMA (PTDC/CTA‐GEO/2083/2021, https://doi.org/10.54499/PTDC/CTA-GEO/2083/2021). We also acknowledge the FCT-funded project SPIDER (ref. PTDC/GEOFIQ/2590/2014). CC acknowledges the Program for Young Researchers ‘Rita Levi Montalcini’ (grant D86-RALMI23CIVIE_01 awarded by the Italian Ministry of University and Research). W.P.S. was funded through a Vici Fellowship (016.VICI.170.110) from the Dutch National Science Foundation (NWO). This work was also funded by Portuguese funds through FCT – Fundação para a Ciência e a Tecnologia in the framework of the project UID/00698: Centre for Archaeology of the University of Lisbon. J.A. acknowledges FCT for a postdoctoral research contract from the project GEMMA (PTDC/CTA‐GEO/2083/2021, https://doi.org/10.54499/PTDC/CTA-GEO/2083/2021). We acknowledge the bathymetric data provided by EMEPC. We also acknowledge S. Custódio for reading, editing and commenting on several versions of this manuscript.
Ethics declarations
Competing interests
The authors declare no competing interests.
Peer review
Peer review information
Nature Geoscience thanks Jenny Collier and Taras Gerya for their contribution to the peer review of this work. Primary Handling Editor: Stefan Lachowycz, in collaboration with the Nature Geoscience team.
Additional information
Publisher’s note Springer Nature remains neutral with regard to jurisdictional claims in published maps and institutional affiliations.
Supplementary information
Rights and permissions
Open Access This article is licensed under a Creative Commons Attribution 4.0 International License, which permits use, sharing, adaptation, distribution and reproduction in any medium or format, as long as you give appropriate credit to the original author(s) and the source, provide a link to the Creative Commons licence, and indicate if changes were made. The images or other third party material in this article are included in the article’s Creative Commons licence, unless indicated otherwise in a credit line to the material. If material is not included in the article’s Creative Commons licence and your intended use is not permitted by statutory regulation or exceeds the permitted use, you will need to obtain permission directly from the copyright holder. To view a copy of this licence, visit http://creativecommons.org/licenses/by/4.0/.
About this article
Cite this article
Duarte, J.C., Riel, N., Civiero, C. et al. Seismic evidence for oceanic plate delamination offshore Southwest Iberia. Nat. Geosci. (2025). https://doi.org/10.1038/s41561-025-01781-6
Received: 24 February 2025
Accepted: 28 July 2025
Published: 27 August 2025
DOI: https://doi.org/10.1038/s41561-025-01781-6


