.png)

![]()
This website uses cookies to improve your user experience on this site. By continuing to view this site, you agree to our company's privacy policy.
Performance Engineering Platform
Fixstars AIBooster
Install on your GPU server and let it gather runtime data from your AI workloads. It identifies bottlenecks, automatically enhances performance, and gives you detailed insights to achieve even greater manual optimization.
You can download the Quick Start Guide, case studies, and other resources here.
![]()
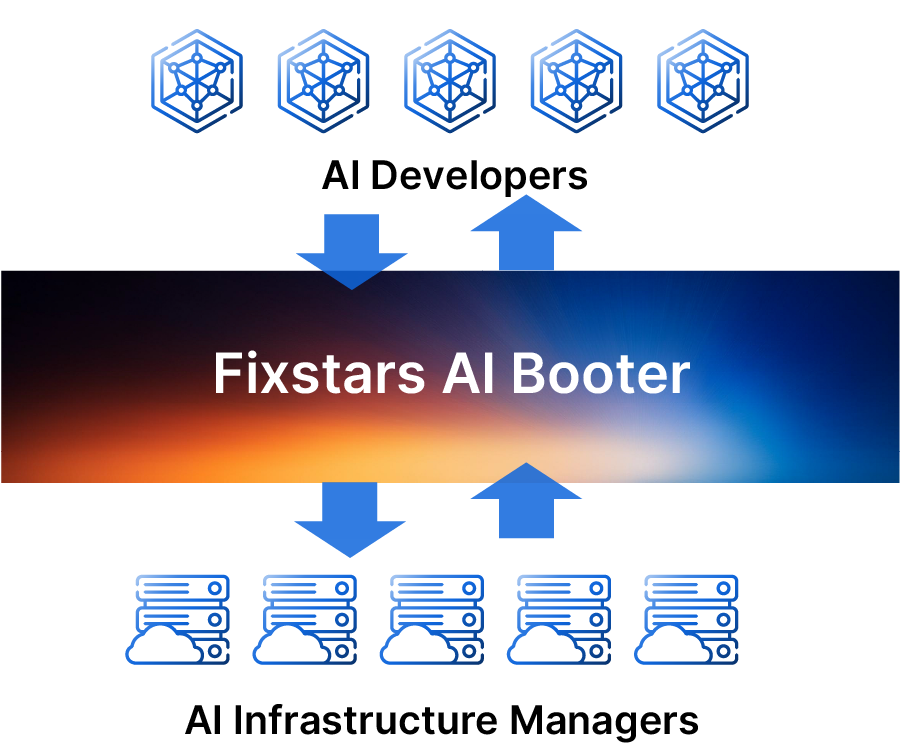
What is Fixstars AIBooster ?
Whether in the cloud or on-premises, simply install Fixstars AIBooster on your GPU servers to gather detailed performance data from active AI workloads, visualizing bottlenecks clearly.
Use these insights to drive performance improvements, creating a continuous cycle of monitoring and optimization—accelerating AI training and inference while significantly reducing infrastructure costs.
Free for permanent use
Performance Observability
-
Monitors and visualizes performance of AI training and inference.
-
Identifies bottlenecks and performance issues.
Paid with free trial
Performance Intelligence
-
Provides a suite of tools for automatic acceleration based on collected performance observation data.
-
Based on data provided by Performance Observability, users can manually accelerate their AI workloads for further performance improvements.
Processing Speed up to
0.0
Faster
(based on our actual project)
GPU Costs up to
Savings
(based on our actual projects)
Free for permanent use
Performance Observability
-

Visualization of Hardware Usage
Aggregates GPU, CPU, memory, NIC, PCIe, storage, and other information, managing it as time-series data. -

Visualization of AI Workload
Samples AI workloads at the function and thread level, managing this information as time-series data.
Continuous Monitoring of Hardware Usage and AI Workloads
- Efficiently collects hardware and AI workload data as time-series.
- Supports multiple platforms (AWS, Azure, GCP, and on-premises), seamlessly monitoring diverse system architectures in one place.
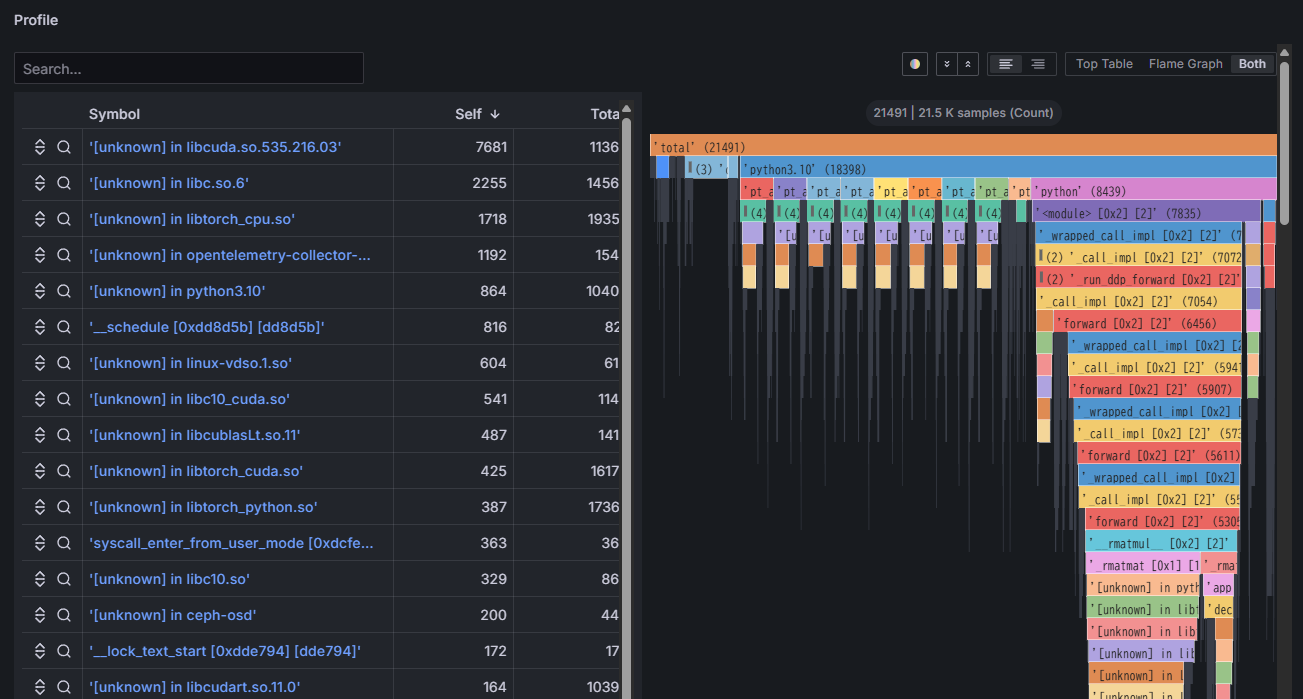
Profiling of running applications.
- Continuously saves flame graphs, breaking down application processing time to visualize internal processing details.
- Identifies which functions or libraries in the program are bottlenecks.
- Analyzes differences in application configurations under varying hardware utilization conditions.
Paid with free trial
Performance Intelligence
Workflow
-
1
Data Analysis
- Calculates training efficiency (identifies potential for acceleration)
- Identifies areas needing acceleration from performance data
-
2
Acceleration
- Provides a suite of tools for automatic acceleration based on performance analysis.
- Offers necessary documentation to assist users in achieving manual acceleration.
-
+α
Performance Engineering Services (Contact us for details)
Fixstars acceleration experts will improve your performance based on AIBooster analysis data, tailored to your environment and requirements.
Example of acceleration methods
- Model optimization
- Hyperparameter tuning
- Selecting optimal parallelization techniques
- Kernel parameter optimization
- Communication library optimization
- File systems optimized for the workload
- Improving memory efficiency
- OS, system and driver optimizations
Performance Engineering Cycle
Performance is not constant—it evolves due to new model adoption, parameter changes, and infrastructure updates. By continuously running the performance improvement cycle, you can prevent degradation and always achieve peak performance.
Factors Contributing to Performance Degradation
-

Adoption of New Models/Methods
Updates to Transformer architectures and multimodalization change computation patterns, disrupting the balance of GPU utilization and memory bandwidth.
-

Changes in Hardware Configuration/Cloud Plans
Changes in instance types, price revisions, and region migrations can make previously cost-optimized configurations obsolete, leading to over-provisioning or performance bottlenecks.
-

Library/Framework Updates
Version updates of CUDA, cuDNN, PyTorch, etc., can alter internal algorithms and memory management, causing unexpected increases in latency or deterioration of memory footprint.
By incorporating a continuous performance engineering cycle, you can consistently achieve optimal performance.
Proven Performance Improvements
Broadcasting Company - LLM 70B Continued Pre-training

Telecom Company - LLM 70B Continued Pre-training

LLM7B Model Training

LLM Single-batch Inference

LLM Multi-batch Inference

Note: These results include both automatic accelerations by Fixstars AIBooster and additional manual accelerates based on collected performance data.
An example of a multi-node configuration
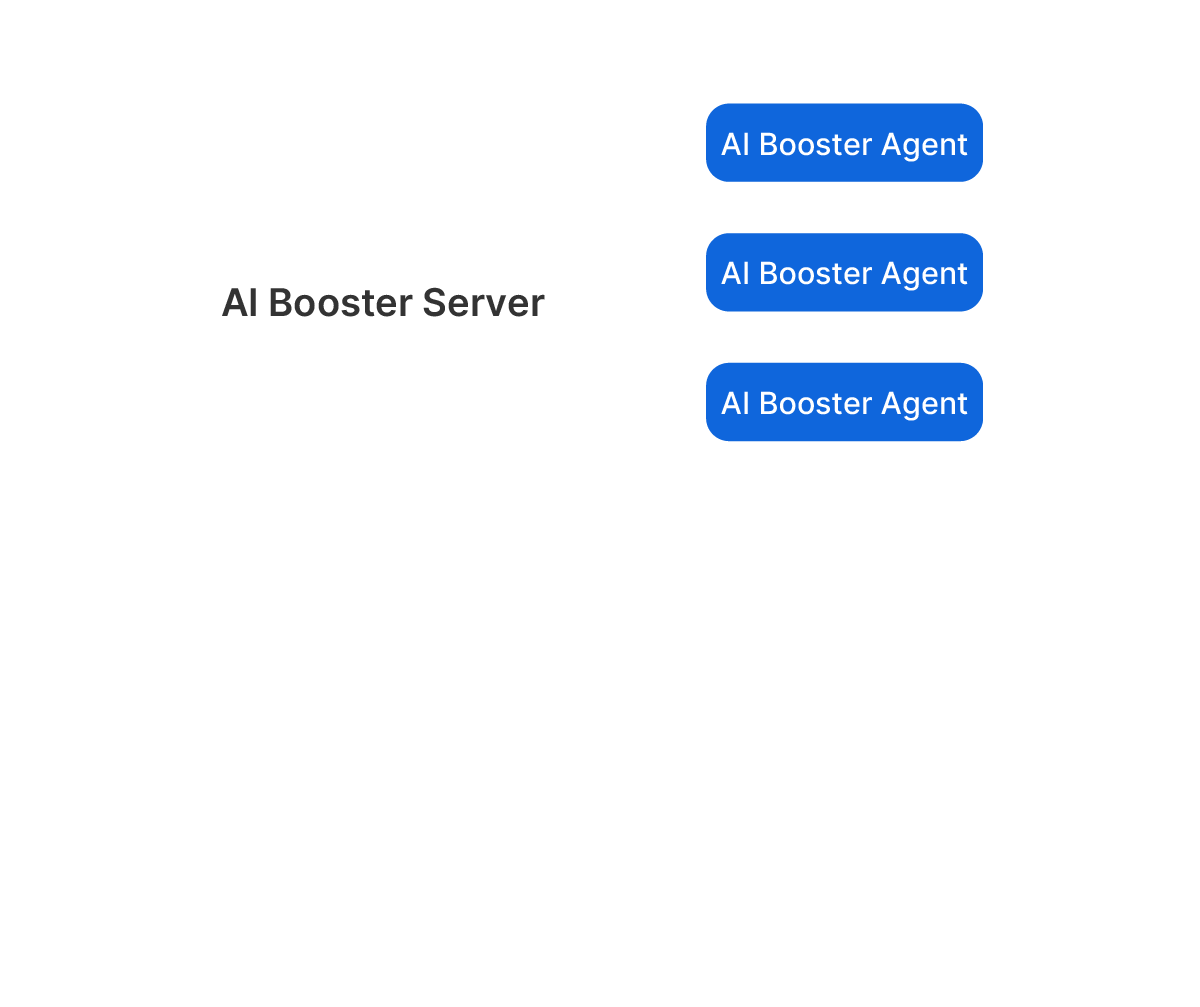
Fixstars AIBooster (AIBooster) consists of two main components:
-
AIBooster Agent: Collects performance telemetry data from individual nodes.
-
AIBooster Server: Stores data and provides clear visualizations via an intuitive dashboard.
Typically, one AIBooster Server is installed on a management node, while multiple AIBooster Agents run on compute nodes. This configuration enables comprehensive monitoring of multiple nodes from a single management point, visualizing performance across your entire infrastructure on one unified dashboard.
You can centrally visualize server groups distributed across multiple locations, whether in a multi-cloud environment with multiple cloud vendors or a hybrid environment combining on-premise and cloud.
For simpler setups, AIBooster also supports a local configuration, where both Server and Agent run together on a single node.
Software Configuration Example
Single Node Configuration 1 - Direct AIBooster Usage on a Local Workstation
Install both AIBooster Server and AIBooster Agent on a single GPU-equipped workstation or server. Connect a monitor and check performance information directly via the dashboard. This setup offers the quickest route when you want to "just try running it" on offline test machines or benchmarking systems. No network configuration is required.

Single Node Configuration 2 - Multi-User Performance Dashboard Viewing
Install both AIBooster Server and AIBooster Agent on a single GPU-equipped workstation or server.
Users can access the dashboard provided by the server through their personal PCs using a browser via TCP
port 3000.
This configuration is ideal for small-scale proof-of-concept (PoC) projects requiring dashboard viewing by
multiple users.

Multi-Node Configuration 1 - Centralized Performance Monitoring with Dedicated Management Node
Install AIBooster Server on a dedicated management node, and install AIBooster Agent on each GPU
compute node.
Users can access the management node’s dashboard from their personal PCs via a browser through TCP port
3000.
This configuration is recommended for most GPU cluster server systems.

Multi-Node Configuration 2 - GPU Compute Node Serving as Performance Monitoring Node
If there is no dedicated management node, select one GPU-equipped node and install both AIBooster Server
and its own AIBooster Agent. Install only the AIBooster Agent on the remaining GPU-equipped nodes.
Users can access the dashboard provided by the GPU node with AIBooster Server installed, via their
personal PCs through a browser using TCP port 3000.

Q. What's the overhead of Fixstars AIBooster?
![]()
The software runs as a Linux daemon, meaning it's always active with minimal overhead. We refer to it as having "near-zero overhead."
Q. What's the supported environment?
![]()
It runs on Debian-based Linux environments. We have verified operation on Ubuntu 22.04 LTS. It can also run without an NVIDIA GPU, but the available data and functionality will be limited.
Q. What features are free?
![]()
Fixstars AIBooster is free to use. However, the Performance Intelligence (PI) feature is available at no cost for the first month after activation and becomes a paid feature thereafter. Please refer to the Fixstars AIBooster's End User License Agreement for details.
Q. Does Fixstars collect any user-specific data?
![]()
Fixstars does not collect user-specific data (such as your application data or detailed analysis results). We only gather general usage statistics for product improvement purposes. Contact us for more details.
Q. What is different from other APM tools?
![]()
Traditional tools (e.g., DataDog, NewRelic) show hardware utilization, but Fixstars AIBooster additionally captures detailed AI workload data. It analyzes this data to identify and resolve performance bottlenecks.
Q. How does AIBooster improve performance?
![]()
It optimizes performance by analyzing data from Performance Observability (PO). This includes changing infrastructure configurations, tuning parameters, and optimizing source code to maximize GPU utilization.
Q. What is the different from other profiling tools?
![]()
Profiling tools (like NVIDIA Nsight) capture "snapshots" triggered by specific commands. In contrast, AI Booster continuously captures detailed performance data, enabling historical analysis and identification of performance degradation. AI Booster’s automatic acceleration suggestions and implementations are unique features.
Q. Is AIBooster applicable beyond GenAI and LLMs?
![]()
Yes. Because the underlying technology is broadly applicable, other AI or GPU-accelerated workloads can also benefit. The exact improvements depend on your specific workload—please contact us for details.
Any other questions? Please contact us.
Performance Engineering with
Fixstars AIBooster

Detect hidden bottlenecks and automatically accelerate your AI workloads.
Achieve further acceleration manually by utilizing acquired performance data.