.png)

In this article:
- Bytecode
- Debug information
- Line numbers
- Variable names
- Source file names
- Compiler flags
- Why remove debug information?
- Security
- Executable size
- Adding sources for debugging
- When the project is missing
- Source mismatch
- Conclusion
When debugging Java programs, developers are often under the impression that they’re interacting directly with the source code. This isn’t surprising – Java’s tooling does such an excellent job of hiding the complexity that it almost feels as if the source code exists at runtime.
If you’re just starting with Java, you likely remember those diagrams showing how the compiler transforms source code into bytecode, which is then executed by the JVM. You might also wonder: if that’s the case, why do we examine and step through the source code rather than the bytecode? How does the JVM know anything about our sources?
This article is a little different from my previous posts on debugging. Instead of focusing on how to debug a specific problem, such as an unresponsive app or a memory leak, it explores how Java and debuggers work behind the scenes. Stick around – as always, a couple of handy tricks are included.
Bytecode
Let’s start with a quick recap. The diagrams found in Java books and guides are indeed correct – the JVM executes bytecode.
Consider the following class as an example:
package dev.flounder; public class Calculator { int sum(int a, int b) { return a + b; } }When compiled, the sum() method will turn into the following bytecode:
int sum(int, int); descriptor: (II)I flags: (0x0000) Code: stack=2, locals=3, args_size=3 0: iload_1 1: iload_2 2: iadd 3: ireturn
You can inspect the bytecode of your classes using the javap -v command included with the JDK. If you are using IntelliJ IDEA, you can also do this from the IDE: after building your project, select a class, then click View | Show Bytecode.

Since class files are binary, citing their raw contents would not be informative. For readability, the examples in this article follow the format of javap -v output.
Bytecode consists of a series of compact platform-independent instructions. In the example above:
- iload_1 and iload_2 load the variables onto the operand stack
- iadd adds the contents of the operand stack, leaving a single result value on it
- ireturn returns the value from the operand stack
In addition to instructions, bytecode files also include information on the constants, the number of parameters, local variables, and the depth of the operand stack. This is all the JVM needs to execute a program written in a JVM language, such as Java, Kotlin, or Scala.
Debug information
Since bytecode looks completely different from your source code, referring to it while debugging would be inefficient. For this reason, the interfaces of Java debuggers – such as the JDB (the console debugger bundled with the JDK) or the one in IntelliJ IDEA – display the source code rather than bytecode. This allows you to debug the code that you wrote without having to think about the underlying bytecode being executed.
For example, your interaction with the JDB might look like this:
Initializing jdb ... > stop at dev.flounder.Calculator:5 Deferring breakpoint dev.flounder.Calculator:5. It will be set after the class is loaded. > run run dev/flounder/Main Set uncaught java.lang.Throwable Set deferred uncaught java.lang.Throwable VM Started: Set deferred breakpoint dev.flounder.Calculator:5 Breakpoint hit: "thread=main", dev.flounder.Calculator.sum(), line=5 bci=0 > locals Method arguments: a = 1 b = 2IntelliJ IDEA will display the debug-related information in the editor and in the Debug tool window:
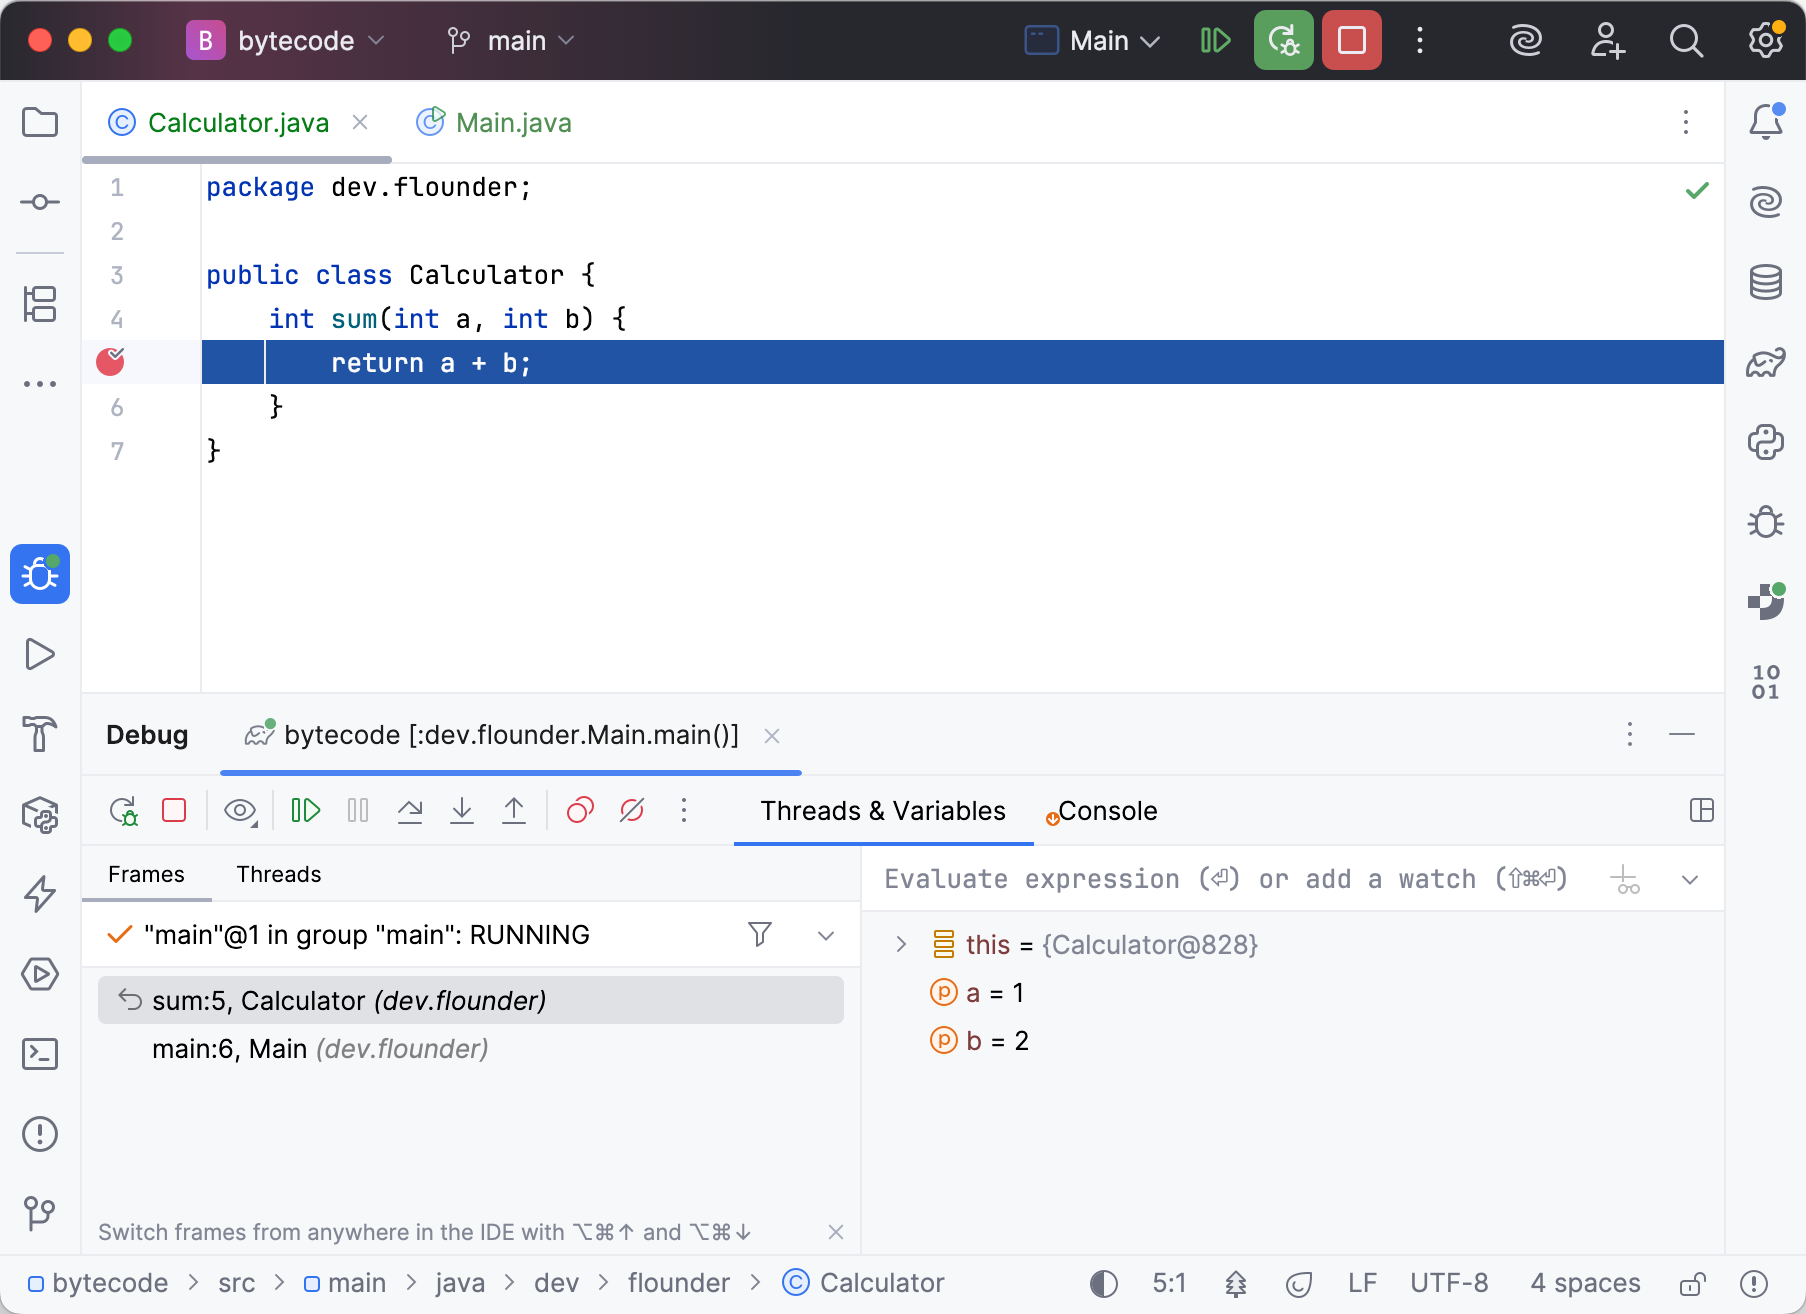
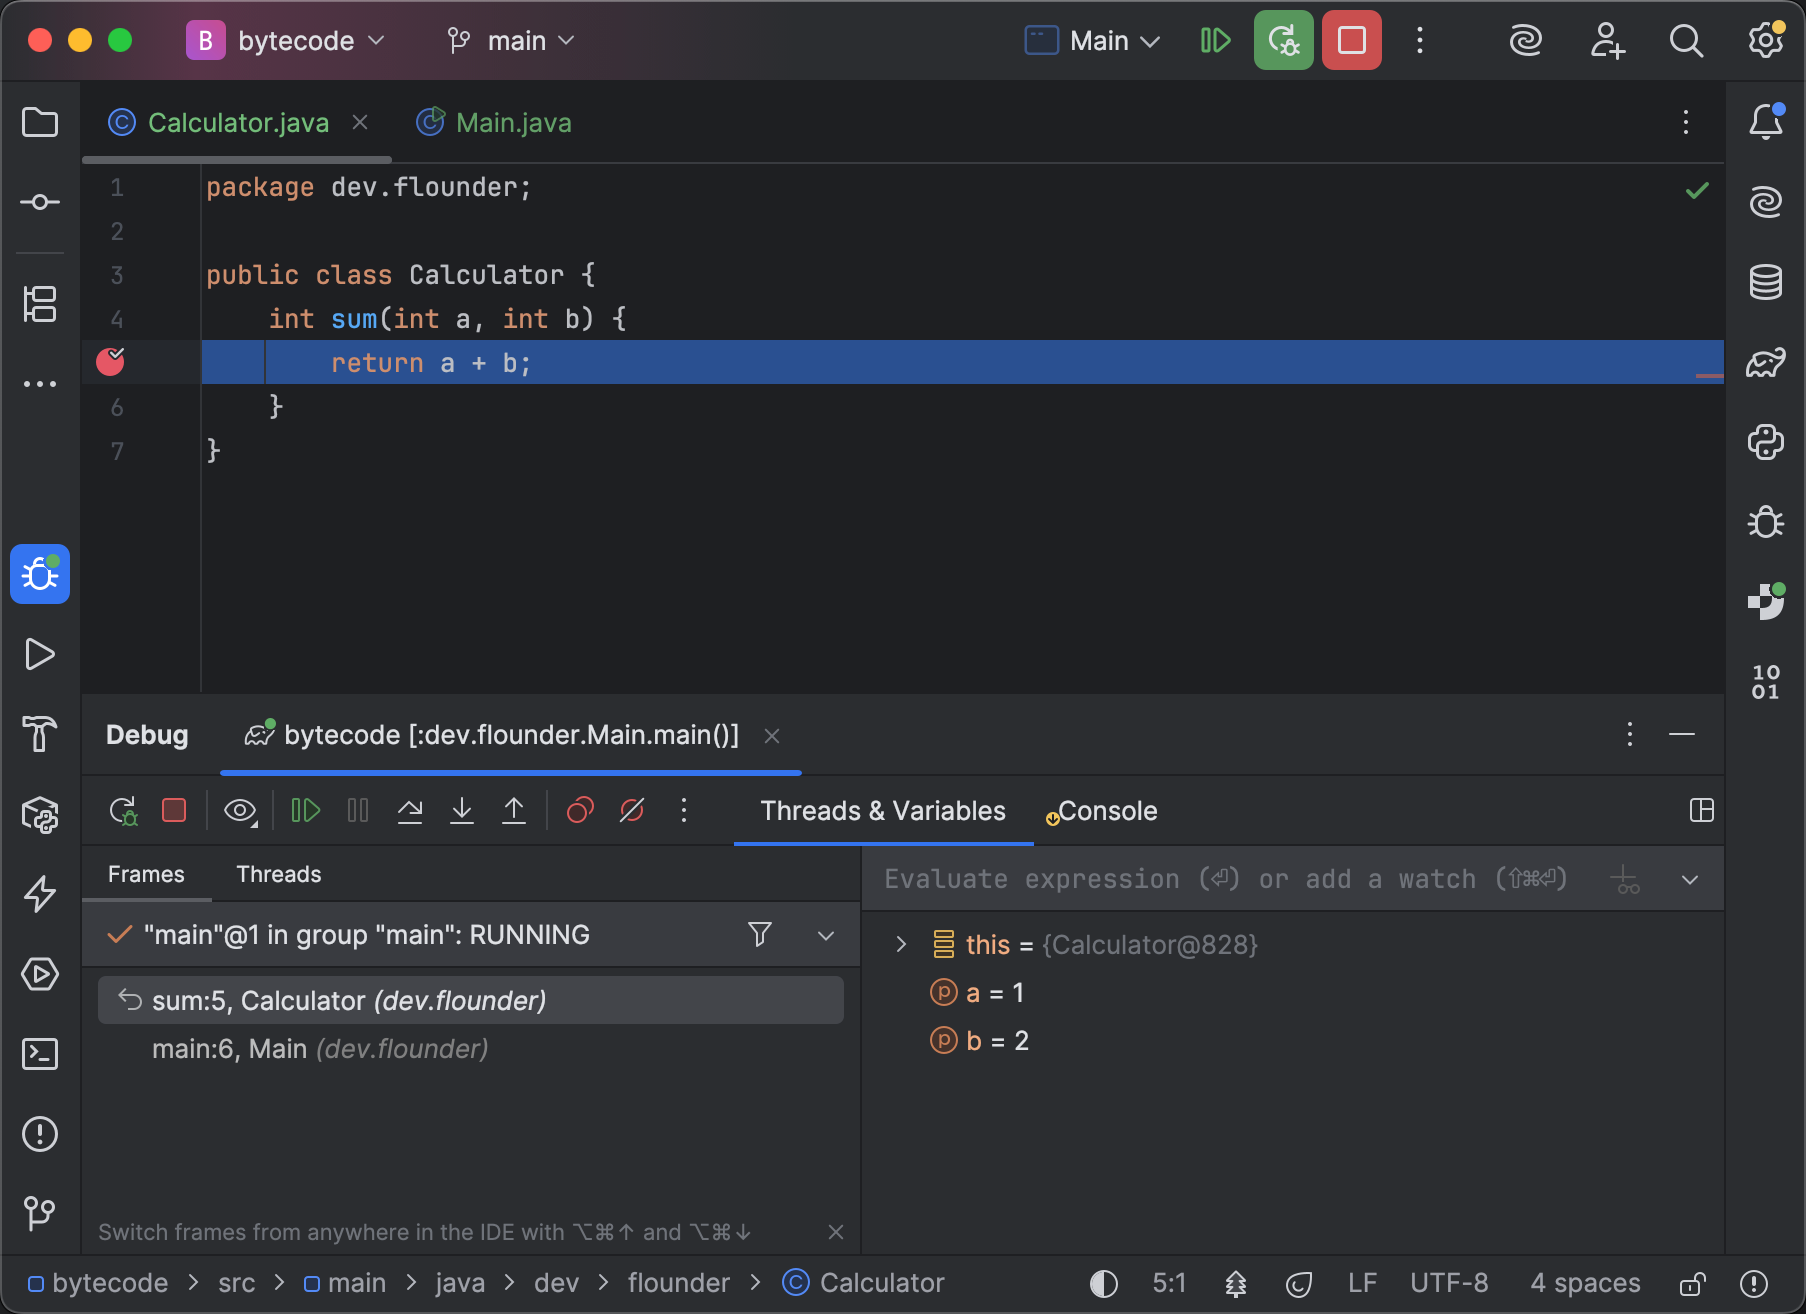
As you can see, both debuggers use the correct variable names and reference valid lines from our code snippet above.
Since the runtime doesn’t have access to the source files, it must collect this data elsewhere. This is where debug information comes into play. Debug information (also referred to as debug symbols) is compact data that links the bytecode to the application’s sources. It is included in the .class files during compilation.
There are three types of debug information:
In the following chapters, I’ll briefly explain each type of debug information and how the debugger uses it.
Line numbers
Line number information is stored in the LineNumberTable attribute within the bytecode file, and it looks like this:
LineNumberTable: line 5: 0 line 6: 2The table above tells the debugger the following:
- Line 5 contains the instruction at offset 0
- Line 6 contains the instruction at offset 2
This type of debug information helps external tools, such as debuggers or profilers, trace the exact line where the program executes in the source code.
Importantly, line number information is also used for source references in exception stack traces. In the following example, I compiled code from my other tutorial both with and without line number information. Here are the stack traces produced by the resulting executables:
The executable compiled without line number information produced a stack trace that lacks line numbers for the calls corresponding to my project code. The calls from the standard library and dependencies still include line numbers because they have been compiled separately and weren’t affected.
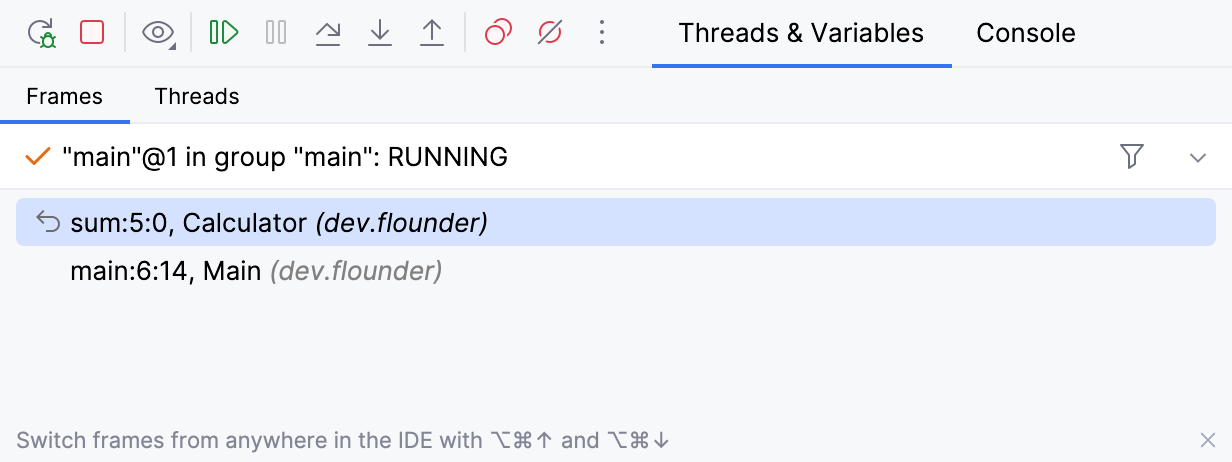
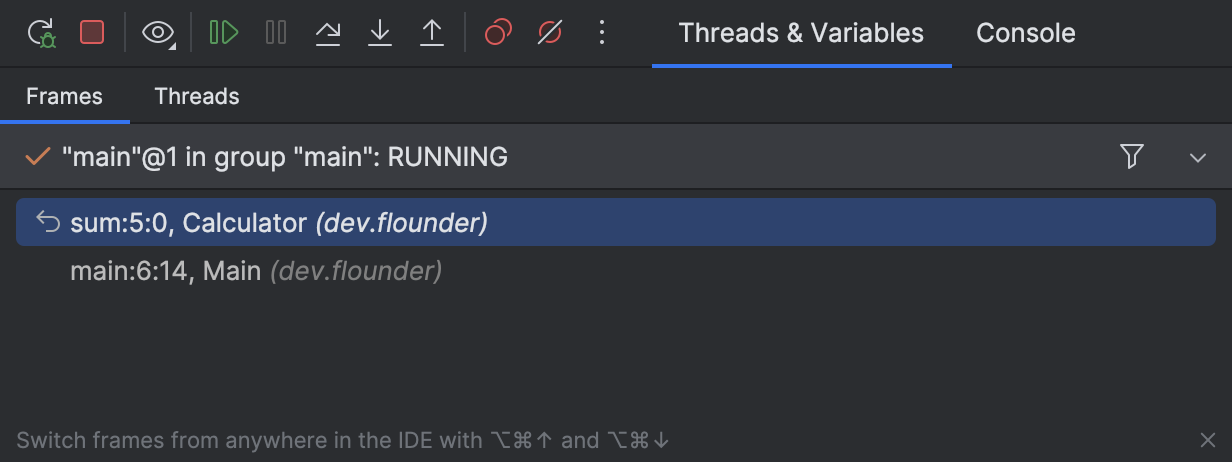
Besides stack traces, you may encounter a similar situation where line numbers are involved, for example, in IntelliJ IDEA’s Frames tab:
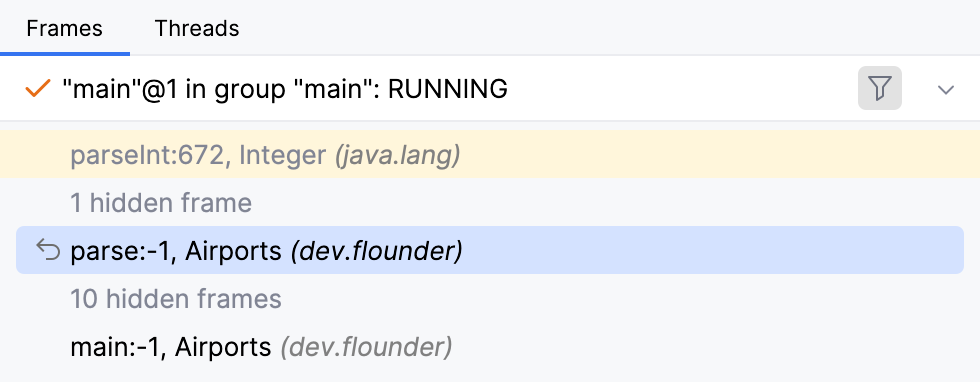
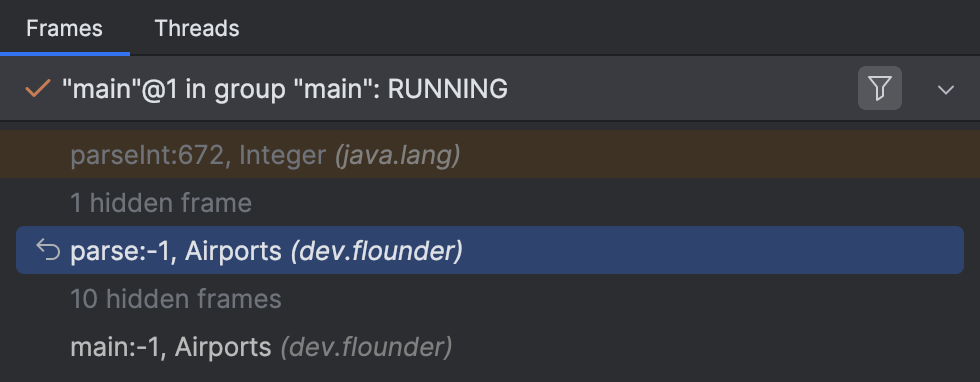
So, if you see -1 instead of actual line numbers, and you don’t like it, make sure your program is compiled with line number information.

You can view bytecode offset right in IntelliJ IDEA’s Frames tab. For this, add the following registry key: debugger.stack.frame.show.code.index=true
Variable names
Like line number information, variable names are stored in class files. The variable table for our example looks as follows:
LocalVariableTable: Start Length Slot Name Signature 0 4 0 this Ldev/flounder/Calculator; 0 4 1 a I 0 4 2 b IIt contains the following information:
- Start: The bytecode offset where the scope of this variable begins.
- Length: The number of instructions during which this variable remains in scope.
- Slot: The index at which this variable is stored for lookup.
- Name: The variable’s name as it appears in the source code.
- Signature: The variable’s data type, expressed in Java’s type signature notation.
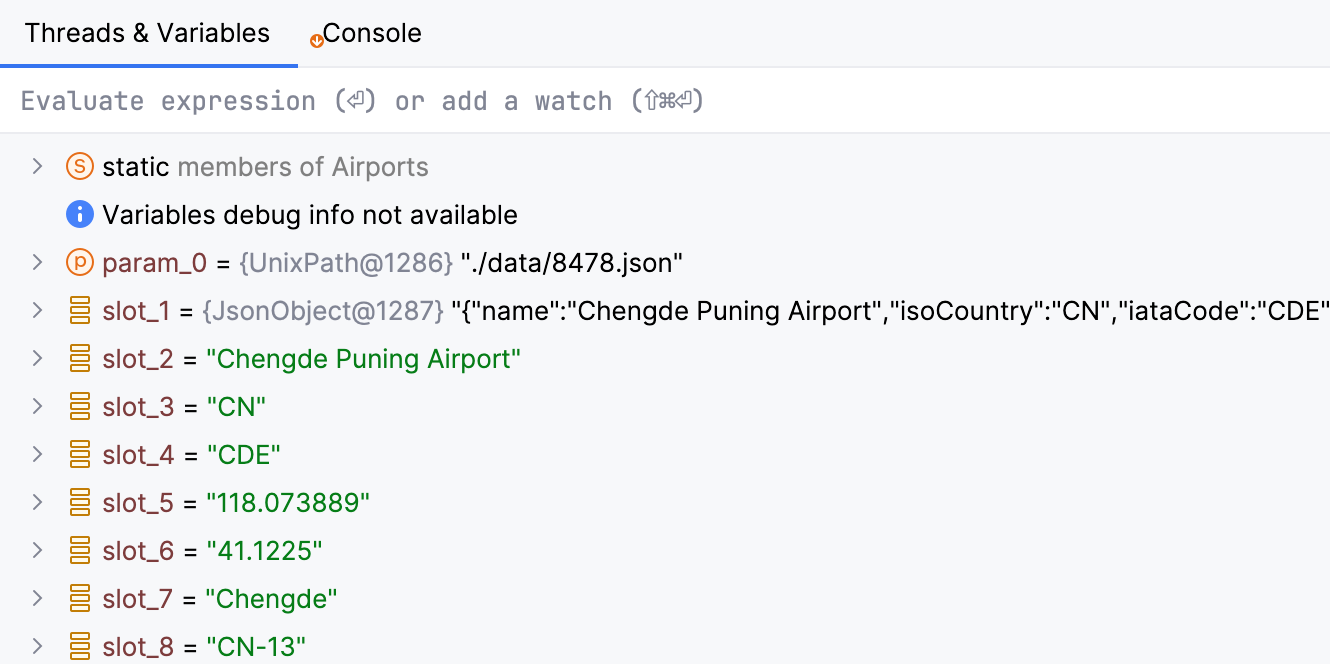
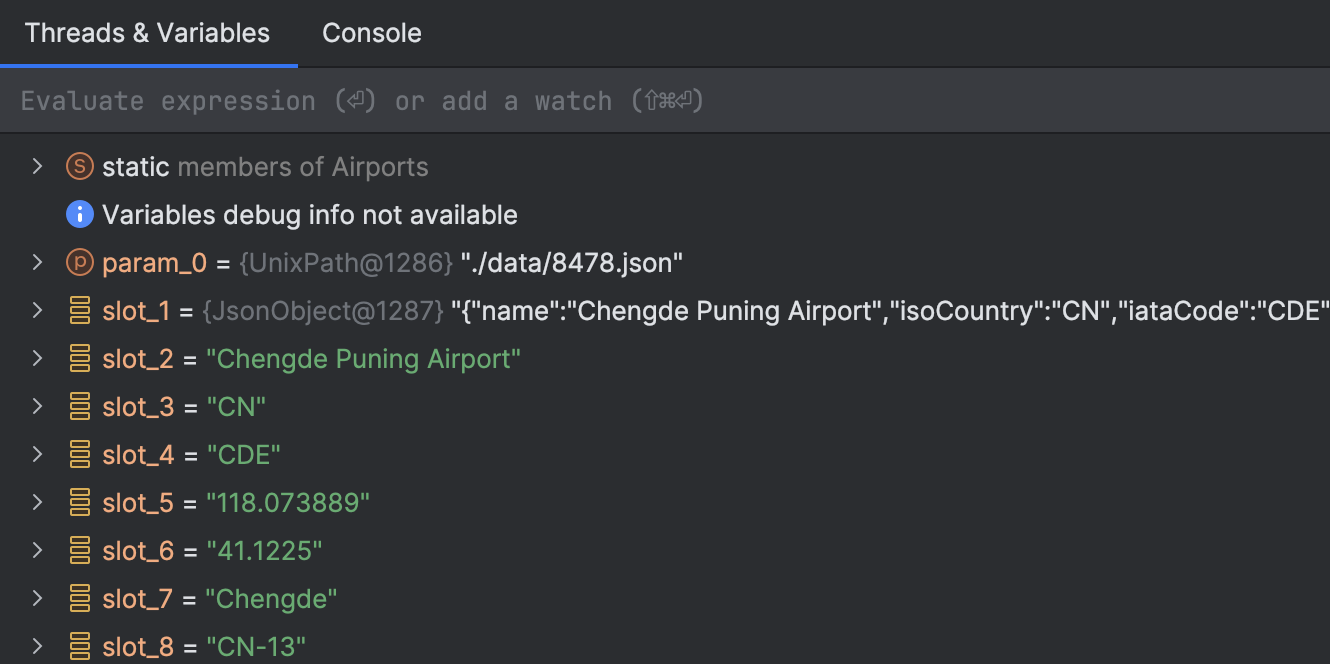
If variables are missing from the debug information, some debugger functionality might not work as expected, and you will see slot_1, slot_2, etc. instead of the actual variable names.
Source file names
This type of debug information indicates which source file was used to compile the class. Like line number information, its presence in the class files affects not only external tooling, but also the stack traces that your program generates.
Without source file names, the corresponding stack trace calls will be marked as Unknown Source.
Compiler flags
As a developer, you have control over whether to include debug information in your executables and, if so, which types to include. You can manage this by using the -g compiler argument, like this:
javac -g:lines,vars,sourceHere is the syntax:
| Command | Result |
| javac | Compiles the application with line numbers and source file names (default for most compilers) |
| javac -g | Compiles the application with all available debug information: line numbers, variables, and source file names |
| javac -g:lines,source | Compiles the application with the specified types of debug information – line numbers and source file names in this example |
| javac -g:none | Compiles the application without the debug information |
Defaults might vary between compilers. Some of them completely exclude debug information unless instructed otherwise.
If you are using a build system, such as Maven or Gradle, you can pass the same options through compiler arguments. For example:
Why remove debug information?
As we’ve just seen, debug symbols enable the debugging process, which is convenient during development. For this reason, debug symbols are usually included in development builds. In production builds, they are often excluded; however, this ultimately depends on the type of project you are working on.
Here are a couple of things you may want to consider:
Security
Since a debugger can be used to tamper with your program, including debug information makes your application slightly more vulnerable to hacking and reverse engineering, which may be undesirable for some applications.
Although the absence of debug symbols might make it somewhat more difficult to interfere with your program using a debugger, it does not fully protect it. Debugging remains possible even with partial or missing debug information, so this alone will not prevent a determined individual from accessing your program’s internals. Therefore, if you are concerned about the risk of reverse engineering, you should employ additional measures, such as source code obfuscation.
Executable size
The more information an executable contains, the larger it becomes. Exactly how much larger depends on various factors. The size of a particular class file might easily be dominated by the number of instructions and the size of the constant pool, making it impractical to provide a universal estimate. Still, to demonstrate that the difference can be substantial, I experimented with Airports.java, which we used earlier to compare stack traces. The results are 4,460 bytes without debug information compared to 5,664 bytes with it.
In most cases, including debug symbols won’t hurt. However, if executable size is a concern, as is often the case with embedded systems, you might want to exclude debug symbols from your binaries.
Adding sources for debugging
Typically, the required sources reside within your project, so the IDE will have no trouble finding them. However, there are less common situations – for example, when the source code needed for debugging is outside your project, such as when stepping into a library used by your code.
In this case, you need to add source files manually: either by placing them under a sources root or by specifying them as a dependency. During debugging, IntelliJ IDEA will automatically detect and match these files with the classes executed by the JVM.
When the project is missing
In most cases, you would build, launch, and debug an application in the same IDE, using the original project. But what if you have only a few source files, and the project itself is missing?
Here’s a bare-bones debugging setup that will do the trick:
- Create an empty Java project
- Add the source files under a sources root or specify them as a dependency
- Launch the target application with the debug agent. In Java, this is typically done by adding a VM option, such as:
- Create a Remote JVM Debug run configuration with the correct connection details. Use this run configuration to attach the debugger to the target application.
With this setup, you can debug a program without accessing the original project. IntelliJ IDEA will match the available sources with the runtime classes and let you use them in a debugging session. This way, even a single project or library class gives you an entry point for debugging.
Source mismatch
One confusing situation you might encounter during debugging is when your application appears suspended at a blank line or the line numbers in the Frames tab don’t match those in the editor:
This occurs when debugging decompiled code (which we’ll discuss in another article) or when the source code doesn’t fully match the bytecode that the JVM is executing.
Since the only link between bytecode and a particular source file is the name of the file and its classes, the debugger has to rely on this information, assisted by some heuristics. This works well for most situations; however, the version of the file on disk may differ from the one used to compile the application. In the case of a partial match, the debugger will identify the discrepancies and attempt to reconcile them rather than failing fast. Depending on the extent of the differences, this might be useful, for example, if the only source that you have isn’t the closest match.
In the fortunate scenario where you have the exact version of the sources elsewhere, you can fix this issue by adding them to the project and re-running the debug session.
Conclusion
In this article, we’ve explored the connection between source files, bytecode, and the debugger. While not strictly required for day-to-day coding, having a clearer picture of what happens under the hood can give you a stronger grasp of the ecosystem and may occasionally help you out of non-standard situations and configuration problems. I hope you found the theory and tips useful!
There are still many more topics to come in this series, so stay tuned for the next one. If there’s anything specific you’d like to see covered, or if you have ideas and feedback, I’d love to hear from you!