.png)

Main
Highly ubiquitous crystals and liquid crystals (LCs) have been driving major scientific discoveries and technological innovation for centuries1,2. Time crystals were proposed by Wilczek only a decade ago3,4,5, with the initial concept shown later to be unachievable6,7. However, new concepts of time crystals recently captured the fascination of numerous researchers who are now contributing to this explosively growing field8,9,10,11,12,13. Differing from Wilczek’s designs of time crystals based on closed quantum and classical many-body systems3,4, time crystals with external Floquet drives that break time-translation symmetry discretely, dubbed ‘discrete (Floquet) time crystals’14,15,16,17, have been demonstrated. Quantum discrete time crystals have been observed in systems of nuclear spins, trapped ions, cold atoms, superconducting qubits and so on8,9,10,11,12,13,18,19,20,21,22,23,24,25,26,27,28. Recently, a continuous time crystal (which does not rely on periodic Floquet driving) has been observed in a quantum system of atom cavity29, also breaking the time-translation symmetry and opening a new avenue for the studies of time crystals.
To differentiate the genuine time-crystalline order from a large variety of time-periodic patterns, stringent requirements have been introduced29. First, these crystals should emerge from spontaneous time-symmetry breaking, where the relative time phases are randomly distributed between 0 and 2π, assuring that the time crystals are independent of the external source. Second, time crystals should exhibit robustness against temporal perturbations by an external source, demonstrating a rigidity analogous to that of space crystals. Criteria-satisfying continuous time crystals have been reported for photonic metamaterials30, optically pumped atomic system31, Rydberg gases32 and electron–nuclear spin systems33. However, continuous space-time crystals (CSTCs), which spontaneously break the time-translation symmetry as well as the space-translation symmetry without the assistance of periodic driving, have not been convincingly demonstrated yet in either quantum or classical systems29,30,31,32,33,34. Moreover, since most of the time crystals known so far exist in the quantum world, a time crystal has not been directly seen by microscopic observations or even with bare human eyes, at the same time being shown to meet the above identification criteria. Although time-varying patterns are ubiquitous and can often be observed by naked eyes, they do not typically arise from the many-body interactions of quasi-atom building blocks, and whether some of them could happen to meet the stringent requirements (described above) of being identified as time crystals remains an open question9,11,12,31.
Here we report the observation of classical CSTCs in nematic LC systems with emergent topological soliton building blocks exhibiting interactions mediated by orientational elasticity. By shining ambient or microscope illumination light on specially designed samples with the LC confined between glass plates coated by a photoresponsive dye, we find emergent spatiotemporal patterns in which spatial and temporal symmetries are broken, without the assistance of periodic external driving. Furthermore, such emergent behaviour can be directly observed in an optical microscope and, when designed appropriately, even by bare eyes. The continuous space-time crystallization phase is fairly stable at room temperature and can persist locally for hours of observation. By building a model based on balancing optical, surface and bulk viscoelastic torques associated with a nematic fluid’s orientational viscoelasticity, we explain the emergent formation of topological solitons in this system. We then construct the periodically varying configurations with elastically interacting spatially localized particle-like topological solitonic structures. We find that the intrinsic temporal periodic nature persists with changes in temperature and external driving light intensity, yielding good agreements with the experimental observations. We also experimentally and numerically verify that the time-translation symmetry is broken spontaneously and the continuous space-time crystallization phase is robust against spatiotemporal dislocations and temporal perturbations, meeting all requirements to be identified as time crystalline. Finally, we discuss the implications of our work for fundamental science and technological utility in optical devices, photonic space-time crystal generators, telecommunications, anti-counterfeiting designs and cryptography, among many others.
Emergence of time-crystalline order
The samples are prepared by sandwiching the nematic LC with photoresponsive confining substrates, inner surfaces of which are coated with a dye. The photoresponsive azobenzene dye molecules (Methods) at the surfaces and LC molecules in the bulk have anisotropic shapes2,35, with their average orientations characterized by non-polar directors ns and n with head–tail symmetry (ns ≡ –ns and n ≡ –n), respectively. When normally incident linearly polarized blue light passes through the samples (Fig. 1a), ns at the top surface tends to orient perpendicularly to the polarization direction of the linearly polarized light, and the LC molecules near it orient parallel to the azobenzene molecules, thereby following the dye-defined surface boundary conditions (Fig. 1b–d). For a monodomain LC and polarization direction of the linearly polarized light orthogonal to directors ns at both top and bottom surfaces and n in the bulk, the light could traverse the sample as an ordinary mode without polarization change. However, the initial surface boundary conditions are tangentially degenerate. On the illumination of linearly polarized light, the dye molecules at the top surface become uniformly oriented along the direction perpendicular to the polarization of incident light, whereas orientations of the dye molecules at the bottom substrate depend on their initial random polydomain orientations. Orientational changes in the LC director develop across the sample thickness, leading to the transformation of the polarization state of the traversing light to generally elliptical polarization, as well as the rotation of the long axis of the polarization ellipse. Subsequently, the exposure of the bottom substrate to elliptically polarized light leads to the reorientation of neighbouring LC molecules and ns at the bottom surface, which tend to orient perpendicular to the major axis of the polarization ellipse of elliptically polarized light (Fig. 1d). Once the dye molecules and ns rotate, they also drive reorientations of the neighbouring LC molecules and n, further changing the polarization ellipse of traversing polarized light. Such a feedback mechanism spontaneously creates a periodic spatiotemporal array of topological solitonic quasiparticles (Fig. 1e and Supplementary Videos 1 and 2), forming a robust continuous space-time crystallization phase (Fig. 1f and Extended Data Fig. 1), which will be described in detail below.
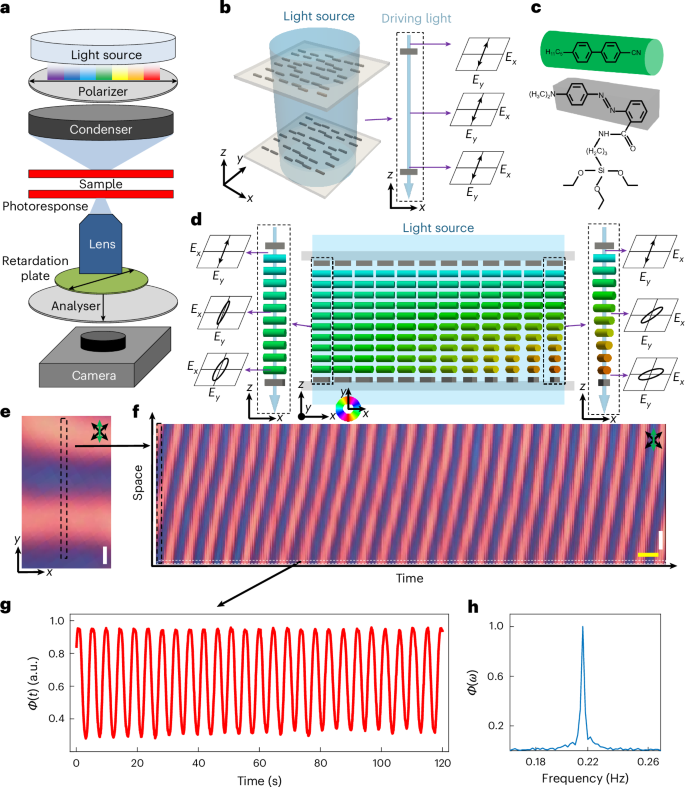
a, Schematic of the optical microscope used: linearly polarized light passes through the LC glass cell, where the inner surfaces of substrates are coated with a photoresponsive dye. The light signals and spatial patterns are recorded by a camera after they pass through a first-order retardation plate and an analyser. b, Schematic of an empty cell with normally incident linearly polarized blue light passing through. The dye molecules (grey cuboids) have long axes perpendicular to the polarization of the linearly polarized light. The electric field (Ex, Ey) of driving light at different depths is shown on the right. c, Chemical structures of the azobenzene dye and LC molecules. The LC molecule is represented as a green cylinder and the azobenzene group is shown as a grey cuboid. d, Schematic of an LC-filled sample, where LC molecules are coloured according to the azimuthal angles of the director orientation, as defined by the colour scheme. The electric field (Ex, Ey) of driving light at different depths of the marked areas is plotted on the right and left, respectively. e, Experimental polarizing optical micrograph of the CSTC obtained with a first-order full-wave retardation plate. The plate’s slow axis is labelled by the green double arrow and crossed polarizers are labelled by black double arrows. f, Space-time image of the CSTC shown in e, where the crystal size is 400 μm × 120 s. The selected area is marked in e; the time interval is 0.3 s. Scale bars, 50 μm (white; e and f); 5 s (yellow; f). g, Normalized red light signals extracted from the space-time plot, where the selected area is marked in f. a.u., arbitrary units. h, Normalized fast Fourier transform spectrum of the light signals from g: Ф(t)→Ф(ω); the central peak is at 0.217 Hz.
With the help of a first-order full-wave retardation plate (Fig. 1a), the different orientations of the LC director in the bulk are inferred from polarized interference colours seen in the captured polarizing optical micrographs. For a thin cell (thickness, d < 2 μm), the light after the analyser becomes bluish or yellowish (Fig. 1e) when the director orientations are parallel or perpendicular to the slow axis of the retardation plate, respectively. The spatial area of a CSTC can be made larger than 1 mm2, which can be observed directly by eyes and can be characterized in detail with an optical microscope. By selecting a fixed stripe area (Fig. 1e, dashed rectangle) and tracking it in time, a space-time image of the solitonic arrays can be composed, where the size of a representative time crystal region (Fig. 1f) is 400 μm × 120 s. We analyse the normalized digital intensity signals (Ф) of pixels (Fig. 1f) and perform the fast Fourier transform analysis (Fig. 1g,h), showing a sharp peak at around 0.217 Hz (4.61 s), which corresponds to the temporal periodicity of the CSTC. By defining the time correlation function G(t) = 〈Ф(t)Ф(0)〉 – 〈Ф(t)〉〈Ф(0)〉 from the normalized digital intensity signals within the pattern (Methods), we find that G(t) can be fitted by a power-law decay (~t−0.09) in spite of fluctuations, exhibiting a quasi-long-range order in time (Extended Data Fig. 2), similar to that known for systems with one-dimensional spatial positional order like smectic LCs that follow Peierls’ and Landau’s predictions36.
Numerical modelling of emergent particle-like solitonic structures and crystals
To gain insights into the emergent formation of particle-like topological solitons that then exhibit time crystallization, we use a model based on the balance of optical, surface anchoring and bulk viscous and elastic torques, with the latter derived from the Frank–Oseen free energy2,37:
$${F}_{{\rm{bulk}}}=\int {{\rm{d}}}^{3}{\boldsymbol{r}}\left\{\frac{{K}_{11}}{2}{\left(\nabla \cdot {\boldsymbol{n}}\right)}^{2}+\frac{{K}_{22}}{2}{\left[{\boldsymbol{n}}\cdot \left(\nabla \times {\boldsymbol{n}}\right)\right]}^{2}+\frac{{K}_{33}}{2}{\left[{\boldsymbol{n}}\times \left(\nabla \times {\boldsymbol{n}}\right)\right]}^{2}\right\},$$
(1)
where the Frank elastic constants K11, K22 and K33 depend on temperature (Methods, Supplementary Fig. 1 and Supplementary Tables 1 and 2) and determine the energetic costs of splay, twist and bend spatial deformations of the LC director field, n(r), respectively. Furthermore, the free energy term associated with coupling n(r) and ns(r) at the surface reads
$${F}_{{\rm{surface}}}=-\int {{\rm{d}}}^{2}{\boldsymbol{r}}\frac{\eta W}{{\bf{2}}}{\left({{\boldsymbol{n}}}_{{\boldsymbol{s}}}\cdot {\boldsymbol{n}}\right)}^{2},$$
(2)
where η is the dimensionless light coupling efficiency parameter ranging from 0 to 1 and W is the anchoring coefficient. We assume that ns orients perpendicular to the direction of the major axis of the elliptically polarized light, calculated using the Jones matrix method (Methods). Although our field theory model is intended to describe the spatial structures of the director field, solitonic topological particles emerge spontaneously within it, much like skyrmions, domain walls and hopfions found in diverse fields ranging from magnets to LCs38. In turn, these particle-like solitonic objects then exhibit many-body interactions and time-crystalline order.
Consider a uniform state of the director field with a small perturbation on the left side (Extended Data Fig. 3a), when light (450 nm) normally incident on the sample from the top has linear polarization along the y axis. The resulting director dynamics stems from the torque balance \(\frac{\delta F}{\delta {{\bf{n}}}_{i}}=-{\rm{\gamma }}\frac{\partial {{\bf{n}}}_{i}}{\partial t}\) yielding temporal evolution ni(t), where \(\frac{\delta F}{\delta {{\bf{n}}}_{i}}\) is the variational derivative of F, subscript i denotes spatial coordinates, γ is the rotational viscosity, Jones vectors are updated further in each next iteration and F = Fbulk + Fsurface. A spatially periodic configuration of the solitonic array emerges spontaneously (Fig. 2 and Extended Data Fig. 3). By properly arranging the initial state for periodic boundary conditions (Methods), we find that the simulated structure shown in Fig. 2a exhibits the properties of a continuous space-time crystallization phase (Supplementary Videos 3 and 4).
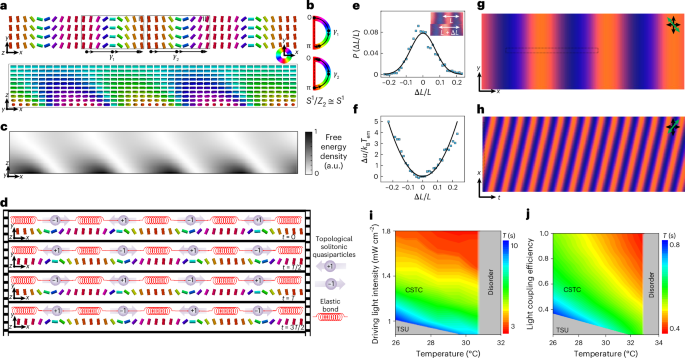
a, Director field n(r) of a CSTC in x–y (top) and x–z (bottom) cross-sections. n(r) is translationally invariant along the y axis, as illustrated in the x–y cross-section at the bottom surface. Light propagation directions are from z to –z; the cylinders are coloured according to the circle scheme on the right. b, Along the spatial paths γ1 and γ2 marked in a, the director n rotates by +π and –π, respectively. Since \({{\mathbb{S}}}^{1}/{{\mathbb{Z}}}_{2}\cong {{\mathbb{S}}}^{1}\), the mappings of director orientations from these paths cover the order parameter space once in opposite directions, indicating the +1 and −1 Néel domain-wall solitons in regions I and II in a. c, Elastic free energy density in the x–z cross-section marked in a. The free energy density is calculated using equation (1) and relative to that of a uniform nematic background. It is visualized using a greyscale scheme (right-side inset). d, Schematic of many-body interactions among the topological solitonic quasiparticles at different times, where T is the temporal periodicity of the CSTC. e,f, Probability distributions of the displacements of neighbouring domain-wall solitons (e) and the corresponding potential landscape (f); the inset shows the measurements of displacements, where L is the spatial periodicity. g,h, Simulated polarizing optical micrograph snapshot (g) and space-time image (h) of the CSTC. The selected area (h) is marked in g. i, Experimentally measured temporal periodicity as a function of temperature and driving light intensity. j, Simulated temporal periodicity versus temperature and light coupling efficiency; temporal periodicities T are coloured according to the schemes shown in the right-side insets, whereas regions of disorder and time-symmetry-unbroken (TSU) phases are shown in grey.
In the dynamic steady-state configuration, the director field n(r) at the top surface stays perpendicular to the incident light’s polarization direction and smoothly deforms at the bottom (Fig. 2a), displaying alternating pairs of the nematic Néel domain-wall solitons of opposite elementary topological charge1,39,40 (Fig. 2a,b). These solitons are labelled as the elements of the first homotopy group π1(\({\mathbb{S}}\)1/ℤ2) ≡ π1(\({\mathbb{S}}\)1) = ℤ and can be treated as topological quasiparticles with opposite signs of ±1, low-dimensional analogues of Skyrme solitons used to model particles with different baryon numbers in subatomic physics38,39. Treating the time coordinate similarly to the space coordinate, ±1 elementary quasiparticle-like topological solitons can also be identified in time. By calculating the elastic free energy of the LC director field deformations above the solitonic walls in the dye orientations and the adjacent LC director field (Fig. 2a–c), we find that the elasticity-mediated interactions between the solitonic quasiparticles can be equivalently represented with the help of topological elastic bonds connecting the neighbouring interacting quasiparticles (Fig. 2d), forming a many-body interaction system. Because the entire system is topologically neutral (no net topological charge), individual quasiparticles cannot be smoothly eliminated but rather can only vanish through annihilating pairs of them, which would require a large energetic barrier. By analysing the relative displacement distribution of neighbouring +1 Néel domain-wall solitons associated with different spatial lattices at different times in the space-time crystal, we find that the relative displacements follow a Gaussian distribution (Fig. 2e), corresponding to an effective harmonic potential energy landscape (Fig. 2f) under small thermally driven displacements. Such an energy landscape describing the quasiparticle interactions resembles that found in a colloidal particle crystal system in LC media41, where the energy differences are several kBTem values corresponding to ~10% displacements (kB is the Boltzmann constant and Tem is the temperature). This indicates that although all are emergent from and describable by the field theory of the LC director field, many-body interactions between the quasiparticles maintain the order of space-time crystals.
The close agreements between computer-simulated and experimental polarizing optical micrographs (Figs. 1e and 2g and Extended Data Fig. 4a,b) and three-photon excitation fluorescence polarizing microscopy images (Extended Data Fig. 4c,d) validate our analysis of CSTC configurations. Similarly, the theory–experiment agreements of space-time polarizing optical micrographs and videos support the reconstructed configuration of the CSTC (Figs. 1f and 2h and Supplementary Videos 1 and 4).
Diversity and control of space-time-periodic structures
In addition to the emergence of space-time-periodic domain-wall arrays, by superimposing the light patterns from two CSTCs, we find that the overlapping spatial solitonic arrays can allow us to form orthorhombic and monoclinic lattices. The corresponding combined space-time patterns exhibit the same space-time lattices (Extended Data Fig. 5). Owing to the non-equivalence between spatial and temporal coordinates, we only find the 1 + 1-dimensional (1 + 1D) space-time orthorhombic and monoclinic lattices (intrinsically different from the two-dimensional (2D) wallpaper space groups), consistent with previous theoretical proposals42. This result reveals the possibility of achieving a richer space-time group structure in higher dimensions, as obtained here by incorporating the time coordinate into the spatial-symmetry group42.
External stimuli allow for controlling the studied emergent spatiotemporal order. The temporal periodicity of CSTC increases as the driving light intensity decreases (Methods, Fig. 2i, Extended Data Fig. 6 and Supplementary Video 5). Below a certain threshold (~1 mW cm−2), the continuous space-time crystallization phase transforms into a time-symmetry-unbroken phase, where the LC director field becomes static. Computer simulations qualitatively reproduce this behaviour as the temporal periodicity decreases with increasing η (Fig. 2j and Supplementary Fig. 2), and the structure eventually relaxes to the spatially uniform planar state (Extended Data Fig. 7) at efficiencies below a certain threshold (η ≈ 0.3). The temporal periodicity also decreases with increasing temperature, until the system reaches a disorder phase (Fig. 2i,j). Noteworthily, the Frank elastic constants and birefringence of the LCs decrease by more than 30% within such a temperature change37, indicating a good robustness of the CSTCs that can withstand changes in these material parameters. Experimental observations with changing temperature and driving light intensity in the same sample are consistent with computer simulations that yield spatial periodicity relatively insensitive to temperature and light coupling efficiency. For different LC cells with high birefringence and varying thickness, the temporal periodicities can be controlled to range from tens of seconds to milliseconds (Supplementary Fig. 3). Second-scale time crystals could be used for interfacing with biological and organic holographic materials, which, in turn, can be potentially used for optical signal amplification, data storage and phase conjugation43.
Testing against stringent criteria for time-crystalline identification
Meeting a key criterion of time crystallinity29,30, our space-time crystals exhibit good robustness against spatial and temporal perturbations (Fig. 3). The CSTCs are found to recover defect-free order within tens of temporal periods after the emergence of a space-time dislocation (Fig. 3a). Interestingly, by reconstructing the space-time coordinates, we find that the profiles after dislocation emergence can be fitted by the nonlinear theory of an edge dislocation in smectic crystal systems (Fig. 3b), showing similarity of spatial and temporal quasiparticle displacements resembling that of molecules in smectics in higher dimensions44. The space-time crystals are also stable under temporal perturbations. To confirm robustness against temporal perturbations (Fig. 3c–i), we use blue light with temporally randomized intensity (randomly distributed within the range [α, 1]Wdriving, where α is the parameter controlling the strength of perturbation and Wdriving is the maximum driving light intensity) to illuminate the sample and red light in a separate channel for imaging (Supplementary Fig. 4), the continuous space-time crystallization order persists well under small temporal perturbations of the incident light intensity (α = 0.8 and Wdriving = 1.5 mW cm−2). The effect of temporal perturbations can be quantified by measuring the crystalline fraction parameter, Ξ (refs. 19,29). Both experiments and computer simulations show that the crystalline fraction does not change much when the perturbation is within a certain range (Fig. 3f–i), which corresponds to the space-time crystal phase. As α decreases, the perturbation becomes larger and Ξ suddenly drops, because the system experiences a phase transition and becomes disordered (Fig. 3g,i).
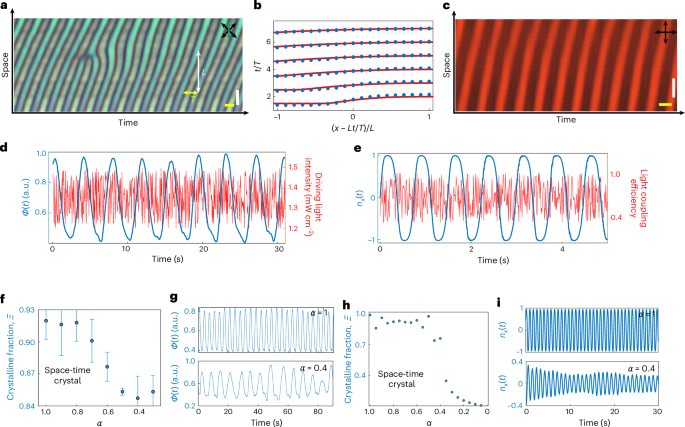
a, Space-time image showing that the CSTC order recovers from an emergence of space-time dislocation, with the stripe pattern’s slope of tan−1(L/T). b, Layer displacement profile prediction (red solid lines) fits the experimental results (blue dots) reconstructed from a. The horizontal coordinates are derived from the spatial coordinate x – tL/T. c, Space-time image of the CSTC under temporal perturbations. Scale bars, (a and c), 10 μm (white); 3 s (yellow). The retardation plate’s slow axis is labelled by the green double arrow and crossed polarizers are labelled by black double arrows. d, Normalized light signals Ф(t) when temporally randomizing the driving light intensity. The time interval for each random step is 0.1 s. e, Simulated realization obtained after temporally randomizing the light coupling efficiency. The time interval for each random step is 0.01 s. f, Experimentally measured crystal fraction \(\Xi =\mathop{\sum }\nolimits_{1/T-\delta }^{1/T+\delta }\varPhi ({\rm{\omega }}/2{\rm{\pi }})/\sum \varPhi ({\rm{\omega }}/2{\rm{\pi }})\) versus α, with error bars indicating standard deviations from ten realizations, the driving light intensity is randomly distributed in [α, 1]Wdriving, where Wdriving = 1.5 mW cm−2 and δ = 0.03 Hz. g, Normalized light signals Ф(t) for α = 1 (top) and α = 0.4 (bottom). h, Computer-simulated \(\Xi =\mathop{\sum }\nolimits_{1/T-\delta }^{1/T+\delta }{n}_{x}({\rm{\omega }}/2{\rm{\pi }})/\sum {n}_{x}({\rm{\omega }}/2{\rm{\pi }})\) versus α, with the light coupling efficiency randomly distributed in [α, 1]ηmax, where ηmax = 0.5 and δ = 0.03 Hz. i, Simulations for α = 1 (top) and α = 0.4 (bottom).
As anticipated for space-time crystals, the continuous time-translation symmetry of CSTCs is spontaneously broken independently of the driving light source. To reveal this, we repeatedly measure the time phase each time after blocking and shining blue light on a CSTC area (Fig. 4a,b), finding the relative time phases randomly distributed between 0 and 2π (Fig. 4c), as expected29,30,32,33. By blocking and unblocking the external light source and tracking the director field (Fig. 4d,e), we also reproduce this general behaviour in computer simulations that closely agree with experiments.
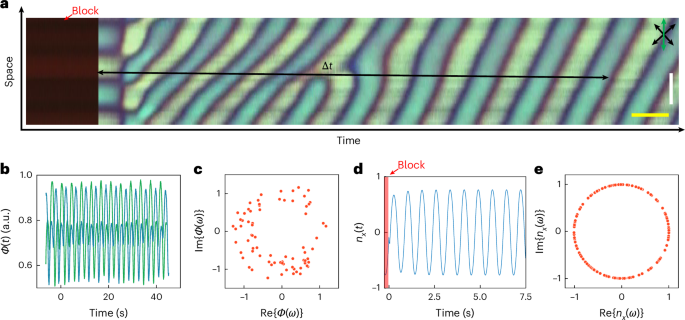
a, Space-time image of an experimental realization to measure the relative time phase. We first block the driving light with a red colour filter and then calculate the relative time phase with the light signal sequence Ф(t) after a time interval Δt. Scale bars, 10 μm (white); 3 s (yellow). The retardation plate’s slow axis is labelled by the green double arrow and crossed polarizers are shown by black double arrows. b, Normalized light signals captured within a small area versus time from two experimental realizations, which have a time phase difference of about π. c, Experimentally measured distribution of the relative time phases. d, Simulated realization that shows the evolution of the x component of the director after blocking–unblocking the external drive. e, Simulated distribution of relative time phases calculated using the x component of n(r).
Comparison with other classical time-periodic effects
We have described the observation of classical CSTCs in nematic LCs, which emerge at room temperature and can be designed to be seen by optical microscopes or even directly by human eyes. These spatiotemporal states usually emerge within an area (Extended Data Figs. 3 and 8 and Supplementary Video 6) in which the one-dimensional spatial symmetry and temporal symmetry are spontaneously broken in a continuous manner, forming 1 + 1D CSTCs. This emergent behaviour is different from the case of active (moving) crystals, where a pre-set crystal structure can spatially translate as it periodically enters similar states of the spatially periodic lattice, driven by external electric signals45. The breaking of temporal symmetry of these active crystals refers to the breaking of spatial translation symmetry, and the active lattice time periodicity depends on the collective moving speed45 of spatial crystallites, different from our time crystals.
CSTCs persist locally for hours whereas the temporal periodicity changes only slightly (by ~10%) after ~1 h of observations, where the properties of LCs largely define their behaviour. The emergent bonded quasiparticles reveal robustness against temporal and spatial perturbations, demonstrating intrinsic time-crystallinity features and meeting identification criteria that so far have not been probed for other classical temporally periodic systems like chemical oscillators and dissipative structures (potential candidates for time crystallinity of physical behaviour, which remain to be tested against the identification criteria), whereas our CSTC is a classical topological solitonic system that meets all the time crystal’s stringent requirements introduced so far29,30,31,32,33,46.
Although we focused on 1 + 1D CSTCs, by introducing higher-dimensional topological solitons or defects and their arrays40,47,48, 2 + 1D and 3 + 1D and other CSTCs can be potentially observed. Furthermore, the demonstrated pre-designed realization of continuous time crystals in classical soft-matter systems may stimulate efforts towards realizing discrete time and space-time crystals, where facile responses of LCs to external stimuli can be harnessed too. Overall, unambiguous demonstrations of time-crystalline physical behaviour in highly technological LC materials have the potential of harnessing exciting developments and unexpected observations in time-crystalline systems to enable their technological utility, as we illustrate with examples below.
Technological potential
CSTCs in highly technological LC materials promise applications in optical devices, photonic space-time crystal generators and telecommunications. Since the spatial structures of CSTCs consist of Néel domain-wall solitons, when polarized light passes through the nematic LC slab with such topological solitons at one surface and periodic director deformations extending throughout the nematic bulk, the traversing polarized light accumulates phase retardation according to the director’s spatially and temporally varying orientations (Fig. 5). This property may enable the fabrication of dynamic time-crystalline Pancharatnam–Berry phase (geometric phase) gratings and lenses (also known as cycloidal diffractive waveplates)49,50. We note that the phase accumulations vary not only with spatial coordinates but also with temporal coordinates, where the outgoing light’s polarization state depends on the wavelength and polarization of the input light (Fig. 5b–d). We, therefore, foresee that such LC-based space-time crystals can be developed further for generating photonic space-time crystals, assuming that the spatial periodicity can be reduced to approach the visible light’s wavelengths51 and the temporal frequencies can be much higher11. In addition, one can combine CSTC-modulated light with the driving light, allowing CSTCs to change the polarization states of the accompanying modulated light without affecting the CSTC’s four-dimensional structures. For example, as the typical wavelength range used in fibre optical telecommunications (>850 nm) differs from that of the driving light (~450 nm) to which the azobenzene dye is sensitive, optical signal modulation and information encoding at wavelengths outside the spectral range of the azobenzene dye’s sensitivity could be implemented based on the CSTC’s robust temporal and spatial order (Fig. 5c,d).
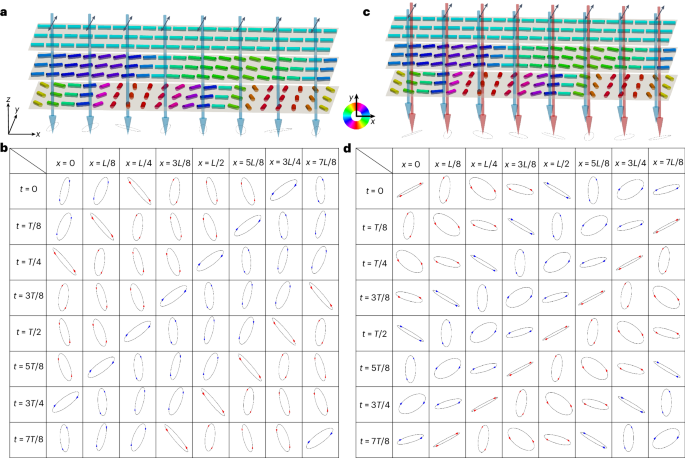
a, Schematic of the phase accumulation process when the blue driving light (450 nm, shown by blue arrows) passes through the cell. b, Spatial and temporal distributions of the output light polarizations within one temporal (T) and spatial (L) period, as the 450-nm linearly polarized input driving light passes through the cell. c, Schematic of the phase accumulation process when the modulated light (1,300 nm; red arrows) passes through the cell. Linear and elliptical polarization states of the light in a and c are marked by the black double arrows and ellipses, respectively. Cylinder colours represent the azimuthal angles of n(r) orientation defined by the scheme in the right inset of a. d, Spatial and temporal distributions of the output light polarizations within one T and L period, as the 1,300-nm linearly polarized input modulated light passes through the cell. In b and d, left- and right-handed elliptical polarization states are marked by blue and red arrows, respectively.
The ambient-intensity, light-driven and non-contact properties of CSTCs make them suitable for anti-counterfeiting52 with protection at multiple implementation levels in which the temporal and spatial periodic structures can spontaneously emerge (Fig. 6a–c). This ‘time watermark’ can be fabricated at low cost, since a 1 cm × 1 cm × 2 μm sample requires only ~2 × 10⁻⁴ g of LC and a surface monolayer with <10−14 g of the azobenzene dye that can be sandwiched between glass or other surfaces35. Owing to the spontaneous temporal-symmetry breaking, the time crystals can be exploited in pseudo-random number generators30. By combining multiple CSTCs, the synthetic systems generate unique, fingerprint-like states corresponding to spatiotemporal topological soliton arrays (Fig. 6d,e) each time they emerge, maintaining order for a remarkably long time (Extended Data Fig. 2). Additionally, the phases of CSTCs can be tuned by smoothly switching the driving light intensity (Fig. 6f), allowing for the creation of a 2 + 1D barcode via superimposing multiple CSTCs (Fig. 6g and Supplementary Video 7). As the 2D barcode can store over 100 times more bits than a 1D barcode, the capacity of storing information with proper data coding in higher-dimensional barcodes like 2 + 1D is effectively unbounded owing to the extra temporal coordinate (>100,000 bits per second)53. The intrinsic robustness of the space-time order, supported by the time crystallinity of topological solitons, could further enhance the error correction capabilities of 2 + 1D barcodes. For the third level of anti-counterfeiting uses, the temporal periodicity of CSTCs can be utilized as keys in cryptographic systems. For example, with two CSTCs having temporal periodicities T1 and T2 (assuming T1 < T2), an identical spatial pattern only recurs after a time interval of (T1 × T2)/(T2 – T1) (Fig. 6h and Supplementary Video 5), which could be used to check authenticity. CSTCs with different temporal periodicities can be introduced by incorporating pre-programmed light intensity filters. The entire system may display disorder-like spatiotemporal behaviour; however, within each CSTC, the time-crystalline order with a specific temporal periodicity can be maintained for a long time. Overall, the entire fingerprint-like CSTC states can be precisely predicted if the information about the pre-programmed light intensity filters (the system’s keys) is known (Fig. 6i) and can be utilized for anti-counterfeiting purposes.
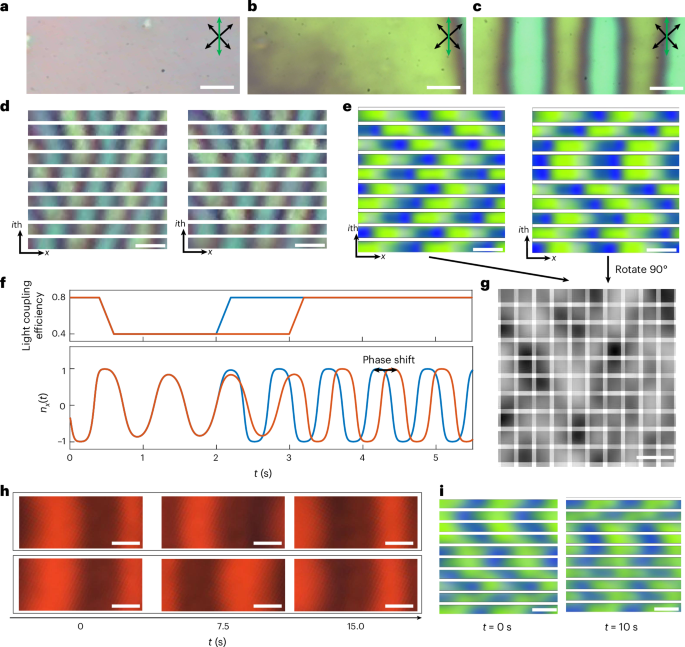
a–c, Polarizing optical micrographs of disordered states (a and b) and the CSTC of spatiotemporal topological solitons (c) that can serve as a time watermark. d, Two spontaneously formed experimental fingerprint states assembled from multiple CSTCs. e, Another pair of spontaneously formed numerically simulated fingerprint states assembled from multiple CSTCs. These fingerprint states are non-identical and the vertical axis in d and e represents individual CSTCs. f, By smoothly changing the light coupling efficiency (top) in different realizations (plot with blue and red, respectively), the continuous space-time crystallization phase, shown by the evolution of the x component of n(r), can be tuned to any desired angle (bottom); the phase difference depends on the tunning process. g, Snapshot of a 2 + 1D barcode created by superimposing two fingerprint states, displayed in the greyscale scheme. Using the phase-tuning method, information can be encoded and stored in this 2 + 1D barcode. h, Polarizing optical micrographs of two CSTCs, captured over time. The temporal periodicity of the top-row CSTC is 3.48 s, whereas that of the bottom row is 4.54 s. Thus, after ~15 s (14.90 s), the phase of the top CSTC aligns with that of the bottom one. i, Fingerprint states assembled from numerically simulated CSTCs over a 10-s interval, with each row’s CSTC having a different T. The right fingerprint state cannot be generated by shifting the left fingerprint state by the same phase angle. However, if the temporal periodicity of CSTCs in each row is known, the right fingerprint state can be predicted from the left fingerprint state. Scale bars, 10 μm (white; a–e, g–i).
Conclusions
Our observations of CSTCs may indicate an abundance of time crystallization in soft-matter systems like LCs, promoting studies of space-time groups with their topological properties42. Although meeting the current ‘stringent criteria’ for identifying the time-crystalline order, our study of CSTCs points to the need of examining other classical time-periodic effects in various physical and chemical systems to test if they can be identified as time crystalline, where new ‘identity’ criteria may be needed to differentiate them. The diverse forms of true or pseudo-time crystallinity will drive the development of materials with fundamentally interesting and technologically useful emergent nonlinear phenomena, like the one described here. Indeed, our findings suggest that spontaneous symmetry breaking in both time and space can be a widespread occurrence in numerous open systems, whether in a quantum or in a classical context. On the other hand, the fact that time crystal states can occur in LCs with a myriad of technological uses under conditions compatible with many technological needs may suggest new breeds of electro-optic and photonic devices54,55. Potential technological applications in optical devices, photonic space-time crystal generators, telecommunications and anti-counterfeiting designs may signal the beginning of an exciting frontier for time and space-time crystals, where fundamental research advances could drive technological utility.
Methods
Materials and sample preparation
Glass substrates are coated with the photoresponsive material 2-(4-dimethylamino-phenylazo)-N-(3-triethoxysilane-propyl)-benzamide (dMR)35,56, which is sensitive to blue and violet light and insensitive to red light. To coat a monolayer dMR on glass surfaces, we submerge glass plates into a 1-wt% solution of dMR in toluene at a temperature of 45 °C. After 90-min submersion, the dMR molecules are bonded to the glass surfaces; we then wash away the excess dMR by a toluene rinse, followed by blowing the glass plates with dry nitrogen and curing them at 115 °C for 2 h. The LC cells are constructed using two glass substrates coated with monolayers of dMR, where the cell thickness d = 2–4 μm is defined by glass spheres mixed with a methanol-diluted epoxy. Once the epoxy has cured, we fill the cell via capillary forces with nematic 4-cyano-4′-pentylbiphenyl (EM Chemicals).
Optical imaging and video microscopy
Polarizing optical micrographs and videos are obtained with a multi-modal imaging setup built around an IX-81 Olympus inverted optical microscope (which is integrated with the three-photon excitation fluorescence polarizing microscopy imaging setup described below) and an IX-83 inverted optical microscope (which is integrated with the driving light intensity control system), with charge-coupled device cameras (Grasshopper, Point Grey Research). High-numerical-aperture (NA) Olympus objectives ×100, ×40, ×20 and ×10 with NA = 1.4, 0.75, 0.4 and 0.4, respectively, are used. The schematics of the used microscopes are shown in Fig. 1a and Supplementary Fig. 4. When recording the videos of CSTCs, we noted that within some small regions, the light signals may vary periodically over time and have no quasi-long-range temporal order (Supplementary Fig. 5) compared with the CSTCs, which is expected owing to the lack of many-body interactions.
Nonlinear optical imaging of the CSTC structures is performed using the three-photon excitation fluorescence polarizing microscopy setup built around the IX-81 Olympus inverted optical microscope57. We use a Ti-sapphire oscillator (Chameleon Ultra II, Coherent) operating at 870 nm with 140-fs pulses at an 80-MHz repetition rate, as the source of the laser excitation light. An oil-immersion ×100 objective (NA = 1.4) is used to collect the fluorescence signals, which are detected by a photomultiplier tube (H5784-20, Hamamatsu) after a 417/60-nm bandpass filter. With a third-order nonlinear process, the LC molecules are excited via the three-photon absorption process and the signal intensity scales as ∝cos6β0, where β0 is the angle between the polarization of the excitation light and the long axis of the LC molecule. We utilize a half-wave plate to control the different polarization states of excitation. When n(r) is nearly parallel to the polarization of the laser beam, a large cosβ0 corresponds to a strong three-photon excitation fluorescence polarizing microscopy signal intensity. Computer simulations of the three-photon excitation fluorescence polarizing microscopy images are also based on the signal intensity. The 2D cross-sections, produced from both experimental and numerical data, for different linear polarizations of excitation light, are shown in Extended Data Fig. 4c,d.
Quasi-long-range order and relative time phases of the CSTC
To obtain the time order of CSTCs, we calculate the correlation function G in the time coordinate, which is a common tool for analysing the spatial order of crystals and LCs. For crystals, the spatial correlation function G(r) is a constant, where r is the distance between the two measured positions. For smectic LCs, the spatial correlation function G(r) decays as ~r−ζ (ζ < 0.15) along the smectic layers, which is a quasi-long-range order37. For CSTCs, we measure the normalized digital signal Фi(t) of each pixel at different times. The correlation function G(t) = ∑iGi(t) = ∑i〈Фi(t)Фi(0)〉 – 〈Фi(t)〉〈Фi(0)〉 is calculated with 2,200 spatial pixels and 9,000 temporal frames, showing a quasi-long-range order in time.
In experiment, the relative time phases are measured from 75 experimental realizations. In each realization, the driving light is blocked with a red colour filter at first (allowing only red colour light to pass through). Subsequently, we remove the red colour filter, and the CSTC spontaneously emerges. After a time interval Δt (Δt = 60 s), we start measuring the light signals from the recorded video, and calculate the phase using the fast Fourier transform analysis function in MATLAB (version R2020a; MathWorks).
Numerical modelling of solitonic quasiparticles and their crystals
The elastic energy cost of spatial deformations in the bulk of n(r) is expressed in equation (1) and the surface energy is expressed in equation (2). The total Frank–Oseen free energy F is the sum of these two terms, and a relaxation routine based on the variational method is used to identify an energy-minimizing configuration n(r). At each iteration, n(r) is updated based on a formula derived from the Euler–Lagrange equation:
$${{\bf{n}}}_{i}^{{\rm{new}}}={{\bf{n}}}_{i}^{{\rm{old}}}-\frac{{\rm{MSTS}}}{2}\frac{\delta F}{\delta {{\bf{n}}}_{i}},$$
(3)
where \(\frac{\delta F}{\delta {{\bf{n}}}_{i}}\) denotes the functional derivative of the total free energy with respect to ni, and MSTS is the maximum stable time step of the minimization routine, determined by the elastic constants and the spacing of the computational grid. To scale the time step in a real system, we assume that the director is governed by the balance equation \(\frac{\delta F}{\delta {{\bf{n}}}_{i}}=-{\rm{\gamma }}\frac{\partial {{\bf{n}}}_{i}}{\partial t}\). Combining with equation (3), we have the time interval \(\Delta {\rm{\tau }}=\frac{{\rm{MSTS}}}{2}{\rm{\gamma }}\) for each iteration. After obtaining n(r) at each iteration, we calculate the electric and magnetic fields of the driving light (450 nm) traversing through the LC, which is linearly polarized initially. At the top surface (Fig. 2a), the light does not interact with the LC field, so the polarization remains along the initial direction—y direction—and drives the surface director ns to orient along the x direction. When it passes through the cell and interacts with the LC, because of the birefringence of the LC host medium (Supplementary Table 2), the linearly polarized light becomes elliptically polarized light. After it passes through the LC’s bulk, the surface director at the bottom surface (Fig. 2a) is driven to orient perpendicular to the direction of electric field (real part) of the Jones vector. With the new orientation of ns, n(r) is updated in the next iteration.
The initial condition of n(r) comes from the spontaneous emergence of the CSTC (Extended Data Fig. 3). To avoid the edge effects on the lateral sides, we apply the periodic boundary condition (with three repeat units along the x direction; Fig. 2g) to obtain the continuous space-time crystallization phase. The 3D spatial discretization is performed on 3D square-periodic 120 × 10 × 10 grids, and the spatial derivatives are calculated using finite-difference methods with the second-order accuracy, we find that double or triple the system size does not affect the temporal periodicity. In simulations, we use the physical parameters of 4-cyano-4′-pentylbiphenyl as the model LC also used in experiments. The temperature-dependent parameters K11, K22, K33 and Δn (birefringence) are fitted with the empirical equations:
$${{\varOmega }}={A}_{\text{e}}+{B}_{\text{e}}{(\Delta {T}_{{\text{em}}}-{T}_{\text{e}})}^{1/2}+{C}_{\text{e}}(\Delta {T}_{{\text{em}}}-{T}_{\text{e}})+{D}_{\text{e}}{(\Delta {T}_{{{\text{em}}}}-{T}_{\text{e}})}^{3/2},$$
(4)
where ΔTem denotes the difference between the nematic–isotropic transition temperature TNI = 35.1 °C and the LC temperature; Ae, Be, Ce, De and Te are fitting coefficients; and Ω is a temperature-dependent parameter (Supplementary Tables 1 and 2 and Supplementary Fig. 1). For all simulations, d = 3 μm, γ = 77 mPa s and W = 10−5 J m−2.
The polarizing optical micrographs are simulated by means of the Jones matrix method, using the configurations of n(r) at a certain moment for the CSTCs. Briefly, we first split the cell into ten thin sublayers along the z direction and then calculate the Jones matrix for each pixel in each sublayer by identifying the local optical axis and ordinary and extraordinary modes’ phase retardation, originating from optical anisotropy. We obtain the Jones matrix for the whole LC cell by multiplying all Jones matrices corresponding to each sublayer, and a 530-nm retardation plate is included for an extra Jones matrix. The simulated single-wavelength polarizing optical micrograph is obtained as the respective component of the product of the Jones matrix and the incident light’s polarization. To properly reproduce the polarizing optical micrographs observed in the experiments, we produced images separately for three different wavelengths spanning the visible spectrum (450 nm, 550 nm and 650 nm) and then superimposed them, according to experimental light source intensities at the corresponding wavelengths.
Data availability
Source data are provided with this paper. All other data that support the plots within this paper and other findings of this study are available from the corresponding author upon request.
Code availability
The codes used for the numerical calculations are available upon request.
References
Chaikin, P. M. & Lubensky, T. C. Principles of Condensed Matter Physics (Cambridge Univ. Press, 2000).
Yeh, P. & Gu, C. Optics of Liquid Crystal Displays (Wiley, 2010).
Wilczek, F. Quantum time crystals. Phys. Rev. Lett. 109, 160401 (2012).
Shapere, A. & Wilczek, F. Classical time crystals. Phys. Rev. Lett. 109, 160402 (2012).
Wilczek, F. Superfluidity and space-time translation symmetry breaking. Phys. Rev. Lett. 111, 250402 (2013).
Bruno, P. Impossibility of spontaneously rotating time crystals: a no-go theorem. Phys. Rev. Lett. 111, 070402 (2013).
Watanabe, H. & Oshikawa, M. Absence of quantum time crystals. Phys. Rev. Lett. 114, 251603 (2015).
Sacha, K. & Zakrzewski, J. Time crystals: a review. Rep. Prog. Phys. 81, 016401 (2017).
Yao, N. Y. & Nayak, C. Time crystals in periodically driven systems. Phys. Today 71, 40–47 (2018).
Khemani, V., Moessner, R. & Sondhi, S. L. A brief history of time crystals. Preprint at https://doi.org/10.48550/arXiv.1910.10745 (2019).
Sacha, K. Time Crystals (Springer International Publishing, 2020).
Guo, L. Phase Space Crystals: Condensed Matter in Dynamical Systems (IOP Publishing, 2021).
Zaletel, M. P. et al. Colloquium: quantum and classical discrete time crystals. Rev. Mod. Phys. 95, 031001 (2023).
Sacha, K. Modeling spontaneous breaking of time-translation symmetry. Phys. Rev. A 91, 033617 (2015).
Khemani, V., Lazarides, A., Moessner, R. & Sondhi, S. L. Phase structure of driven quantum systems. Phys. Rev. Lett. 116, 250401 (2016).
Else, D. V., Bauer, B. & Nayak, C. Floquet time crystals. Phys. Rev. Lett. 117, 090402 (2016).
Yao, N. Y., Potter, A. C., Potirniche, I.-D. & Vishwanath, A. Discrete time crystals: rigidity, criticality, and realizations. Phys. Rev. Lett. 118, 030401 (2017).
Zhang, J. et al. Observation of a discrete time crystal. Nature 543, 217–220 (2017).
Choi, S. et al. Observation of discrete time-crystalline order in a disordered dipolar many-body system. Nature 543, 221–225 (2017).
Smits, J., Liao, L., Stoof, H. T. C. & van der Straten, P. Observation of a space-time crystal in a superfluid quantum gas. Phys. Rev. Lett. 121, 185301 (2018).
Liao, L., Smits, J., van der Straten, P. & Stoof, H. T. C. Dynamics of a space-time crystal in an atomic Bose-Einstein condensate. Phys. Rev. A 99, 013625 (2019).
Smits, J., Stoof, H. T. C. & van der Straten, P. Spontaneous breaking of a discrete time-translation symmetry. Phys. Rev. A 104, 023318 (2021).
Randall, J. et al. Many-body–localized discrete time crystal with a programmable spin-based quantum simulator. Science 374, 1474–1478 (2021).
Keßler, H. et al. Observation of a dissipative time crystal. Phys. Rev. Lett. 127, 043602 (2021).
Taheri, H., Matsko, A. B., Maleki, L. & Sacha, K. All-optical dissipative discrete time crystals. Nat. Commun. 13, 848 (2022).
Taheri, H., Matsko, A. B., Herr, T. & Sacha, K. Dissipative discrete time crystals in a pump-modulated Kerr microcavity. Commun. Phys. 5, 159 (2022).
Mi, X. et al. Time-crystalline eigenstate order on a quantum processor. Nature 601, 531–536 (2022).
Frey, P. & Rachel, S. Realization of a discrete time crystal on 57 qubits of a quantum computer. Sci. Adv. 8, eabm7652 (2022).
Kongkhambut, P. et al. Observation of a continuous time crystal. Science 377, 670–673 (2022).
Liu, T., Ou, J.-Y., MacDonald, K. F. & Zheludev, N. I. Photonic metamaterial analogue of a continuous time crystal. Nat. Phys. 19, 986–991 (2023).
Chen, Y.-H. & Zhang, X. Realization of an inherent time crystal in a dissipative many-body system. Nat. Commun. 14, 6161 (2023).
Wu, X. et al. Dissipative time crystal in a strongly interacting Rydberg gas. Nat. Phys. 20, 1389–1394 (2024).
Greilich, A. et al. Robust continuous time crystal in an electron–nuclear spin system. Nat. Phys. 20, 631–636 (2024).
Carraro-Haddad, I. et al. Solid-state continuous time crystal in a polariton condensate with a built-in mechanical clock. Science 384, 995–1000 (2024).
Yi, Y., Farrow, M. J., Korblova, E., Walba, D. M. & Furtak, T. E. High-sensitivity aminoazobenzene chemisorbed monolayers for photoalignment of liquid crystals. Langmuir 25, 997–1003 (2009).
Landau, L. D. & Lifshitz, E. M. Statistical Physics (Elsevier, 2013).
de Gennes, P. G. & Prost, J. The Physics of Liquid Crystals (Clarendon Press, 1993).
Reichhardt, C., Reichhardt, C. J. O. & Milošević, M. V. Statics and dynamics of skyrmions interacting with disorder and nanostructures. Rev. Mod. Phys. 94, 035005 (2022).
Smalyukh, I. I. Review: knots and other new topological effects in liquid crystals and colloids. Rep. Prog. Phys. 83, 106601 (2020).
Zhao, H., Tai, J.-S. B., Wu, J.-S. & Smalyukh, I. I. Liquid crystal defect structures with Möbius strip topology. Nat. Phys. 19, 451–459 (2023).
Mundoor, H., Senyuk, B. & Smalyukh, I. I. Triclinic nematic colloidal crystals from competing elastic and electrostatic interactions. Science 352, 69–73 (2016).
Xu, S. & Wu, C. Space-time crystal and space-time group. Phys. Rev. Lett. 120, 096401 (2018).
Gallego-Gómez, F., del Monte, F. & Meerholz, K. Optical gain by a simple photoisomerization process. Nat. Mater. 7, 490–497 (2008).
Brener, E. A. & Marchenko, V. I. Nonlinear theory of dislocations in smectic crystals: an exact solution. Phys. Rev. E 59, R4752–R4753 (1999).
Sohn, H. R. O. & Smalyukh, I. I. Electrically powered motions of toron crystallites in chiral liquid crystals. Proc. Natl Acad. Sci. USA 117, 6437–6445 (2020).
Prigogine, I. Time, structure, and fluctuations. Science 201, 777–785 (1978).
Zhang, R. et al. Spatiotemporal control of liquid crystal structure and dynamics through activity patterning. Nat. Mater. 20, 875–882 (2021).
Zhao, H., Malomed, B. A. & Smalyukh, I. I. Topological solitonic macromolecules. Nat. Commun. 14, 4581 (2023).
Lee, Y.-H. et al. Recent progress in Pancharatnam–Berry phase optical elements and the applications for virtual/augmented realities. Opt. Data Process. Storage 3, 79–88 (2017).
Cohen, E. et al. Geometric phase from Aharonov–Bohm to Pancharatnam–Berry and beyond. Nat. Rev. Phys. 1, 437–449 (2019).
Lyubarov, M. et al. Amplified emission and lasing in photonic time crystals. Science 377, 425–428 (2022).
Chang, T. et al. Cellulose nanocrystal chiral photonic micro-flakes for multilevel anti-counterfeiting and identification. Chem. Eng. J. 446, 136630 (2022).
Huang, W. & Mow, W. H. PiCode: 2D barcode with embedded picture and ViCode: 3D barcode with embedded video. In Proc. 19th Annual International Conference on Mobile Computing & Networking 139–142 (ACM, 2013).
Chang, S. et al. Electrical tuning of branched flow of light. Nat. Commun. 15, 197 (2024).
Poy, G. et al. Interaction and co-assembly of optical and topological solitons. Nat. Photon. 16, 454–461 (2022).
Martinez, A., Mireles, H. C. & Smalyukh, I. I. Large-area optoelastic manipulation of colloidal particles in liquid crystals using photoresponsive molecular surface monolayers. Proc. Natl Acad. Sci. USA 108, 20891–20896 (2011).
Lee, T., Trivedi, R. P. & Smalyukh, I. I. Multimodal nonlinear optical polarizing microscopy of long-range molecular order in liquid crystals. Opt. Lett. 35, 3447–3449 (2010).
Acknowledgements
We thank T. Lee for technical assistance, L. Longa, B. Malomed and L. Guo for discussions, and Q. Liu and Y. Yuan for synthesizing the azobenzene dye molecules. I.I.S. acknowledges the hospitality of the International Institute for Sustainability with Knotted Chiral Meta Matter (SKCM2) in Japan when he was partly working on this article while on a sabbatical. This research was supported by the US Department of Energy, Office of Basic Energy Sciences, Division of Materials Sciences and Engineering, under contract number DE-SC0019293 with the University of Colorado at Boulder.
Ethics declarations
Competing interests
H.Z. and I.I.S. filed a patent application related to CSTCs, as submitted by the University of Colorado concurrently with this paper (US patent application no. 63/764,363).
Peer review
Peer review information
Nature Materials thanks Young-Ki Kim, Congjun Wu and the other, anonymous, reviewer(s) for their contribution to the peer review of this work.
Additional information
Publisher’s note Springer Nature remains neutral with regard to jurisdictional claims in published maps and institutional affiliations.
Extended data
Extended Data Fig. 1 CSTC in a thick cell.
Space-time image of a CSTC obtained for the cell thickness d = 4 μm. White scale bar indicates 50 μm; yellow scale bar indicates 10 s. The retardation plate’s slow axis is labelled by the green double arrow and crossed polarizers by black double arrows.
Extended Data Fig. 2 Quasi-long-range order of a CSTC.
Correlation function G(t) versus time. The red solid line is the fit of power law decay, with an exponent of −0.09, indicating quasi-long-range order in time.
Extended Data Fig. 3 Spontaneous emergence of the CSTC in computer simulations.
a, Director field n(r) in the x-z cross-section that has a small perturbation on the left side. The structure is invariant along the y direction. b-d, Simulated director field n(r) shows the spontaneous emergence of spatially periodic structures stemming from a small perturbation starting from (a). The cylinder colours represent azimuthal angles of the director orientation as defined by the coloured circle in the bottom right of (a). The elapsed times are marked on their top and the light propagation directions are marked on their right, respectively. e-h, Simulated polarizing optical micrographs corresponding to the structures of director field of (a-d), respectively. The retardation plate’s slow axes are labelled by green double arrows and crossed polarizers by black double arrows. White scale bars indicate 5 μm.
Extended Data Fig. 4 Polarizing optical micrographs and three-photon excitation fluorescence polarizing microscopy of CSTCs.
a,b, Experimental (a) and numerically simulated (b) polarizing optical micrographs of CSTCs. The slow axes of a phase retardation plate are labelled by green double arrows and crossed polarizers by black double arrows. c,d, Experimental (c) and numerically simulated (d) three-photon excitation fluorescence polarizing microscopy images obtained for different linearly polarized femtosecond laser excitations, with marked excitation light polarizations (blue double arrows). White scale bars indicate 5μm.
Extended Data Fig. 5 Time-crystalline diversity from superposition of two CSTCs.
a, An orthorhombic lattice pattern generated by orthogonally superimposing polarizing optical micrograph snapshots of two CSTCs. b, An orthorhombic lattice pattern derived from space-time images of two CSTCs, where the selected area is marked in (a) with dashed rectangles. c, A monoclinic lattice pattern generated by obliquely superimposing polarizing optical micrograph snapshots of two CSTCs. d, A monoclinic lattice pattern produced from space-time images of two CSTCs, where the selected area is marked in (c) with dashed rectangles. The 2×2 white lattices in (b) and (d) correspond to the orthorhombic and monoclinic lattices, respectively. Spatial and temporal axes are labeled in each image.
Extended Data Fig. 6 CSTCs driven by different driving light intensities.
Space-time images of CSTCs with different temporal periodicity driven by the low (top) and high (bottom) intensity, respectively. White scale bars indicate 20 μm and yellow scale bars indicate 10 s; the crossed polarizers are labelled by black double arrows.
Extended Data Fig. 7 The time symmetry unbroken state.
a, Simulated director field of the TSU phase. The structure is invariant along the y direction, and the illustrated x-y cross-section of director field is at the mid-plane along z direction of the sample. The polarization of the linearly polarized light is along y direction at the top surface, and the propagation direction is marked on the right. The cylinders are coloured based on the azimuthal angles of the director, as defined by the coloured circle on the bottom right. b,c, Experimental (b) and numerically simulated (c) polarizing optical micrographs of the TSU phase. White scale bars indicate 20μm; the slow axes of a phase retardation plate are labelled by green double arrows and crossed polarizers by black double arrows.
Extended Data Fig. 8 Polarizing optical micrograph shows the CSTC and emerging area.
The CSTC area shows a good spatial and temporal periodicity, which appears from the emerging area. White scale bar indicates 50μm. The slow axis of a phase retardation plate is labelled by the green double arrow; crossed polarizers by black double arrows.
Supplementary information
Supplementary Information
Supplementary Figs. 1–5, Tables 1 and 2 and references.
Supplementary Video 1
Video showing the onset of spontaneous time- and space-symmetry breaking of a thin cell. The polarizing optical micrograph video is obtained for a cell gap of d = 2 μm. The orientations of the crossed polarizer and analyser, elapsed time and scale bar are marked on the video frames. The slow axis of the 530-nm retardation plate is marked with the green double arrow.
Supplementary Video 2
Video showing the onset of spontaneous time- and space-symmetry breaking in a thick cell. The polarizing optical micrograph video is obtained for a cell gap of d = 4 μm. The orientations of the crossed polarizer and analyser, elapsed time and scale bar are marked on the video frames. The slow axis of the 530-nm retardation plate is marked with the green double arrow.
Supplementary Video 3
Four-dimensional structures of CSTCs. Schematic showing the time-dependent director field at the confining surface (left), in the bulk (mid), and both (right). The cuboids at the bottom and top surfaces represent the surface director ns, coloured in dark red. The cylinders in the bulk represent the director n, coloured based on the orientations of director in the same way as in Fig. 2a. The propagation direction of linearly polarized light is marked with the blue arrow, and the initial polarization is perpendicular to the director at the bottom surface.
Supplementary Video 4
Numerically simulated polarizing optical microscopy video of the CSTC. The orientations of the crossed polarizer and analyser, elapsed time and slow axis of the 530-nm retardation plate (green double arrow) are marked on the video frames.
Supplementary Video 5
Temporal periodicity of CSTCs controlled by driving light intensity. Polarizing optical micrograph videos show the CSTCs controlled by the intensity of driving light of low (left) and high (right) intensity. The sample imaging is done using red light. The cell gap is d = 2 μm, and the elapsed time, orientations of crossed polarizer and analyser, and the scale bar are marked on the video frames.
Supplementary Video 6
The spontaneous emergence of CSTCs. Polarizing optical microscopy video showing the spontaneous formation of the CSTC from an emerging area. The cell gap thickness is d = 4 μm; the elapsed time, orientations of crossed polarizer and analyser, and scale bar are marked on the video frames. The slow axis of the 530-nm retardation plate is marked with the green double arrow.
Supplementary Video 7
2 + 1D barcode. Numerically simulated greyscale polarizing optical microscopy video of the CSTC assembly, arranged in a 10 × 10 grid made of 1 + 1D CSTCs (ten vertical and ten horizontal).
Rights and permissions
Open Access This article is licensed under a Creative Commons Attribution-NonCommercial-NoDerivatives 4.0 International License, which permits any non-commercial use, sharing, distribution and reproduction in any medium or format, as long as you give appropriate credit to the original author(s) and the source, provide a link to the Creative Commons licence, and indicate if you modified the licensed material. You do not have permission under this licence to share adapted material derived from this article or parts of it. The images or other third party material in this article are included in the article’s Creative Commons licence, unless indicated otherwise in a credit line to the material. If material is not included in the article’s Creative Commons licence and your intended use is not permitted by statutory regulation or exceeds the permitted use, you will need to obtain permission directly from the copyright holder. To view a copy of this licence, visit http://creativecommons.org/licenses/by-nc-nd/4.0/.
About this article
Cite this article
Zhao, H., Smalyukh, I.I. Space-time crystals from particle-like topological solitons. Nat. Mater. (2025). https://doi.org/10.1038/s41563-025-02344-1
Received: 23 March 2024
Accepted: 07 August 2025
Published: 04 September 2025
DOI: https://doi.org/10.1038/s41563-025-02344-1